Confusion of Extragalactic Sources in the Mid- and
Far-Infrared:
Spitzer and beyond
Abstract
We use the source counts measured with the Multiband Imaging Photometer for Spitzer (MIPS) at 24, 70, and 160 m to determine the 5- confusion limits due to extragalactic sources: Jy, 3.2 and 40 mJy at 24, 70 and 160 m, respectively. We also make predictions for confusion limits for a number of proposed far infrared missions of larger aperture (3.5 to 10m diameter).
Subject headings:
infrared: galaxies – galaxies: evolution – galaxies: statistics1. Introduction
In addition to detector/photon noise, cosmological surveys in the far-infrared (FIR) spectral range are limited in depth by: 1.) structure in the infrared cirrus emission; and 2.) confusion by extragalactic sources. The first of these limitations can be avoided for some programs by observing in particularly low-background regions on the sky The second limitation arises because the high density of faint (resolved or unresolved) distant galaxies creates signal fluctuations in the telescope beam (Condon 1974; Franceschini et al. 1989; Helou & Beichman 1990; Rieke et al. 1995; Dole et al. 2003; Takeuchi & Ishii 2004, for instance). Because distant galaxies are distributed roughly isotropically and with a high density compared to the beam size, this noise is unavoidable.
Extragalactic confusion noise can be robustly estimated by measurements of source counts combined with modeling to extend the counts to faint levels. We use new determinations of number counts in the three Multiband Imaging Photometer for Spitzer (MIPS, Rieke et al., 2004) bands, 24, 70, and 160 m Dole et al. (2004); Papovich et al. (2004), and a model fitting all those observables Lagache et al. (2004) to determine more accurate limits for extragalactic confusion than have been available previously. Extragalactic confusion noise does not strictly follow Gaussian statistics. Therefore, we discuss confusion limits in four different ways that are appropriate to various measurement situations: the photometric criterion and source density criterion (hereafter SDC) Dole et al. (2003), and the levels deduced from the source densities of one source per 20 and 40 independent beams. We parameterize the noise as a ”” limit calculated as if it were Gaussian, because it is difficult to derive any other simple metric. All the definitions and values relative to MIPS Spitzer beams are summarized in Table 1 of Dole et al. (2003).
We summarize the confusion limits for Spitzer in its three far-infrared bands in Table 1. The situation is different at 24 and 70 m than at 160 m. In the two first bands, where the background is resolved to a significant extent, the confusion mainly results from the high density of resolved sources and their interference with extraction of fainter ones: the SDC is the appropriate measure (and the classical photometric criterion underestimates the confusion level). In the third band, where the background is not well resolved, the confusion results from a population fainter than the sensitivity limit. In the latter case, confusion (and CIB fluctuation) properties are directly linked to galaxy populations not directly detectable but which modulate the background level: the photometric criterion is appropriate.
2. Confusion in the Mid- and Far- Infrared
2.1. Confusion of Extragalactic Sources at 24 m
The available measurements extend well into the extragalactic confusion regime at 24m, and the detector performance is also well understood even for long integrations. Therefore, we use this band to develop the general principles applicable to determining the confusion limits in Spitzer mid- and far-infrared imaging data.
2.1.1 Confusion Limit Calculation
Our confusion estimates are based on the methodology described by Dole et al. (2003). We have used the number counts determined by Papovich et al. (2004), extrapolated to fainter flux limits according to the model of Lagache et al. (2004). Because these counts indicate that the background will be largely resolved into individual sources, the appropriate measure of the confusion is the SDC. We obtain 56 Jy for the 5- confusion level, corresponding to 12 beams per source. It appears that this confusion level is in perfect agreement with the pre-launch predictions of Xu et al. (2001), even if it was derived differently. If it were limited by photon noise only, the instrument would reach a detection limit of 56 Jy 5- in 1900 seconds of integration Rieke et al. (2004), so the model predicts that the gain in signal to noise ratio will have leveled out significantly for integrations of this length.

There is excellent agreement between the observed 80% completeness level and source density of Papovich et al. (2004), and our SDC confusion level. However, it should be possible in principle to integrate below the 56 Jy level, on a selected field of very low source density. In the ”GOODS Test Field” in ELAIS N1 (described in Papovich et al. 2004), we estimate the area suitable for a deeper integration to be about 5% of the field area.
2.1.2 Noise Analysis
We desired a test of these predictions that was as much as possible independent of assumptions about the infrared galaxy population. For this purpose, we have characterized the noise in the 24 m data from the ELAIS N1 field, the deepest observation obtained to date at this wavelength. We selected a very cleanly reduced region in the field, about 2 x 4 arcmin in size. We prepared two versions of the image in this region, both reduced identically, but one with an integration of 630 seconds and the other with an integration of 3800 seconds. We determined the pixel signal histogram in two ways. 1.) On a small region that also appeared to be free of detected sources, we verified that the standard deviation as measured in these histograms scaled inversely with the square root of the integration time. 2.) On the entire 2 x 4 arcmin region, we fitted it with a Gaussian of width fixed to the expectation for detector/photon noise. We required this Gaussian to fit only the negative side of the histogram, on the assumption that there were no negative sources. We took the departure of the measured histogram from this fit toward positive fluctuations to be the influence of (at least) sources in the field. We measured the extension of the distribution toward positive values at half maximum. We found that the positive-going width of the distribution was larger than the pure detector/photon noise expectation by a factor of 1.7, in qualitative agreement with the effects of confusion. These excess fluctuations likely result from a combined effect of extragalactic sources, faint cirrus and zodiacal light gradient. It is not clear at this stage which component dominates the fluctuations.
| 24 m | 70 m | 160 m | |
|---|---|---|---|
| [Jy] | [mJy] | [mJy] | |
| SDCb | 56 | 3.2 | 40 |
| 20bc | 71 | 3.5 | 45 |
| 40bd | 141 | 6.3 | 63 |
| Phote | 8 | 0.7 | 45 |
2.1.3 Monte Carlo Simulation
To empirically quantify the effect of confusion, we carried out a Monte Carlo simulation of source extraction under the conditions appropriate for the Spitzer deep 24m exposures. The approach is described in detail by Rieke et al. (1995). We built up a test field by distributing confusing sources randomly according to a power law distribution matching the faint Spitzer number counts. Each source was entered as an Airy pattern. A test source of known amplitude was added to the center of the array, along with Gaussian noise. The sources were then identified using a modified CLEAN algorithm and finally the signal to noise was measured in a master array built up from the results of the CLEAN process, and in extraction apertures of various sizes. An important aspect of this simulation is that it combines the effects of neighboring bright sources and of the underlying, unresolved distribution of faint ones, in a consistent manner. It should give a good measure of the confusion noise independent of the division between source density and photometric criteria.
In the simulation, we excluded all objects brighter than 400Jy to avoid undo noise from bright-source artifacts. The first set of runs tested the extraction of a 56Jy source in an 0.8 /D beam, the beam size previously indicated to provide optimum performance in a heavily confusion-limited situation (Rieke et al. 1995 - this result was confirmed by the new calculations). We made 1200 runs for an integration time long enough to drive detector/photon noise down to 12.5Jy, 5-. They yielded a net 5- limit of 60Jy: removing the detector/photon noise leaves 59Jy of confusion noise. That is, this approach agrees well with the SDC-determined limit of 56Jy.
We also simulated the results to be expected from shorter integration times. For example, if the 5- detector/photon noise limit was set to 65Jy, then the indicated 5- level of confusion noise was 76Jy, significantly poorer than from the simulation of very long integrations. This effect probably results from the increased uncertainty in source centroiding and the resulting lower accuracy in extracting accurate source measurements from a confused field. To test this hypothesis further, we simulated extraction of a 36Jy source in the high signal-to-noise integration case, and found that the indicated 5- confusion limit rose to 64Jy, confirming the effect.
2.2. Confusion by Extragalactic Sources at 70 m
At 70 m, we again use the number counts Dole et al. (2004) as the basic input to determining the confusion level. The updated model of Lagache et al. (2004) was used to extrapolate the counts and to derive updated confusion limits. The use of a model is critical in this case because the contribution of unresolved sources is not negligible. We derive a confusion level at 70 m of 3.2 mJy using the SDC (Table 1). The differential source counts are almost flat (when divided by the Euclidean component), and the contribution from unresolved sources is much smaller than that of the resolved sources. These results demonstrate that the SDC estimate is the appropriate one, that is, the confusion is dominated by faint resolved sources rather than the unresolved background due to even fainter objects. Further details are given in Table 1. From the instrument radiometric model, we estimate that about 1800 seconds of integration would be required to reach this limit.
Again, we sought to check these results by a pure fluctuation analysis on the data without referring to galaxy population models. We used the data described by Dole et al. (2004) for the Chandra Deep Field South. We determined the evolution of , the standard deviation of a Gaussian fitted to the surface brightness distribution as a check of the results from extrapolating number counts downward. Data were combined into 6 mosaics corresponding to 100s to 600s integration time per sky pixel with 100s steps. Figure 1a shows the evolution of with time. We do not observe substantial flattening in the time evolution. We conclude that MIPS 70 m surveys do not reach yet the confusion limit after 600s of integration. An estimate of the confusion level is given by fitting the time evolution of . We find that the detector/photon noise will be roughly equal to the confusion noise at 800 seconds of integration, with large uncertainties because the fluctuation curve is still dropping almost as the square root of the integration time at the longest integration available. As at 24m, this result is in satisfactory agreement with the integration time predicted by the SDC modeling.
2.3. Confusion by Extragalactic Sources at 160 m
The data used at 160 m are also described by Dole et al. (2004). The Lagache et al. (2004) model predicts a confusion level of 40 mJy (Table 1). From the instrument radiometric model, we estimate that about 70 seconds of integration would be required to reduce the instrument and photon noise to the level of the confusion noise.
A similar fluctuation analysis as at 70 m was conducted at 160 m, where 6 mosaics corresponding to integration times of 20 to 120s (with 20s steps) were studied. Analyzing the fluctuations is more difficult in this case since bright sources in the Euclidean regime contaminate the statistics, and since the map S/N is not uniform. Nevertheless, we estimate from Figure 1b that the confusion and detector/photon noise should be equal at about 95 seconds of integration, in good agreement with the result from the SDC analysis.
2.4. Confusion by Galactic Cirrus
Another sensitivity limitation arises due to the structure of the IR cirrus. To estimate how this cirrus emission may affect the source detectability, we compared the 80% completeness limit in sky regions characterized by different cirrus background levels, using simulations as described in Papovich et al. (2004). We used a dedicated engineering observation in Draco of a bright cirrus, of HI column density varying between and . At 24m, we find a relatively weak effect, and derive a completeness degradation of 15% (Jy increase from Jy) between the dark and the bright parts of the cirrus field. The effects of cirrus are more conspicuous at 70m. We reach a 80% completeness in Draco of 17mJy and 27mJy. In a low-cirrus field (e.g., Marano) and for a similar integration time (100s), this level drops at 12mJy. We compared the estimates in Draco with those provided by the Performance Estimation Tool of the Spitzer Science Center and found that the measured value variations as a function of the cirrus strength are in general agreement (within 30%) with those estimated by the tool from low to medium background. This comparison will be refined as we continue to acquire far-infrared data.
3. Implications for Future Observatories
A number of cryogenically-cooled space telescopes have been proposed for the MIR, the FIR and the submillimeter spectral ranges. Table 2 summarizes the main characteristics of some of these observatories. Herschel Pilbratt (2001), JWST Gardner (2003), SPICA Matsumoto (2003) and SAFIR Yorke et al. (2002), have at least one photometric channel in common with MIPS. As examples, we focus on Herschel-PACS at 75 and 170 m, on JWST-MIRI at 24 m, and on SPICA and SAFIR at 24, 70 and 160 m, assuming in each case that the MIPS filters will be used.
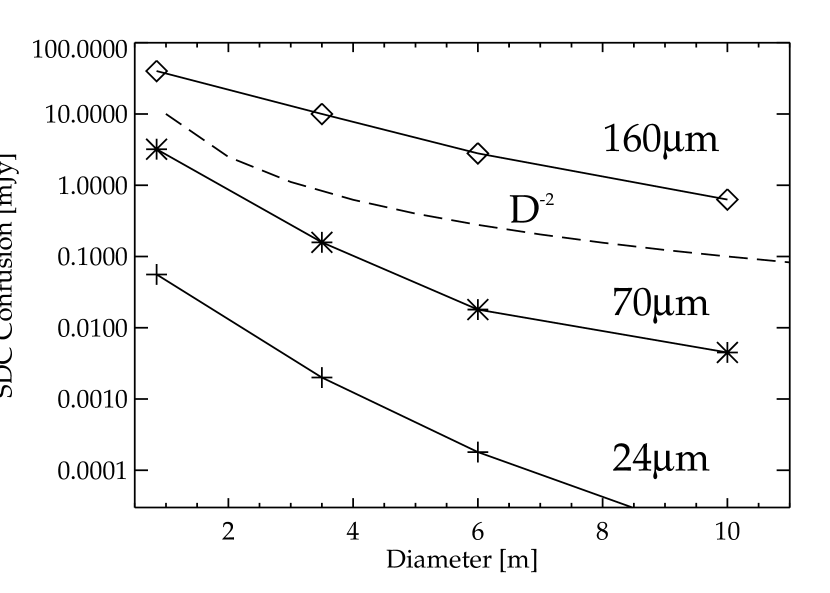
For each of these observatories, we compute predictions for the confusion level for unbiased surveys using the Lagache et al. (2004) model of source counts. We assume a Gaussian beam profile for these future observatories, with a FWHM of , being the wavelength and the diameter of the primary telescope mirror, given in Table 2. The underlying assumption for the deepest surveys to be made by these planned facilities, is that they will be confusion-limited. This means we did not take into account other sources of noise, for instance photon noise due to insufficient integration times, or thermal background due to the warm telescope – by design, Herschel and JWST might be in the latter case. Normally background limited photon noise observations would give a sensitivity limit scaling as aperture squared for a diffraction limited system. Figure 2 shows that confusion noise at 24 and 70 m drops much faster than as aperture squared (dash) because source counts are shallower below fluxes where most of the CIB has been resolved into sources. That is why the next generation of large far infrared telescopes will be much less confusion limited than Spitzer.
In Table 3, we use the confusion level given by the SDC, and compute the fraction of the CIB potentially resolved into sources. In the MIR, a significant step will be made with the 4m-class space telescope: as an example, SPICA would potentially resolve 98% of the CIB at 24 m. All (%) of the CIB would be resolved with JWST or SAFIR (although doing so with JWST would require extremely long integrations). In the FIR, Herschel would resolve a significant fraction of the CIB at 70 and 160 m (resp. 93 and 58%, again with extremely long integrations). SAFIR will ultimately nearly resolve all of it (%).
| Herschela | JWSTb | SAFIR | |
|---|---|---|---|
| SPICA | |||
| Diameter (m) | 3.5 | 6.0 | 10.0 |
| 24 SDCc [Jy] | 2 | 0.18 | 0.01f |
| 70 SDCc [mJy] | 0.16 | – | 0.004 |
| 160 SDCd [mJy] | 10 | – | 0.6 |
Note. — (a) With PACS. (b) With MIRI. (c) cf notes a and b in Table 1. (d) outside the range of the current model flux grid.
| 24 ma | 70 ma | 160 ma | |
|---|---|---|---|
| Spitzer | 74% | 59% | 18% |
| Herschelb/SPICA | 98% | 93% | 58% |
| JWSTb | 99% | – | – |
| SAFIR | 100% | 99% | 94% |
Note. — (a) Using the CIB value from Lagache et al. (2004) and using the limiting flux using the SDC limit and assuming confusion-limited surveys. (b) This hypothesis might not be valid for Herschel and JWST.
4. Conclusions
Using MIPS Spitzer data at 24, 70 and 160 m, the source density measured by Papovich et al. (2004) and Dole et al. (2004) together with the modeling of Lagache et al. (2004) has allowed us to derive the confusion limits for Spitzer in the mid to far infrared. We tested the model results with a Monte Carlo simulation at 24m and with a fluctuations analysis at all 3 wavelengths. The agreement is uniformly very good.
At 24 and 70 m, confusion is mostly due to the high density of resolved sources, and at 160 m, confusion is mainly due to faint unresolved sources. Studying the FIR fluctuations at this wavelength is thus a tool to constrain the nature of the faint galaxies, beyond the confusion limit.
We also derive confusion limits for future space IR observatories. We show that future large-aperture missions will gain in confusion-limited sensitivity substantially faster than as aperture squared for wavelengths 100m, allowing them to reach very deep detection limits. For example, the CIB should be fully resolved into sources in the MIR and FIR with SAFIR observations.
References
- Condon (1974) Condon, J. J. 1974, ApJ, 188:279.
- Dole et al. (2003) Dole, H, Lagache, G, & Puget, J. L. 2003, ApJ, 585:617.
- Dole et al. (2004) Dole, H, Le Floc’h, E, Pérez-González, P. G., et al. 2004, ApJS, this volume.
- Franceschini et al. (1989) Franceschini, A, Toffolatti, L, Danese, L, & De Zotti, G. 1989, ApJ, 344:35.
- Gardner (2003) Gardner, J. P. 2003, IAU, Joint Discussion 8, page 10
- Helou & Beichman (1990) Helou, G, & Beichman, C. A. 1990, ESA SP-314, p117
- Lagache et al. (2004) Lagache, G, Dole, H, & Puget, J. L., et al. 2004, ApJS, this volume.
- Lonsdale et al. (2003) Lonsdale, C. J, Smith, H. E, Rowan-Robinson, M, et al. 2003, PASP, 115:L897.
- Matsumoto (2003) Matsumoto, T. 2003, SPIE, 4850:1091
- Papovich et al. (2004) Papovich, C, Dole, H, Egami, E, et al. 2004, ApJS, this volume.
- Pilbratt (2001) Pilbratt, G. L. 2001, ESA-SP 460:13
- Rieke et al. (1995) Rieke, G. H, Young, E. T, & Gautier, T. N. 1995, Space Sci. Rev., 74:17.
- Rieke et al. (2004) Rieke, G. H, Young, E. T, Engelbracht, C, et al. 2004, ApJS, this volume.
- Takeuchi & Ishii (2004) Takeuchi, T. T & Ishii, T. T. 2004, ApJ, 604:40.
- Xu et al. (2001) Xu, C. K, Lonsdale, C. J, Shupe, D. L, O’Linger, J., & Masci, F. 2001, ApJ, 562:179.
- Yorke et al. (2002) Yorke, H. W, Bock, J. J, Dragovan, M. W et al. 2002, AAS, 2011:5104.