Far Infrared Source Counts at 70 and 160m in Spitzer Deep Surveys
Abstract
We derive galaxy source counts at 70 and 160 m using the Multiband Imaging Photometer for Spitzer (MIPS) to map the Chandra Deep Field South (CDFS) and other fields. At 70 m, our observations extend upward about 2 orders of magnitude in flux density from a threshold of 15 mJy, and at 160 m they extend about an order of magnitude upward from 50 mJy. The counts are consistent with previous observations on the bright end. Significant evolution is detected at the faint end of the counts in both bands, by factors of 2-3 over no-evolution models. This evolution agrees well with models that indicate most of the faint galaxies lie at redshifts between 0.7 and 0.9. The new Spitzer data already resolve about 23% of the cosmic far-infrared background at 70 m and about 7% at 160 m.
Subject headings:
infrared: galaxies – galaxies: evolution – galaxies: statistics1. Introduction
The cosmic infrared background (CIB), relic emission of the formation and evolution of the galaxies, peaks in the far-infrared (FIR) in the 60-200 m wavelength range Puget et al. (1996); Hauser et al. (1998); Lagache et al. (1999); Gispert et al. (2000); Hauser & Dwek (2001). In the local universe only about a third of the extragalactic emission is released in the FIR Soifer & Neugebauer (1991). However, the CIB FIR peak accounts for more than half of the total optical/infrared background, indicating strong evolution of galaxy properties toward high FIR output in the past. Characterizing the galaxies responsible for most of the CIB is therefore an important goal of cosmological surveys. Galaxy counts (or number counts) provide a powerful tool to investigate the evolution of the galaxies and their contribution to the CIB.
The cryogenic infrared space missions IRAS (Infrared Astronomical Satellite) and ISO (Infrared Space Observatory) (Genzel & Cesarsky, 2000; Dole, 2003, for reviews) provided important data on source counts at 60 m Hacking & Soifer (1991) and at 100 m Rowan-Robinson et al. (1986) , and more recently at 90 m Kawara et al. (1998); Efstathiou et al. (2000); Juvela et al. (2000); Linden-Vornle et al. (2000); Matsuhara et al. (2000); Rodighiero et al. (2003); Kawara et al. (2004) and 170 m Kawara et al. (1998); Puget et al. (1999); Matsuhara et al. (2000); Dole et al. (2001); Kawara et al. (2004). Mid-infrared (MIR) observation with ISOCAM at 15m Elbaz et al. (1999) are also of great interest since they are believed to resolve a significant fraction of the CIB into sources Elbaz et al. (2002). The Spitzer Space Telescope Werner et al. (2004) provides the ability for much deeper and wider-area surveys from 3.6 to 160 m. This paper investigates source counts at 70 and 160 m from Spitzer. A companion paper addresses the MIR source counts at 24 m Papovich et al. (2004). The three-band source counts are the basis of new phenomenological models by Lagache et al. (2004).
2. Observations and Data Reduction
Observations were carried out with the Multiband Imaging Photometer for Spitzer Rieke et al. (2004) in the Chandra Deep Field South (CDFS) and the Boötes field corresponding to the NOAO Deep Wide Field Survey NDWFS Jannuzi & Dey (1999); We also used an engineering MIPS observation of the Marano field. The observational mode (scan map) provides multiple sightings of each source, typically 10 and 60 at 70m in the Boötes and CDFS, respectively. However, at 160 m, the number of sightings is only typically 2 in Boötes and 12 in CDFS. See Table 1 and Papovich et al. (2004) for details.
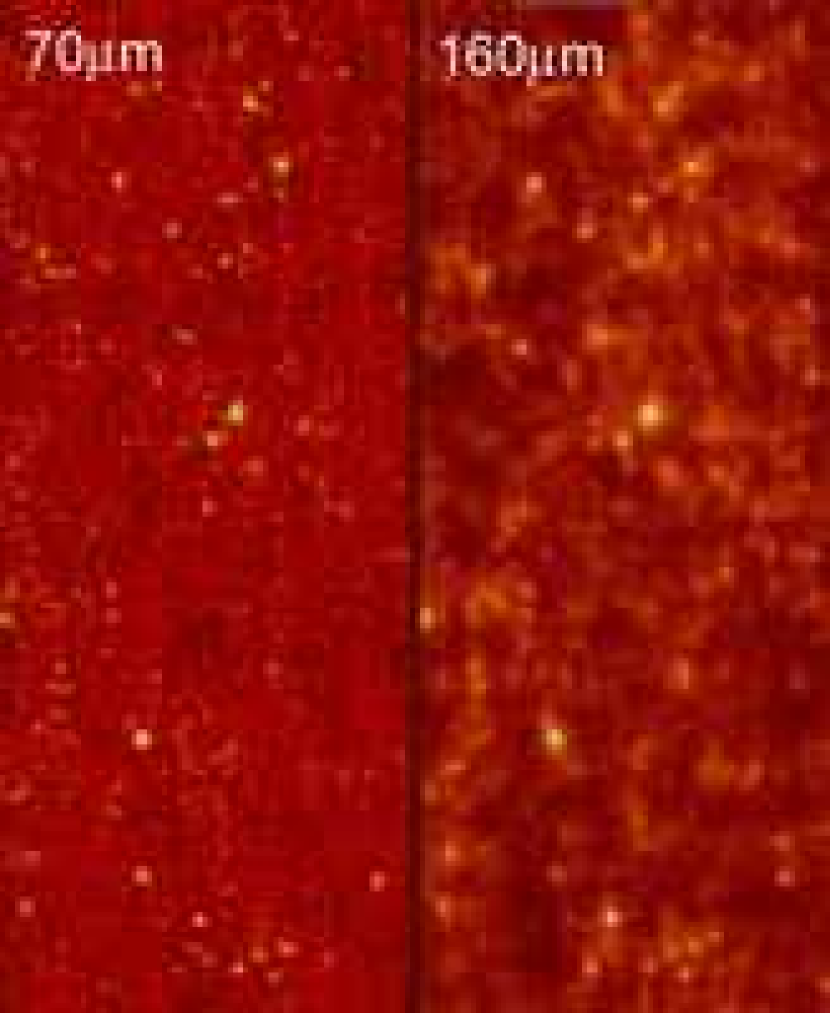
The data were reduced with the Data Analysis Tool Gordon et al. (2004), from the raw data (ramps) to the final coadded mosaics. The illumination corrections were derived from the data themselves. At 70 m, the data have been median-filtered in the time domain before mosaicking. Note that data from Ge:Ga detectors are always challenging to process; but with MIPS, most of the difficulties are overcome with frequent calibrations (stimulator flashes), that track the responsivity variations. Nevertheless, the noise properties at faint fluxes are still being investigated at both 70 and 160 . In this work, we will adopt conservative detection limits. A future paper will address extracting the ultimate sensitivity from these data. Sample images in the CDFS are shown in Figure 1.
| Field | MIPS | 70 m | 160 m | ||||
|---|---|---|---|---|---|---|---|
| Name | AOTbb scan map mode | Area | tintcc per sky pixel | Scutdd flux density at which catalog was cut | Area | tintcc per sky pixel | Scutdd flux density at which catalog was cut |
| aa see Papovich et al. (2004) for details on fields | [s] | [mJy] | [s] | [mJy] | |||
| Boötes | med. | 8.75 | 40 | 80 | 7.70 | 8 | ee field data not used at 160 m |
| Marano | slow | 0.42 | 100 | 25 | 0.31 | 20 | 50 |
| CDFS | slow | 0.67 | 600 | 15 | 0.54 | 120 | 50 |
3. Photometry & Catalogs
To control the sample and the selection function, we accepted source detections only where the redundancy was high (typically 80% or more of the mean weight), avoiding the edges and the noisiest areas of the images. The resulting positions were fed to DAOPHOT Stetson (1987) in IRAF111IRAF is distributed by the National Optical Astronomy Observatories, which are operated by the Association of Universities for Research in Astronomy, Inc., under the cooperative agreement with the National Science Foundation for PSF fitting. We checked that the residual maps were indeed free of sources.
At 70 m the photometric calibration is derived from many observation campaigns, and its uncertainty is conservatively estimated at the order of 20%. We use only detections at 15 mJy and brighter in the CDFS, 25 mJy and brighter in Marano, and 80 mJy and brighter in the Boötes field. These flux levels are determined using the sharp decrease in the counts due to the incompleteness effect. At 160 m, the calibration is based on a combination of observations of standard stars, asteroids, and comparisons with measurements with other FIR missions (ISO, COBE, and modeling including IRAS measurements). It is also estimated to be accurate to about 20%. We have included in our counts only objects of 50mJy and brighter in the CDFS, and Marano (levels determined using incompleteness as at 70 m). Because of the low redundancy level of the 160 m data in the Boötes field, we postpone using it for a later paper.
Catalogs were produced separately at each wavelength; surveys at each wavelength are thus unbiased. Detected FIR sources in the CDFS sort as follows. For sources selected at 70 m: 92% have a 24 m ID; 54% have a 160 m ID (same with 24 and 160). For sources selected at 160 m: 98% have a 24 m ID; 43% have a 70 m ID (same with 24 and 70).
4. Source counts
At 70 m, 131 sources were detected down to 15 mJy in the CDFS, 55 sources down to 25 mJy in Marano, and 117 down to 80 mJy in the Boötes. At 160 m, down to 50 mJy, 123 sources were detected in the CDFS, and 89 sources in Marano. The source density corresponds to about 150 beams per source at 70 m and 15 at 160 m, using the definition of Helou & Beichman (1990).
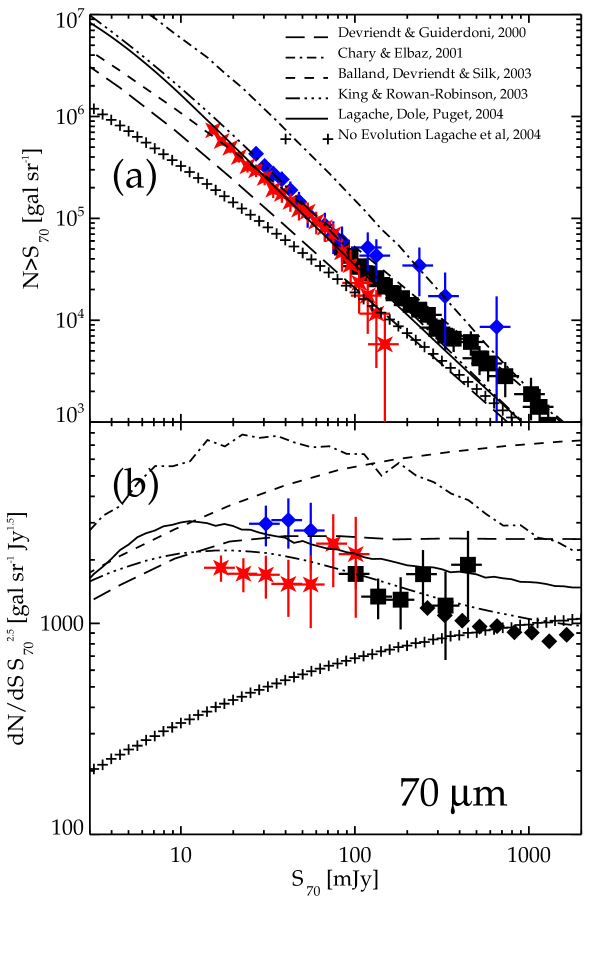
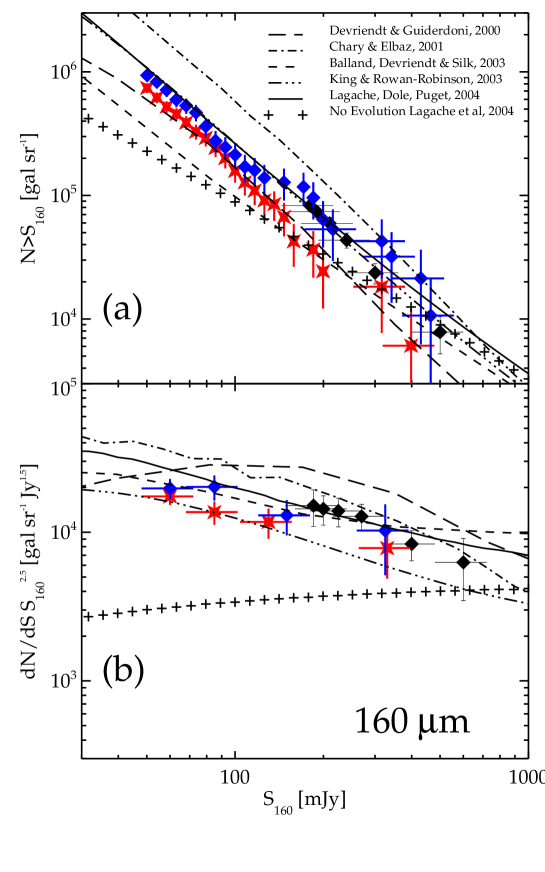
Source counts are given in integral form (Figure 2a and 3a) and differential form, divided by the Euclidean component (Figure 2b and 3b) at 70 and 160 m, respectively. Notice that we did not correct for incompleteness. Error bars on counts are Poisson uncertainty. Bins with less than four sources have not been displayed for clarity, since their significance is low, with uncertainties of 50% or higher. Also, photometric uncertainty have been displayed at high flux only. In order to visualize the contribution from each field, source counts have not been merged and have been overplotted. One should keep in mind that MIPS source counts will eventually go deeper and will be corrected for incompleteness.
The observed fields nicely complement each other in terms of area and depth. This allows us to probe a flux range of almost 2 orders of magnitude at 70 m. One order of magnitude is covered at 160 m. It is possible to check consistency and the cosmic variance in the common flux density range. At 70 m, in the range 25 to 100 mJy where three fields overlap in flux density, the differential counts are almost consistent within the error bars. At 160 m, in the range 100 to 300 mJy, the differential counts are consistent within the error bars. At both wavelengths, number counts in CDFS appear consistently lower than in Marano.
5. Discussion
5.1. 70 m
The MIPS 70 m counts show a great consistency with the IRAS 60 m counts of Lonsdale et al. (1990) converted at 70 m using .
A selection of recent models is shown in Figure 2, including a non-evolution scenario. The most striking result is the strong excess of MIPS 70 m sources compared to the non-evolution model: a factor of 3 at around 20-30 mJy. Strong evolution had been reported previously at 60 and 90 m, and these data provide unambiguous confirmation.
Two models lie close to the data: King & Rowan-Robinson (2003) and Lagache et al. (2003, 2004). These models, developed to fit observables mostly from IRAS, ISO and SCUBA surveys as well as the CIB spectral energy distribution (SED), are based on a strong evolution of luminous (and ultra-luminous) infrared galaxies (LIRG and ULIRG). The latter model predicts a peak in the redshift distributions of resolved sources at 70 m near Dole et al. (2003). Figure 4a shows the galaxy contribution to the differential counts, as a function of redshift, from the Lagache et al. (2004) model. Between 5 and 100 mJy, sources at contribute the most to the counts. At brighter fluxes (reached by IRAS and ISO), contributions from local galaxies are more important.
The source counts integrated at 70 m correspond to a brightness of 0.022 MJy/sr or 0.95 nW/m2/sr. The value of the CIB at this wavelength is not known accurately owing to contamination by zodiacal light. If we use the CIB value from the model of Lagache et al. (2004), the MIPS counts show that at 70 m about 23% of the 70 m CIB is already resolved.
5.2. 160 m
At 160 m, the comparison with the ISO FIRBACK 170 m survey Dole et al. (2001) shows that the counts are consistent and within the error bars in the whole common range, 180-300 mJy. Other ISO observations Matsuhara et al. (2000); Kawara et al. (2004) agree as well.
Figure 3 overplots the same models as at 70 m. The evolution detected at 170 m is confirmed at 160 m, down to fainter levels. At about 100 mJy, an excess of sources by more than a factor of 2 is observed compared to a non-evolution scenario. Interestingly, as for 70 m, the observed evolution is better fitted by the models of Lagache et al. (2004) and King & Rowan-Robinson (2003). The observed slope also agrees with Mould (2003).
We have constrained the bright end of galaxy number counts at 170 m by using data from the ISOPHOT Serendipity Survey (ISOSS). ISOSS provides a total sky coverage of 15% and is virtually complete at a flux density level of . Based on all optically identified galaxies detected by ISOSS Krause (2003); Stickel et al. (2004) we have derived an integral number density of gal.sr-1 galaxies at high Galactic latitudes. This point is perfectly matched by the model of Lagache et al. (2003, 2004).
The most striking result of the models that fit the number counts is the existence of two regimes in flux density. In the ISO range (fluxes above 200 mJy) most of the sources contributing to the counts are local; this is confirmed by observation Patris et al. (2003). At fainter fluxes, between 10 and 200 mJy, the counts should be dominated by a population located at redshifts between 0.7 and 0.9.
The source counts integrated at 160 m correspond to a brightness of 0.07 MJy/sr or 1.4 nW/m2/sr. The CIB value at this wavelength is 1 MJy/sr Lagache et al. (2000); the MIPS counts show that at 160 m about 7% of the CIB is resolved. Since these counts are preliminary, are not corrected for incompleteness, and are subject to cosmic variance, we anticipate that the actual value might be higher.
5.3. Concluding Remarks
The first MIPS far-infrared source counts, spanning about 2 orders of magnitude in flux density at 70 m (and one at 160 m), are consistent on the bright end with previous observations, and show on the faint end unambiguous evolution. Models predict that most of the sources lie at with a tail up to Dole et al. (2003); Lagache et al. (2003, 2004). This work and companion papers about source counts at 24 m Papovich et al. (2004), about confusion at 24, 70 and 160 m Dole et al. (2004), and about the interpretation of these new data from the Spitzer cosmological surveys Lagache et al. (2004), bring new light on the statistical properties of galaxies in an unexplored regime in flux density, and likely in a critical region of redshift space (up to redshifts ) in the FIR Egami et al. (2004); Le Floc’h et al. (2004).
References
- Balland et al. (2003) Balland, C, Devriendt, J. E. G, & Silk, J. 2003, MNRAS, 343:107.
- Chary & Elbaz (2001) Chary, R & Elbaz, D. 2001, ApJ, 556:562.
- Devriendt & Guiderdoni (2000) Devriendt, J. E. G & Guiderdoni, B. 2000, A&A, 363:851.
- Dole et al. (2001) Dole, H, Gispert, R, Lagache, et al. 2001, A&A, 372:364.
- Dole et al. (2003) Dole, H, Lagache, G, & Puget, J. L. 2003, ApJ, 585:617.
- Dole et al. (2004) Dole, H, Rieke, G. H, Lagache, G, et al. 2004, ApJS, this volume.
- Dole (2003) Dole, H. ESA SP-511, 2003.
- Efstathiou et al. (2000) Efstathiou, A, Oliver, S, Rowan-Robinson, et al. 2000, MNRAS, 319:1169.
- Egami et al. (2004) Egami, E. et al. 2004, ApJS, this volume.
- Elbaz et al. (1999) Elbaz, D, Cesarsky, C. J, Fadda, D, et al. 1999, A&A, 351:L37.
- Elbaz et al. (2002) Elbaz, D, Cesarsky, C. J, Chanial, P, et al. Fadda, D, & Chary, R. R. 2002, A&A, 384:848.
- Genzel & Cesarsky (2000) Genzel, R & Cesarsky, C. J. 2000, ARA&A, 38:761.
- Gispert et al. (2000) Gispert, R, Lagache, G, & Puget, J. L. 2000, A&A, 360:1.
- Gordon et al. (2004) Gordon, K. D, Rieke, G. H, Engelbracht, C. E, et al. 2004, PASP, submitted.
- Hacking & Soifer (1991) Hacking, P. B & Soifer, B. T. 1991, ApJ, 367:L49.
- Hauser & Dwek (2001) Hauser, M. G & Dwek, E. 2001, ARA&A, 37:249.
- Hauser et al. (1998) Hauser, M. G, Arendt, R. G, Kelsall, T, et al. 1998, ApJ, 508:25.
- Helou & Beichman (1990) Helou, G. & Beichman, C. A. ESA SP-314, 1990, 117
- Jannuzi & Dey (1999) Jannuzi, B. T & Dey, A. In Weymann, R, etl. R, editors, ASP Conference Series v191, 1999, p111.
- Juvela et al. (2000) Juvela, M, Mattila, K, & Lemke, D. 2000, A&A, 360:813.
- Kawara et al. (1998) Kawara, K, Sato, Y, Matsuhara, H, et al. 1998, A&A, 336:L9.
- Kawara et al. (2004) Kawara, K, Matsuhara, H, Okuda, H, et al. 2004, A&A, 413:843.
- King & Rowan-Robinson (2003) King, A. J & Rowan-Robinson, M. 2003, MNRAS, 339:260.
- Krause (2003) Krause, O. 2003, PhD thesis
- Lagache et al. (1999) Lagache, G, Abergel, A, Boulanger, F, et al. 1999, A&A, 344:322.
- Lagache et al. (2000) Lagache, G, Haffner, L. M, Reynolds, R. J, & Tufte, S. L. 2000, A&A, 354:247.
- Lagache et al. (2003) Lagache, G, Dole, H, & Puget, J. L. 2003, MNRAS, 338:L555.
- Lagache et al. (2004) Lagache, G, Dole, H, & Puget, J. L. et al. 2004, ApJS, this volume.
- Le Floc’h et al. (2004) Le Floc’h, E. et al. 2004, ApJS, this volume.
- Linden-Vornle et al. (2000) Linden-Vornle, M. J. D, Norgaard-Nielsen, H. U, Jorgensen, H. E, et al. 2000, A&A, 359:L51.
- Lonsdale et al. (1990) Lonsdale, C. J, Hacking, P. B, Conrow, T. P, & Rowan-Robinson, M. 1990, ApJ, 358:L60.
- Lonsdale et al. (2003) Lonsdale, C. J, Smith, H. E, Rowan-Robinson, et al. 2003, PASP, 115:L897.
- Matsuhara et al. (2000) Matsuhara H.,Kawara K., Sato Y. et al. 2000, A&A 361, 407
- Mould (2003) Mould, J. 2003, ApJ, 587:L93.
- Papovich et al. (2004) Papovich, C, Dole, H, Egami, E, et al. 2004, ApJS, this volume.
- Patris et al. (2003) Patris, J, Dennefeld, M, Lagache, G, & Dole, H. 2003, A&A, 412:349.
- Puget et al. (1996) Puget, J. L, Abergel, A, Bernard, J. P, et al. 1996, A&A, 308:L5.
- Puget et al. (1999) Puget, J. L, Lagache, G, Clements, D. L, et al. 1999, A&A, 345:29.
- Rieke et al. (2004) Rieke, G. H, Young, E. T, Engelbracht, C, et al. 2004, ApJS, this volume.
- Rodighiero et al. (2003) Rodighiero, G, Lari, C, Franceschini, A, et al. 2003, MNRAS, 343:1155.
- Rowan-Robinson et al. (1986) Rowan-Robinson, M, Walker, D, Chester, T, et al. J. 1986, MNRAS, 219:273.
- Soifer & Neugebauer (1991) Soifer, B. T & Neugebauer, G. 1991, AJ, 101:354.
- Stetson (1987) Stetson, P. B. 1987, PASP, 99:191.
- Stickel et al. (2004) Stickel, M. et al. 2004, A&A, submitted, A&A
- Werner et al. (2004) Werner, M. et al. 2004, ApJS, this volume.