SMA multi-line observations of the massive star-forming region IRAS 18089-1732
Abstract
Submillimeter Array (SMA) observations of the high-mass star-forming region IRAS 18089-1732 in the 1 mm and 850 m band with 1 GHz bandwidth reveal a wealth of information. We present the observations of 34 lines from 16 different molecular species. Most molecular line maps show significant contributions from the outflow, and only few molecules are confined to the inner core. We present and discuss the molecular line observations and outline the unique capabilities of the SMA for future imaging line surveys at high spatial resolution.
1 Introduction
(Sub-)millimeter Interferometry offers great opportunities to study massive star-forming regions in detail. High-mass star formation proceeds in a clustered mode, and at the typical distances of a few kpc high angular resolution is necessary to resolve the different phenomena taking place. Furthermore, massive star-forming cores emit strongly in the (sub-)mm regime and exhibit a forest of molecular line transitions tracing various physical aspects (e.g., Schilke et al. 1997). Here, we present early results obtained in the field of massive star formation with the Submillimeter Array (SMA111The Submillimeter Array is a joint project between the Smithsonian Astrophysical Observatory and the Academia Sinica Institute of Astronomy and Astrophysics, and is funded by the Smithsonian Institution and the Academia Sinica.) on Mauna Kea/Hawaii. Before the advent of the SMA, the only sub-mm interferometry ever conducted was single-baseline work with the JCMT and CSO, which aimed largely at low-mass sources because the expected structures would be simple (e.g., Brown et al. 2000).
The target source IRAS 18089-1732 is part of a sample of 69 High-Mass Protostellar Objects selected mainly via infrared color-color criteria and the absence of strong cm continuum emission (Sridharan et al., 2002). It is approximately at a distance of 3.6 kpc222The kinematic distance ambiguity is solved by associating the region via the near- and mid-infrared surveys 2MASS and MSX on larger scales with sources of known distance (Bontemps, priv. comm.). and its bolometric luminosity is about L⊙ (Sridharan et al., 2002). Previous Millimeter continuum observations reveal a massive core M⊙ with H2O and CH3OH maser emission, and a weak 1 mJy cm source is detected (Beuther et al., 2002b, d). As part of a single-dish CO outflow study, wing emission indicative of molecular outflows was detected (Beuther et al., 2002c), and Sridharan et al. (2002) report the detection of the hot-core molecules CH3CN and CH3OH. Comprising all features of a young luminous massive star-forming region at an early evolutionary stage just beginning to form a hot core, IRAS 18089-1732 is an ideal target for early science with the SMA. While this letter focuses on the multi-line observations of IRAS 18089-1732, an accompanying letter discusses the (sub-)mm continuum and SiO/HCOOCH3 line data revealing the disk-jet system (Beuther et al., this volume).
2 The Submillimeter Array (SMA)
IRAS 18089-1732 was observed with the SMA between May and July 2003 in two different configurations with 3 to 5 antennas in the array333For more details on the SMA and its specifications see Ho, Moran & Lo (this volume) and the SMA web-site: http://sma-www.harvard.edu/.. The phase reference center of the observations was R.A.[J2000] 18:11:51.4 and Dec.[J2000] :31:28.5. The projected baselines ranged from 10.8/18.6 to 120 m for the 1.3 mm/850 m observations, respectively. For bandpass calibration we used the planet Mars. The flux density scale was derived by observations of the planet Uranus and is estimated to be accurate within 25 . Phase and amplitude calibration was done via frequent observations of the quasar NRAO530, approximately from the target source ( Jy and Jy). The zenith opacity for the 350 GHz observations – measured at 225 GHz with the NRAO tipping radiometer operated by the CSO () – was excellent for one track ((354 GHz)) but somewhat worse for the second track ((354 GHz)). The data of the second track could only be used for the 850 m continuum because the signal-to-noise ratio in the line data was too low. For the 217 GHz observations the opacity was slightly higher with (225 GHz) in one night and (225 GHz) in the other night. The doppler-tracking center frequency on the source was km s-1. The receivers operate in a double-sideband mode (DSB) with an IF band of 4–6 GHz. The correlator bandwidth at the time of observation was 1 GHz, and the frequency resolution was 0.825 MHz. In the 850 m band we tuned the receivers to the HCN(4–3) line at 354.5055 GHz in the upper sideband. At 1 mm the tuning was centered on the SiO(5–4) line at 217.1049 GHz in the lower sideband. Because of double-sideband reception we obtained simultaneously data at 344 GHz and 227 GHz. The beam sizes of the combined datasets at 1.3 mm was and at 850 m (uniform weighting), the beam size of the 850 m line data using only one track was . System temperatures (DSB) in the 850 m band were between 300-900 K and in the 1 mm band around 200 K. The primary beam at 217 GHz was and at 354 GHz . The continuum rms was mJy at 217 GHz and mJy at 345 GHz. The calibration was done with the IDL superset MIR developed originally for OVRO and adapted for the SMA. The imaging was performed in MIRIAD.
3 Results
Detection of many molecular lines: Figure 1 presents two spectra taken at 217 GHz and 344 GHz (both on baselines of m), showing an impressive line forest of various molecular lines. In the whole dataset with a total bandwidth of 4 GHz (1 GHz in a DSB mode per frequency setup) we detect 34 molecular lines from 16 molecules/isotopomers, with 5 lines remaining unidentified (Table 1). We detected lines from molecular species tracing various physical and chemical processes within massive star-forming regions. While silicon and sulphur bearing molecules are known to be strong in shocked regions and thus often trace molecular outflows, we also detected typical hot core molecules like CH3OCH3, CH3OH, and numerous HCOOCH3 lines. The data are rich in nitrogen bearing species as HCN, HC3N, and HC15N, which are subject to a different chemistry than, e.g., oxygen bearing species (e.g., Wyrowski et al. 1999). Furthermore, we observed the deuterated species DCN which again is subject to different chemical networks (e.g., Hatchell et al. 1998). It should be noted that the setup was chosen originally for SiO(5–4) and HCN(4–3), the other line detections were achieved because of the broad bandwidth. Transitions of other typical molecules like CH3CN or CN were absent in this specific setup. The data suggest that because of the richness of lines in the (sub-)millimeter window, the SMA will almost always be able to sample many transitions simultaneously. Figure 1 also shows the different continuum levels at 1 mm and 850 m of which a detailed analysis is presented in the accompanying letter (Beuther et al., this volume). We estimate the line contamination to the broadband continuum flux in the 1.3 mm band and the 850 m band both to be about 10%.
Comparing the line forest with Orion-KL, the proto-typical high-mass star-forming region toward which many line surveys have been conducted (e.g., Sutton et al. 1985; Schilke et al. 1997), we detect in the same frequency ranges all lines previously observed toward Orion-KL, but with on average significantly narrower line width toward IRAS 18089-1732: e.g., toward Orion-KL in the 344 GHz band the HC15N and CH3OCH3 blend into the broad line wings of the SO line (Schilke et al., 1997) whereas they are clearly resolved from each other in the IRAS 18089-1732 data (Fig. 1). The two main reasons likely contributing to this difference are the larger luminosity of Orion (105 L⊙ compared to 104.5 L⊙) and the earlier evolutionary stage of IRAS 18089-1732 which is just at the verge of forming a hypercompact Hii region (Sridharan et al., 2002).
The large number of observed HCOOCH3 lines allows us to estimate a temperature for the central region (Oesterling et al., 1999). As the data quality is not good enough to image all lines properly, especially in the 850 m band (see §3), we fitted the intensities in the visibility domain. From a boltzmann plot we derive a rotation temperature of K. As HCOOCH3 traces the dense gas at the core center, this rather high temperature indicates the existence of a hot molecular core in the near vicinity of the central hypercompact Hii region (Beuther et al., 2002d). Such high temperatures at the core center are further supported by recent VLA detections of the NH3(6,6) line with an energy level of 412 K.
Simultaneous imaging: Many of the presented molecular lines are strong enough to image, which is an enormous step forward compared to single-dish line surveys. Single-dish observations rarely have sufficient angular resolution to resolve the sources, although massive star-forming regions are usually so complex that the chemistry, density and temperatures exhibit detailed spatial structures. Simultaneous interferometric imaging of various molecular lines is thus the best tool to investigate these characteristics in more detail (e.g., Wilner et al. 1994; Wright et al. 1996; Blake et al. 1996; Wyrowski et al. 1999).
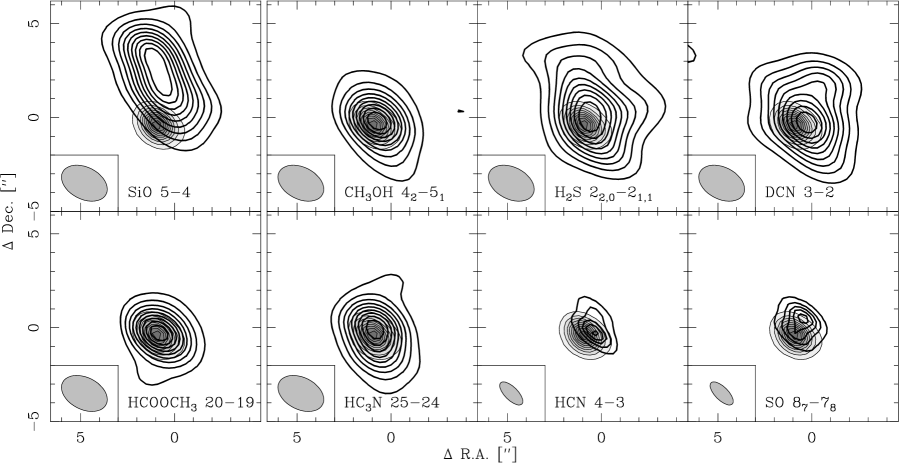
Because we have only one track at 850 m with good enough signal-to-noise ratio to use for the line imaging, we are restricted in this band to the two strongest lines: HCN and SO (Figure 2). In the 1 mm band we could image many more lines. Figure 2 presents a characteristic subset of the integrated emission maps, consisting of the outflow tracer SiO, the hot-core tracer HCOOCH3, the molecule CH3OH, the sulphur bearing molecule H2S, the deuterated molecule DCN and the nitrogen bearing molecule HC3N. Table 1 presents the peak and integrated fluxes & . Individual characteristics of the different species are discussed below. In the accompanying paper (Beuther et al., this volume), we discuss the SiO(5–4) and HCOOCH3(20–19) line observations of this dataset in detail. Here we present only the integrated SiO and HCOOCH3 emission to outline their outflow/core properties and to associate the emission of the other molecules with the different physical components within the region.
4 Discussion
As shown in Fig. 2 and outlined in Beuther et al. (this volume), the SiO(5–4) data depict an outflow emanating from the central dust core in the northern direction. This outflow is approximately in the plane of the sky and the SiO emission traces only the northern lobe. The hot core molecule HCOOCH3(20–19) traces the central dust condensation with a velocity gradient across the core at a position angle of with respect to the outflow direction. That the HCOOCH3 velocity gradient is not exactly perpendicular to the outflow can be interpreted as a rotating gas and dust disk which is influenced by the outflow as well as possible infall.
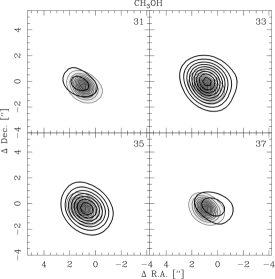
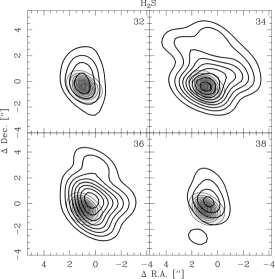
To give a flavor of the velocity structures varying with molecular line, Figure 3 shows two examples of channel maps, with CH3OH tracing the core and H2S tracing the outflow. The line-width of the two molecules is not very different because the outflow is approximately in the plane of the sky. However, the spatial distribution varies significantly. The core-tracing CH3OH shows a similar east-west velocity shift as HCOOCH3 whereas the H2S emission extends to the north comparable to SiO. As the line-widths of the various molecules are of the same order we base the following outflow/core associations mainly on morphological similarities. Comparing the molecular line data shown in Figure 2 with the results from the SiO/HCOOCH3 observations, we find that many lines are influenced by the outflow. Most prominently, this influence is observed in the sulphur bearing species H2S and SO. However, we find extensions to the north also in DCN and HCN, and, although to a lesser degree, in HC3N. CH3OH appears to be least affected by the outflow. Quantitatively speaking, we compare the source sizes within the levels of the peak emission and the ratio of integrated to peak flux presented in Table 1. Taking into account the higher angular resolution and the larger interferometric spatial filtering in the 850 m band, HCOOCH3, CH3OH and HC3N are rather compact whereas the other molecules are more extended. This is reflected in the lower integrated to peak flux ratios of the core-tracing molecules.
These findings are less of a surprise for H2S and SO, which are known to be released from dust grains in shock interactions with molecular jets and outflows (e.g., Bachiller et al. 2001). In contrast, species like HCN and HC3N were believed to be mainly hot core tracing molecules (Wyrowski et al., 1999). Especially, HCN was considered as a possible disk tracer in massive star formation, which is not the case in IRAS 18089-1732 because the outflow significantly shapes the overall HCN emission. Similarly, recent observations toward IRAS 18566+0408 and IRAS 20126+4104 reveal strong HCN emission toward its outflow (Zhang, priv. comm.). The 354 GHz HCN(4–3) data need to be improved for a more detailed investigation of HCN outflow and core emission in IRAS 18089-1732. On first sight, one gets the impression that the DCN emission might be more extended than HCN, but this is mainly due to the different frequency bands and thus varying interferometric spatial filtering. Therefore, we re-imaged the DCN data using a short baseline cutoff as given by the HCN observations ( k), and we find that the spatial distribution of HCN and its deuterated species DCN is quite similar. The compact CH3OH emission exhibits an east-west velocity gradient similar to HCOOCH3(20–19). However, CH3OH has been observed to be associated with outflows in other sources (e.g., Beuther et al. 2002a). Thus, its emission is not always unambiguously confined to core emission and has to be treated with similar caution as HCN.
The data shown in this letter outline the unique capacities of the SMA in performing imaging spectral line surveys. The presented data were taken in summer time in a testing mode with the partially completed SMA. Therefore, using the full capabilities of the SMA in the very near future (e.g., doubled bandwidth of 2 GHz, 8 antennas within the array, 2 receivers simultaneously, see also Ho et al., this volume) we will get a far better sensitivity and imaging quality for forthcoming physical and chemical studies of various astrophysical objects.
References
- Bachiller et al. (2001) Bachiller, R., Pérez Gutiérrez, M., Kumar, M. S. N., & Tafalla, M. 2001, A&A, 372, 899
- Beuther et al. (2002a) Beuther, H., Schilke, P., Gueth, F., et al. 2002a, A&A, 387, 931
- Beuther et al. (2002b) Beuther, H., Schilke, P., Menten, K. M., et al. 2002b, ApJ, 566, 945
- Beuther et al. (2002c) Beuther, H., Schilke, P., Sridharan, T. K., et al. 2002c, A&A, 383, 892
- Beuther et al. (2002d) Beuther, H., Walsh, A., Schilke, P., et al. 2002d, A&A, 390, 289
- Blake et al. (1996) Blake, G. A., Mundy, L. G., Carlstrom, J. E., et al. 1996, ApJ, 472, L49+
- Brown et al. (2000) Brown, D. W., Chandler, C. J., Carlstrom, J. E., et al. 2000, MNRAS, 319, 154
- Hatchell et al. (1998) Hatchell, J., Millar, T. J., & Rodgers, S. D. 1998, A&A, 332, 695
- Oesterling et al. (1999) Oesterling, L. C., Albert, S., de Lucia, F. C., Sastry, K. V. L. N., & Herbst, E. 1999, ApJ, 521, 255
- Schilke et al. (1997) Schilke, P., Groesbeck, T. D., Blake, G. A., & Phillips, T. G. 1997, ApJS, 108, 301
- Sridharan et al. (2002) Sridharan, T. K., Beuther, H., Schilke, P., Menten, K. M., & Wyrowski, F. 2002, ApJ, 566, 931
- Sutton et al. (1985) Sutton, E. C., Blake, G. A., Masson, C. R., & Phillips, T. G. 1985, ApJS, 58, 341
- Wilner et al. (1994) Wilner, D. J., Wright, M. C. H., & Plambeck, R. L. 1994, ApJ, 422, 642
- Wright et al. (1996) Wright, M. C. H., Plambeck, R. L., & Wilner, D. J. 1996, ApJ, 469, 216
- Wyrowski et al. (1999) Wyrowski, F., Schilke, P., Walmsley, C. M., & Menten, K. M. 1999, ApJ, 514, L43
| Line | Sizec | ||||
|---|---|---|---|---|---|
| GHz | Jy | ′′2 | |||
| SO2 | 216.643 | ||||
| H2S | 216.710 | 2.3 | 6.4 | 39.7 | 0.6 |
| HCOOCH3 18–17 | 216.839 | ||||
| CH3OH | 216.946 | 2.0 | 2.8 | 20.5 | 0.3 |
| HCOOCH3 20–19 | 216.966 | 2.1 | 2.3 | 15.9 | 0.2 |
| SiO 5–4 | 217.105 | 1.0 | 2.6 | 31.9 | 0.6 |
| ULa | 217.193 | ||||
| DCN 3–2 | 217.239 | 1.9 | 4.3 | 32.6 | 0.5 |
| ULa | 217.300 | ||||
| ULa | 217.400 | ||||
| HCOOCH3 19–18 E | 227.020 | ||||
| HCOOCH3 19–18 A | 227.028 | ||||
| HC3N 25–24 | 227.419 | 3.4 | 5.9 | 21.3 | 0.4 |
| HCOOCH3 21–20 | 227.562 | ||||
| ULa | 227.815 | ||||
| HCOOCH3 27–26 E | 343.732 | ||||
| CH3OCH3 17–16 | 343.753 | ||||
| HCOOCH3 27–26 A | 343.758 | ||||
| H2CS | 343.811 | ||||
| OC34S 29–28 | 343.983 | ||||
| HCOOCH3 32–31 | 344.030 | ||||
| CH2OH-E | 344.110 | ||||
| HC15N 4–3 | 344.200 | ||||
| SO | 344.311 | 2.4 | 4.2 | 5.6 | 1.5 |
| CH3OCH3 19–18 | 344.358 | ||||
| CH3OH | 344.445 | ||||
| CH3OCH3 11–10 | 344.512 | ||||
| 34SO2 | 344.581 | ||||
| ULa | 354.129 | ||||
| 13CH3OH | 354.446 | ||||
| HCN(0,1,0) 4–3 | 354.461 | ||||
| HCN 4–3 | 354.506 | 2.2 | 3.1 | 4.9 | 1.3 |
| HCOOCH3 33–32 | 354.608 | ||||
| HC3N 39–38 | 354.699 |