High Energy Large Area Surveys: optically obscured AGN and the history of accretion 111This work is partially supported by ASI grant I/R/057/02, by INAF grant # 270/2003 and MIUR grant Cofin–03–02–23
Abstract
Hard X-ray, large area surveys are a fundamental complement of ultra-deep, pencil beam surveys in obtaining a more complete coverage of the L–z plane, allowing to find luminous QSO in wide z ranges. Furthermore, results from these surveys can be used to make reliable predictions about the luminosity (and hence the redshift) of the sources in the deep surveys which have optical counterparts too faint to be observed with the present generation of optical telescopes. This allows us to obtain accurate luminosity functions on wide luminosity and redshift intervals.
1 Introduction
Hard X-ray surveys are the most direct probe of super-massive black hole accretion activity, which is recorded in the cosmic X-ray background (CXB) spectral intensity. Deep, pencil beam, Chandra and XMM-Newton surveys have resolved most of the CXB below 4-6 keV, and of the CXB at 10 keV (Worsley et al. 2004). The optical spectroscopic follow-up of the Chandra Deep Field North/South (CDFN, CDFS) and of the Lockman Hole (LH) surveys proved to be very efficient at identifying a large population of Seyfert-like objects up to z=2–3, and a few QSOs up to z=4, see Fig. 1a and references in Table 1). Shallower, but larger area surveys are therefore fundamental to: a) complement the pencil-beam survey to obtain a more complete coverage of the L–z plane, to find QSO with logL(2-10keV)44, i.e. close to AGN luminosity function L∗, in a large z range; b) to obtain reliable spectroscopic redshifts of the faint optical counterpats of sources with X-ray to optical flux ratio (X/O) much higher than that of typical broad line AGN (X/O), which make 20–30% of the full samples. At the 10-100 times fainter fluxes reached by the CDFN, CDFS and LH surveys most sources with high X/O have optical counterparts too faint for even 8–10 m class telescopes. The best hope to obtain information on this elusive X-ray source population is to make use of the information gained at higher fluxes to make reliable predictions about their luminosities and redshifts.
1.1 Source samples
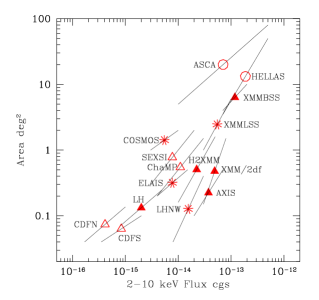
Figure 1b) compares the fluxes and area covered by a number of hard X-ray surveys. In this paper we use the source samples given in Table 1, which include the deepest surveys performed with Chandra and the shallower, but much larger area HELLAS2XMM survey. As of today we have obtained spectroscopic redshifts for more than 150 sources, and, most important, we were able to obtain spectroscopic redshifts and classification of many sources with X/O; finding about ten type 2 QSO at z=0.7–2, to be compared with the similar number obtained from the combination of the CDFN and CDFS, at the expenses of a huge investment of VLT and Keck observing time. For other 8 X/O sources a redshift estimate was obtained from their observed R–K colors (Mignoli et al. 2004).
| Sample | Tot. Area | Flux limit | # sour. | % z-spec | refs | symbol |
|---|---|---|---|---|---|---|
| deg2 | cgs | |||||
| HELLAS2XMM | 1.6 | 8.0 | 231 | 66% | 1,2 | open circ. |
| CDFN fainta | 0.0369 | 1.0 | 88 | 59% | 3,4 | filled squar. |
| CDFN brightb | 0.0504 | 3.0 | 44 | 65% | 3,4 | filled squar. |
| CDFS fainta | 0.0369 | 1.0 | 68 | 62% | 5,6 | stars |
| CDFS brightb | 0.0504 | 3.0 | 55 | 58% | 5,6 | stars |
| Lockman Holec | 0.126 | 4.0 | 55 | 75% | 7 | filled triang. |
| SSA13d | 0.0177 | 3.8 | 20 | 65% | 8 | filled circ. |
| Total | 561 | 65% |
a Inner 6.5 arcmin radius; b outer 6.5–10 arcmin annulus; c inner 12 arcmin radius; d inner 4.5 arcmin radius; (1) Fiore et al. 2003; (2) Cocchia et al. in prep.; (3) Alexander et al. 2003; (4) Barger et al. 2003; (5) Giacconi et al. 2002; (6) Szokoly et al. 2004; (7) Mainieri et al. 2002; (8) Barger et al. 2001.

2 Optically obscured AGN: a robust method to estimate their luminosity
Fiore et al. (2003) discovered a striking correlation between X/O and the 2–10 keV luminosity for the sources with the nucleus strongly obscured in the optical band, i.e. not showing broad emission lines (Fig. 2a). The dispersion along the correlation in Fig. 2a) is of 0.40 dex in luminosity. Note as at X/O most of the sources are from the HELLAS2XMM sample, i.e. it is mostly thank to this sample that it is possible to extend and validate the correlation at high X/O values, and therefore at high luminosities. From X/O, and hence the luminosity, it is possible to estimate the redshift of optically obscured sources. We call the resulting redshift estimates “X-photo-z”. Fig. 2b) plots our X-photo-z against the spectroscopic redshifts. The correlation is again rather good and . This can be compared with the value of , typical of accurate “photometric” redshift estimates. We note that in our case only 2 bands are used, agaist the several O-NIR bands necessary to obtain reliable photo-z. Our present X-photo-z estimates are obtained using a linear fit to the logX/O-logL(2-10keV) relationship. More accurate estimates can be obtained using higher order polinomia (Fiore et al. 2004 in prep.).


2.1 Optical vs X-ray obscuration: the “Figure of Merit”
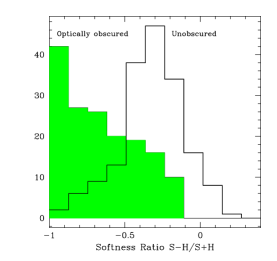
Perola et al. (2004) found that most type 2 AGN in the HELLAS2XMM sample have significant obscuration (rest frame absorbing column cm-2) also in the X-rays. Perola et al. (2004) and Comastri & Fiore (2004) also found a good correlation between X/O and . Both facts suggest that X-ray sources log are likely to be also optically obscured AGN. However, for many weak sources in the samples in Table 1 proper spectral fits are unfeasible and a rough spectral information can be derived from their softness ratio only. The correlation between the softness ratio and is reasonably good (Perola et al. 2004) and therefore using the former to select X-ray obscured AGN is not a bad approximation. The relationship between X-ray obscured AGN and optically obscured AGN is not one to one. This is clearly seen in Fig. 3b), which shows that of type 1 AGN have (S-H)/(S+H) (i.e. most of them have a soft spectrum) and of optically obscured AGN have (S-H)/(S+H) (i.e. the majority have a hard, likely obscured spectrum, but have a soft spectrum). This means that using a single (S-H)/(S+H) threshold to decide whether an X-ray source with a faint optical counterpart is an optically obscured AGN has an intrinsically large uncertainty. For this reason, we instead compute for each source a “figure of merit” (FoM, Fiore et al. 2004 in prep.), using: 1) the X/O ratio and the fraction of obscured/unobscured sources as a function of X/O (see Fiore et al. 2003); 2) the morphology of the optical counterpart, i.e point-like sources are likely to be optically unobscured sources; 3) the probability distribution of the softness ratio for obscured and unobscured AGN, as estimated for the sources with spectroscopic redshift and classification in Table 1. If a source has a FoM qualifying it as optically obscured we use the correlation in fig. 2a) to estimate its redshift; if a source qualifies as an optically unobscured AGN we guess its redshift using the loose relation between X-ray flux and redshift for type 1 AGN. These estimates should therefore be considered in a statistical sense only (Fiore et al. 2003). At fluxes lower than only of the sources qualify as unobscured AGN.
3 The evolution of hard X-ray selected sources
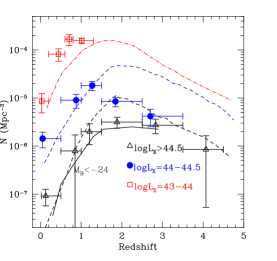
Once redshifts and luminosities of the sources of the full sample are known (either spectroscopically measured or photometrically and statistically estimated) we can compute the luminosity function of hard X-ray selected sources and its redshift evolution. Fig.3b) plots the AGN number density in three luminosity bins as a function of z. This is compared with the number density of luminous optically selected QSOs and with the prediction of the Menci et al. (2004) semi-analytic, hierarchical clustering model (MM). While the density of luminous AGN increases monotonically up to z, following the evolution of optically selected AGN, and in agreement with the MM, the evolution of increasingly lower luminosity AGN peaks at decreasingly lower redshifts. The peak redshifts are also lower than those of the MM predictions. At z the density of logL= AGN decreases sharply, and it is inconsistent with the MM predictions, while the density of logL AGN is not well constrained by the present data. An extenction of the present analysis to flux limits lower than those in Table 1, and therefore to higher z, is in progress (Fiore et al. 2004 in prep.). The paucity of Seyfert-like objects at z can be due to at least two reasons: a) a selection effect, i.e. highly obscured AGN are common at these redshifts (as in the nearby Universe) but are missed (or their luminosity is underestimated) in Chandra and XMM-Newton surveys (La Franca et al. 2004 in prep,; b) a different description of the mechanisms regulating the amount of cool gas in low-mass host galaxies, the physical mechanism at work at small accretion rates and/or the statistics of DM condensations is needed in the MM. To avoid possible selection effect, for an unbiased census of the AGN population making the bulk of the CXB and an unbiased measure of the AGN luminosity function at z=1–2, the ”golden epoch” of galaxy and AGN activity, sensitive observations extending at energies where photoelectic effect no more reduces the observed flux (i.e. E keV) are clearly needed. More specifically to resolve 50% of the 20–100 keV CXB we need to go down to fluxes of in this band (see fig. 6 of Menci et al. 2004). This can be achieved only by imaging X-ray telescopes, possibly with multi–layer coatings (see e.g. Pareschi & Cotroneo 2003). Key issues are: a) high collecting area; b) sharp PSF (15 arcsec or less Half Energy Diameter, HED); c) low detector internal background.
Acknowledgments
The original matter presented in this paper is the result of the effort of a large number of people, in particular of the HELLAS2XMM team (A. Baldi, M. Brusa, F. Cocchia, N. Carangelo, P. Ciliegi, F. Cocchia, A. Comastri, V. D’Elia, C. Feruglio, F. La Franca, R. Maiolino, G. Matt, M. Mignoli, S. Molendi, G. C. Perola, S. Puccetti, C. Vignali), N. Menci, A. Cavaliere, M. Elvis and P. Severgnini.
References
- [1] D.M. Alexander et al Astron. J. 126, 539 (2003).
- [2] A. Barger et al Astron. J. 126, 632 (2003).
- [3] A. Barger et al Astron. J. 121, 662 (2001).
- [4] A. Comastri & F. Fiore astro-ph/0404047 (2004).
- [5] F. Fiore et al. Astron. Astroph. 409, 79 (2003).
- [6] R. Giacconi et al. Astroph. J. S. 139, 369 (2002).
- [7] V. Mainieri et al. Astron. Astroph 393, 425 (2002).
- [8] N. Menci et al. Astroph. J 606, 58 (2004).
- [9] M. Mignoli et al. Astron. Astroph. 418, 827 (2004)
- [10] G. Pareschi & V. Cotroneo SPIE Proc. 5156 (2003)
- [11] G.C. Perola et al. Astron. Astroph. in press (2004), astro-ph/0404044.
- [12] G.P. Szokoly et al. Astroph. J in press (2004), astro-ph/0312324.
- [13] M.A. Worsley et al. MNRAS submitted (2004), astro-ph/0404273.