IRAC Colors of Young Stellar Objects
Abstract
We compare the infrared colors predicted by theoretical models of protostellar envelopes and protoplanetary disks with initial observations of young stellar objects made with the Infrared Array Camera (IRAC) on the Spitzer Space Telescope (Werner et al. 2004, Fazio et al. 2004). Disk and envelope models characterized by infall and/or accretion rates found in previous studies can quantitatively account for the range of IRAC colors found in four young embedded clusters: S 140, S 171, NGC 7129, and Cep C. The IRAC color-color diagram () can be used to help to distinguish between young stars with only disk emission and protostars with circumstellar envelopes.
1 Introduction
It has now been several decades since the first observations of infrared excess emission from young stars (Mendoza 1966, 1968). The excess emission is well above that expected from reddened stellar photospheres and originates from the dusty circumstellar disks and envelopes surrounding young stars. For these reasons, infrared color-color diagrams have proven to be excellent tools for identifying and classifying young stellar objects (YSO). In general, young stars are found to fall in three regions in the near-IR (JHKL) diagrams. Objects with accretion disks (Class II) fall on the classical T Tauri (CTT) locus or along the reddened CTT locus, and objects whose emission is dominated by an infalling envelope (Class I) fall redward of the reddened CTT locus. Stars having disks with large inner holes are found in the region corresponding to reddened main sequence stars (Meyer, Calvet & Hillenbrand 1997). In an exhaustive study of star formation in the Taurus molecular cloud, Kenyon & Hartmann (1995) combined ground-based near-IR photometry with IRAS fluxes to derive spectral indices for Class I and II sources and to show that there is a smooth progression in IR colors from disk-dominated Class II to envelope-dominated Class I. They, along with others (Lada et al. 2000) also showed that the K-L color index is a more effective measure of near-IR excess than H-K and is better for distinguishing Class I from Class II sources.
The Infrared Array Camera (IRAC) on the Spitzer Space Telescope has the potential to extend our understanding of disk evolution and star formation by detecting optically obscured, deeply embedded young stars and protostars, the emission from their disks and, at earlier stages, from their infalling envelopes. The great advantage of IRAC over ground-based telescopes is its sensitivity in the 3-8 m bands that contain relatively little contribution from stellar photospheres as compared to disks and envelopes. It is important that we understand this new color space and how to use it to identify young stars of various evolutionary classes. This contribution presents a preliminary interpretation of the IRAC color-color diagram, using predictions of existing models for disks and envelopes, and adopting values for parameters which are well understood from star formation studies of nearby regions like the Taurus molecular cloud. These models define clearly separated regions in the IRAC color-color diagram. IRAC observations of four young clusters (Megeath et al. 2004) are consistent with the model predictions.
2 Models
Models in the disk grid were calculated according to the procedures of D’Alessio et al. (1998, 1999, 2001). In brief, the disk is assumed to be steadily accreting at a rate onto a star of age , mass , radius , and effective temperature . The material in the disk consists of gas and dust, with the standard mass ratio (), well mixed and uniformly distributed. The dust mixture is that proposed by Pollack et al. (1994) and has a size distribution between limiting sizes and . The disk is heated by viscous dissipation and by irradiation from the central object, and viscosity is calculated with the prescription (Shakura & Sunyaev 1974). Models are truncated at the dust destruction radius , where the disk is frontally illuminated by the central object, because gas inside is optically thin (D’Alessio et al. 2004). The truncation radius is set by the sum of the stellar and accretion luminosity (Muzerolle et al. 2003), and the dust destruction temperature is set at 1400K, the sublimation temperature of silicates at characteristic densities of the inner disk. The wall at , which has a fixed height of four scale heights, emits as a black body at this temperature (Natta et al. 2001; Muzerolle et al. 2003; D’Alessio et al. 2003). The equations of disk structure are solved including these heating sources to yield the detailed radial-vertical structure. The emerging spectral energy distribution (SED) is calculated by ray-by-ray integration of the transfer equation for each line of sight. Using these procedures, we have constructed an extensive grid of disk models which cover the following range of parameter space: 4000K - 10000K for 1 and 10 Myr old stars, log to , disk radii = 100 and 300 AU, , , and inclinations and , with fixed and . Details of the grid will be published elsewhere (D’Alessio et al. 2004). Here we present only those models for 4000K, Myr.
Models in the Class I grid were calculated following the procedures of Kenyon, Calvet, & Hartmann (1993, KCH93) and Calvet et al. (1994). The slowly rotating infalling envelope structure of Terebey, Shu, & Cassen (1984) has been adopted; in this model, the envelope is nearly spherically symmetric at radii much larger than the centrifugal radius and departs from spherical symmetry at radii , where material falls onto the disk. The heating of the matter in the envelope with density distribution is set by the luminosity of the central object . The temperature is calculated from the radiative equilibrium condition using the angle-averaged density, and the inclination dependent flux is calculated from ray-by-ray integration of the transfer equation using the angle-dependent density. The scattering component of the source function in the flux calculation has been taken as the sum of the direct and the diffuse mean intensity, following Calvet et al. (1994). Class I models were calculated for and , log and , where is the density at 1 AU of the equivalent spherically symmetric envelope (see KCH93), and = 50 and 300 AU. Model colors shown have been calculated for an inclination of 60∘.
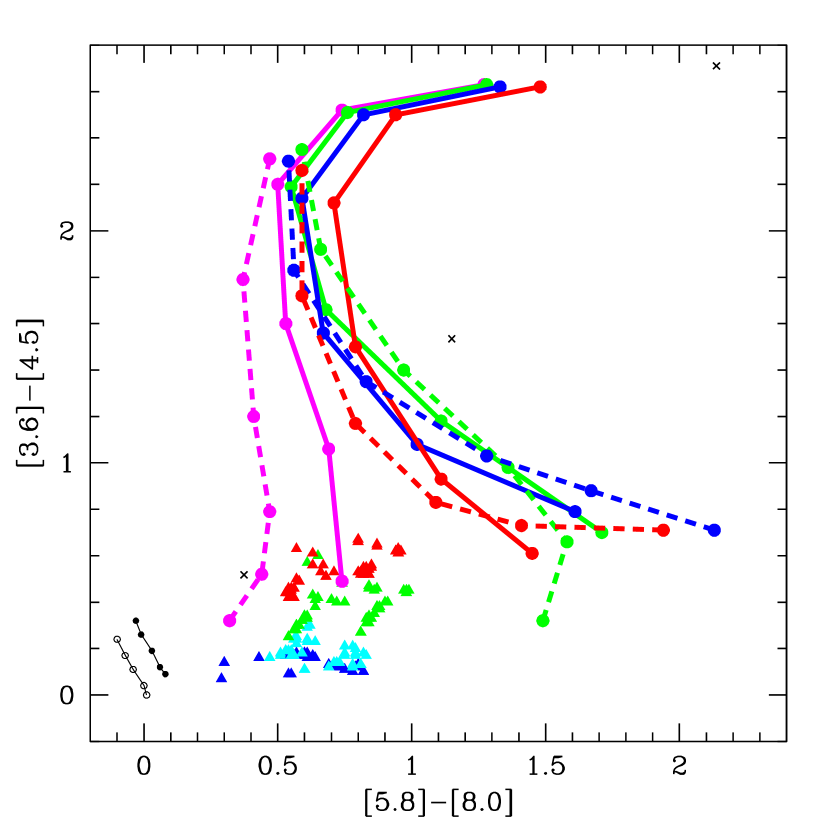
Model colors were calculated by convolving the model spectral energy distribution with the IRAC filter response functions and by using the Vega fluxes in the IRAC bands as photometric zero points. The resulting magnitudes are thus referenced to the Vega system (as are the measured magnitudes of the embedded cluster sample). Figure 1 shows IRAC colors from grids of disk (Class II) and infalling envelope (Class I) models. The models cover the range of parameters typical of young stellar objects.
3 Discussion
3.1 Disk models
The novel element introduced in the disk models presented here is the emission of the disk wall at the dust sublimation radius. A sharp transition in the disk where dust sublimates, illuminated directly by the star, was presented as the explanation for the near infrared SEDs of Herbig Ae/Be stars by Natta et al. (1999). Muzerolle et al. (2003) found similar excesses in Classical T Tauri stars and realized that for these low luminosity objects, the accretion luminosity emitted by the accretion shock on the stellar surface must be included when finding the dust sublimation radius.
Figure 2 shows the SEDs for a representative model. The wall contribution plays a substantial role in the IRAC wavelength range and results in a relatively compact region in the color plane, as shown by the triangles in Figure 1.
The spread in the color is dominated by accretion rate; sources with higher are redder in . This behavior is due to an increase of both the disk emission and the wall emission as increases. As the accretion rate rises, there is an increase in viscous dissipation resulting in higher disk fluxes. In addition, the increase in results in more energy irradiating the wall; as a result, the dust sublimation radius moves outward, and the wall emitting area increases (Muzerolle et al. 2003). Although not shown here for economy of space, we note that the wall emission becomes increasingly dominant as the stellar luminosity increases, and so does the wall emitting area. In fact, for stellar properties corresponding to Herbig Ae/Be stars, for which , the predicted color is approximately constant, 0.4, equal to that of the black body at T = 1400K, the assumed dust destruction temperature.
Disk emission is more conspicuous in the color, as shown in Figure 2, and therefore disk properties such as grain size and play a larger role in determining the spread. For instance, the disk contribution decreases as increases because the disk becomes less flared (D’Alessio et al. 2001). As a result, the colors becomes bluer. Another source of spread is inclination. The two inclinations plotted in Figure 1 ( and ) form discernible loci, with the higher inclination sources redward of the lower ones. Although a Class II source with an extremely high inclination (i.e. edge-on) may lie blueward of this region (reflecting the scattered stellar component), most of the inclination-dependent behavior of the models is encompassed in the region plotted.
3.2 Envelope models
Envelope models (plotted as circles in Figure 1) span a larger space in both colors compared to disk models. To understand the color behavior in a schematic way consider Figure 3, which shows model SEDs. An increase in density in the envelope results in a shift of the surface further out in the envelope (cf. Appendix in KCH93; Hartmann 1998). As a result, the overall SED shifts toward longer wavelengths, and the colors become rapidly redder with increasing density. In addition, as the amount of material in the envelope increases, absorption increases, and the silicate feature at 10 becomes deeper. The color becomes first bluer, as the flux in [8.0], contaminated by the silicate feature, decreases faster than the flux in the [5.8] band. As density continues to increase, this situation reverses, and the color becomes redder.
As shown in the bottom panel of Figure 3, an increase in , which implies clearing of the inner envelope, is equivalent in the near- to mid-infrared to a decrease in density. As a result, the color becomes bluer, and so does the color for high values of . However, for low , the silicate feature turns into emission, making the color redder (Figure 1).
The color behavior as a function of and does not depend strongly on source luminosity. However, as shown in Figure 2 of KCH93, the strength of the silicate absorption feature decreases as luminosity increases. At high values of , the colors are less affected by the silicate absorption and do not get as blue as increases. At low densities, the extinguished spectrum of the central object begins to contribute along with envelope emission in the IRAC bands, which tends to make the color bluer; a competing effect is the increase in strength of the silicate emission, which makes redder. For , the second effect is negligible so colors are very blue (Figure 1).
Other effects not included in this preliminary modeling effort, such as degree of flattening of the envelope or the presence of outflow cavities, may change the colors as well, especially at low densities. For example, Whitney et al. (2003) predicted IRAC colors for a range of protostellar (Class 0,I) and T Tauri objects (Class II). Their calculations for Class II objects span a much smaller range in the color-color diagram because they considered a much smaller range of parameter space than we have here, and they did not include the effects of a hot inner disk wall. The objects Whitney et al. label as Class I have predicted colors that are considerably bluer than we infer here and the region populated by Class 0 sources in the Whitney et al. calculations overlaps with the region of Taurus Class I sources (Hartmann et al. 2004). The discrepancy appears to be the result of the particular outflow cavities adopted by Whitney et al. , which greatly reduce the amount of dust close to the central source and thus strongly reduce the extinction and dust thermal emission in the 3-8 m region (see Osorio et al. 2003 for a related discussion).
3.3 Comparison with observed colors
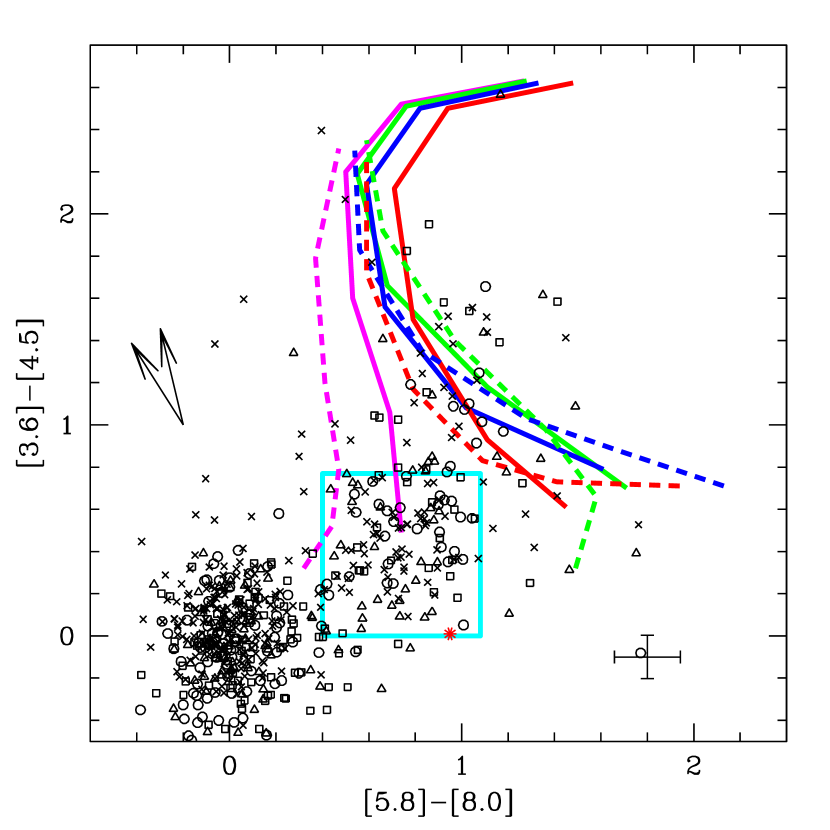
Figure 4 shows measured IRAC colors of four young clusters (Megeath et al. 2004; Gutermuth et al. 2004) and for comparison the loci of the models presented in Figure 1. The data seem to cluster into three main regions: a clump around 0,0 that contains mostly background/foreground stars and Class III sources with no intrinsic infrared excess, a clump that occupies the Class II region (within the large blue box), and a group that runs along the Class I locus with . Sources which lie between the colors of stellar photospheres and Class III stars ( 0) and Class II sources ( 0.4) can be understood if the height of the wall at was less than assumed here, due to the effects of dust grain growth and settling. In addition, there are a few sources which do not lie inside the Class II locus but do lie along the extinction vector and could therefore be reddened Class IIs. The most extreme of these, near , are coincident with filaments of high opacity (dark even at 8 m), consistent with the large implied by this scenario. Alternatively they could be extremely low-luminosity Class I sources.
The common definition of Class I and II sources is that they have positive or negative spectral indices, respectively, in ; thus the approximate boundary between Class I and II should lie approximately at and . The model predictions presented here are in agreement with this boundary. As discussed, features in the SED, notably the silicate feature at 10 , have a large effect on the color, producing some exceptions to this rule. In addition, the colors of low density envelopes are very sensitive to the nature of the central objects contained within. For example, low density envelopes around stars with disks would have colors near the Class II locus.
4 Summary
The IRAC color-color diagram () is a useful tool for identifying young stars having infrared excess emission. While there is some overlap between low density, low luminosity Class I sources and Class II sources, the classes are otherwise well segregated. The distribution of measured IRAC colors of sources in four young clusters is consistent with the distribution of model colors. Confirmation of this color-color diagram as a powerful diagnostic tool awaits a more detailed comparison to the observed colors of well characterized individual sources.
References
- Calvet et al. (1994) Calvet, N., Hartmann, L., Kenyon, S. J., & Whitney, B. A. 1994, ApJ, 434, 330
- D’Alessio et al. (1998) D’Alessio, P., Cantó, J., Calvet, N., & Lizano, S. 1998, ApJ, 500, 411
- D’Alessio et al. (1999) D’Alessio, P., Calvet, N., Hartmann, L., Lizano, S. & Cantó, J. 1999, ApJ, 527, 893
- D’Alessio, Calvet & Hartmann (2001) D’Alessio, P., Calvet, N., & Hartmann, L. 2001, ApJ, 553, 321
- D’Alessio, Calvet & Hartmann (2003) D’Alessio, P., Calvet, N., & Hartmann, L. 2003, IAU 221, 256
- D’Alessio et al. (2004) D’Alessio, P., Merin, B., Calvet, N., & Hartmann, L. 2004, in preparation.
- Draine & Lee (1984) Draine, B. T. & Lee, H. M. 1984, ApJ, 285, 89
- Fazio et al. (2004) Fazio et al. 2004, ApJS, this volume
- Gutermuth et al. (2004) Gutermuth, R. A., Megeath, S. T., Muzerolle, J., Allen, L. E., Pipher, J. L., Myers, P. C. & Fazio, G. G. 2004, ApJS, this volume
- Hartmann (1998) Hartmann, L. 1998, “Accretion processes in star formation”, Cambridge University Press (Cambridge astrophysics series ; 32), ISBN 0521435072
- Hartmann et al. (2004) Hartmann, L. et al. 2004, in preparation
- Kenyon, Calvet & Hartmann (1993) Kenyon, S. J., Calvet, N., & Hartmann, L. 1993, ApJ, 414, 676
- Lada et al. (2000) Lada, C. J., Muench, A. A., Haisch, K. E., Jr., Lada, E. A., Alves, J. F., Tollestrup, E. V. & Willner, S. P. 2000, AJ,120, 3162
- Mathis (1990) Mathis, J. S. 1990, ARA&A28, 37
- Megeath et al. (2004) Megeath, S. T., Gutermuth, R. A., Allen, L. E., Pipher, J. L., Myers, P. C., & Fazio, G. G. 2004, ApJS, this volume
- Mendoza (1966) Mendoza V, E. E. 1966, ApJ143, 1010
- Mendoza (1968) Mendoza V, E. E. 1968, ApJ151, 977
- Meyer, Calvet & Hillenbrand (1997) Meyer, M. R., Calvet, N. & Hillenbrand, L. A. 1997, AJ, 114, 288
- Muzerolle et al. (2000) Muzerolle, J., Calvet, N., Bricenõ, C., Hartmann, L. & Hillenbrand, L. 2000, ApJ, 535, L47
- Muzerolle et al. (2003) Muzerolle, J., Calvet, N., Hartmann, L. & D’Alessio, P. 2003, ApJ, 597, L149
- Natta et al. (2001) Natta, A., Prusti, T., Neri, R., Wooden, D., Grinin, V. P. & Mannings, V. P. 2001, å371, 186
- Osorio et al. (2003) Osorio, M., D’Alessio, P., Muzerolle, J., Calvet, N., Hartmann, L. 2003, ApJ, 586, 1148
- Pollack et al. (1994) Pollack, J. B., Hollenbach, D., Beckwith, S., Simonelli, D. P., Roush, T. & Fong, W. 1994, ApJ, 421, 615
- Shakura & Sunyaev (1973) Shakura, N.I., & Sunyaev, R.A. 1973, A&A, 24, 337
- Werner et al. (2004) Werner et al. 2004, ApJS, this volume
- Whitney et al. (2003) Whitney, B. A., Wood, K. A., Bjorkman, J. E. & Cohen, M. 2003, ApJ, 598, 1079