The Colors of Dwarf Elliptical Galaxy Globular Cluster Systems, Nuclei and Stellar Halos
Abstract
We present the results of a Hubble Space Telescope WFPC2 F555W and F814W survey of 69 dwarf elliptical galaxies (dEs) in the Virgo and Fornax Clusters and Leo Group. The colors of the dE globular clusters, nuclei, and underlying field star populations are used to trace the dE star-formation histories. We find that the dE globular cluster candidates are as blue as the metal-poor globular clusters of the Milky Way. The observed correlation of the dE globular cluster systems’ color with the luminosity of the host dE is strong evidence that the globular clusters were formed within the the halos of dEs and do not have a pre-galactic origin. Assuming the majority of dE clusters are old, the mean globular cluster color- host galaxy luminosity correlation implies a cluster metallicity galaxy luminosity relation of , which is significantly shallower than the field star metallicity - host galaxy luminosity relationship observed in Local Group dwarfs (). The dE stellar envelopes are magnitudes redder in than their globular clusters and nuclei. This color offset implies separate star-formation episodes within the dEs for the clusters and field stars, while the very blue colors of two dE nuclei trace a third star-formation event in those dEs less than a Gyr ago.
1 INTRODUCTION
It is generally believed that the dwarf galaxies we observe in the local universe are survivors of the hierarchical growth of massive galaxies. While present-day dwarf galaxies may somehow be different from the majority of proto-galactic fragments which coalesced into larger objects, the formation of stars in the smallest survivors are an important test of our understanding of galaxy formation and evolution. If star-formation quickly follows the gravitational collapse of the initial density perturbations in the early universe, we might expect the stars in dwarf galaxies to be quite old because their halos should be among the first objects to form. Dwarfs in large-scale over-densities destined to become clusters and groups should collapse and form stars at earlier times than galaxies formed in under-dense regions (Tully et al. 2002). Yet star-formation must not proceed too quickly, otherwise the baryons in the universe would become locked up in stellar remnants, leaving no fuel for the star-formation we see locally (e.g. Kauffmann, White, & Guiderdoni 1993).
Dwarf elliptical galaxies (and their low-mass Local Group analogues, dwarf spheroidals or dSphs) are an obvious place to look for ancient stars and to track early star-formation. dSphs and dEs in the Local Group are almost completely free of gas and typically dominated by stars older than several billion years. These objects range from dEs with and total masses down to dSphs with and total masses . While the smallest dSphs have masses and luminosities comparable to massive star clusters, they are physically different entities. Dwarf galaxies sit inside the gravitational potential wells of dark matter halos, and the kinematics of their stars are increasingly dominated by this underlying dark matter halo (e.g. Aaronson 1983; but see Geha, Guthathakurta, & van der Marel 2002), whereas star clusters do not have associated dark matter halos (Pryor et al. 1989; Moore 1996). Massive globular clusters are compact, high-surface brightness objects, while dE/dSphs are diffuse and extended with decreasing surface-brightnesses with decreasing luminosities (Kormendy 1985). Most star clusters consist of a single population of stars with uniform age and chemical composition. On the other hand, studies of the color-magnitude diagrams and spectroscopic abundances of individual stars in Local Group dEs/dSphs show surprisingly complex star-formation and chemical enrichment histories in even the faintest galaxies (e.g. Carigi, Hernandez, & Gilmore 2002; Grebel 1997; Smecker-Hane et al. 1994).
The complex star-formation histories of the nearest dEs/dSphs are probably regulated by a number of mechanisms. Because of their low masses and shallow gravitational potential wells, dwarf galaxies are potentially fragile systems. The radiation, stellar winds, and supernovae produced by the first generations of stars can photo-dissociate, shock-heat, and expel much of the remaining gas, thereby suppressing future star-formation. Dekel and Silk (1986) and later work by Dekel & Woo (2003) showed that the onset of supernovae-driven winds could explain the observed scaling relations of metallicity and mass-to-light ratio with total luminosity for galaxies less massive than . External heating by the high background of ultraviolet photons prevalent at early times in the universe (the epoch of re-ionization) can photo-ionize and even photo-evaporate small gaseous halos and prevent star-formation altogether (Efstathiou 1992; Babul & Rees 1992; Bullock, Kravtsov, & Weinberg 2000). Dwarf halos with virial velocities km s-1 which collapse after re-ionization may never accrete gas or form stars and remain dark (Bullock et al. 2000), while more massive halos and those which collapse prior to re-ionization in over-dense regions may produce some stars, albeit very inefficiently (Dong, Murray, & Lin 2003). Dwarf halos may also be rejuvenated by accreting new gas and/or cooling sufficiently to form stars after the UV-background has sufficiently cooled at (Babul & Rees 1992, Efstathiou 1992). Finally, star-formation in dwarf galaxies may be strongly dependent on their environments and interactions with other galaxies. dEs are found exclusively as the satellites of massive galaxies or in rich clusters of galaxies. The rich cluster environment can ram-pressure strip accreted field dwarfs of their gas (Lin & Faber 1983) and transform or tidally destroy dwarfs via multiple encounters with more massive galaxies (Moore, Lake, & Katz 1998; Kravtsov, Gnedin, & Klypin 2004).
Disentangling the effects of these different processes on the evolution of dEs is challenging. In the Local Group, we have the advantage of proximity and can resolve the stars in dEs/dSphs. The color-magnitude diagrams and spectroscopic abundances of these stars can then be used to trace the star-formation and chemical enrichment histories of the dSph (eg. Grebel 1997). In the Virgo and Fornax Clusters are thousands of dEs, but because of their distances, current (largely ground-based) studies of these objects have been limited to the integrated colors and spectra. In this study of Leo, Virgo and Fornax Cluster dEs, we still cannot examine the properties of their individual stars. However, with HST resolution, we can distinguish their bright star clusters and nuclei from the stellar envelopes of field stars and use the colors of these three sub-populations to constrain the evolution of cluster dEs.
dEs and dSphs possess increasing globular cluster specific frequencies (number of globular clusters per host galaxy luminosity normalized to ) at fainter luminosities (Miller et al. 1998). Studies of the globular cluster systems of Local Group dSph and a few dEs outside of the Local Group indicate that the majority of dE globulars are as old and metal-poor as the oldest globular clusters in the Milky Way ([Fe/H], 10 Gyr), and are significantly more metal-poor than their associated field star populations (Strader et al. 2003; Puzia et al. 2000; Buonanno et al. 1999; Da Costa & Mould 1998; Durrell et al. 1996a,b). A handful of intermediate-age and metal-rich clusters are also found in the Local Group dSph (van den Bergh 2000). High-resolution numerical simulations of the collapse of dwarf-sized dark matter halos predict the formation of dense star clusters within dwarf halos at redshifts greater than 10 (Bromm & Clarke 2002). However, the origin of metal-poor globular clusters as “pre-galactic” (Peebles & Dicke 1968; Burgarella et al. 2001; Beasley et al. 2003) or associated with galaxy formation and assembly (Searle & Zinn 1978; Cote et al. 1998; Bromm & Clarke 2002; Kravtsov & Gnedin 2003) remains controversial.
Bright dEs often have luminous compact stellar nuclei. The nature and formation of the dE nuclei are poorly understood. The fraction of nucleated Virgo dEs increases with both dE luminosity (Binggeli & Cameron 1991) and position within the cluster (Ferguson & Sandage 1989). In dense environments such as the centers of clusters of galaxies, the pressure from the surrounding inter-galactic medium may allow dwarf galaxies to retain their gas during star formation and produce multiple generations of stars (Babul & Rees 1992), forming nuclei in the process. Spectroscopy of several bright Fornax dE nuclei show Balmer lines stronger than the metal-rich globular cluster 47 Tuc (Held & Mould 1994; Brodie & Huchra 1990), and NGC 205’s nucleus is very blue and has strong Balmer line absorption (Jones et al. 1996; Ho, Filippenko, & Sargent 1995). These examples suggest that the stars in many dE nuclei may have formed quite recently. However, Sagittarius’s probable nucleus is the massive, old, and metal-poor globular cluster M54 (Sarajedini & Layden 1995). The expected dynamical friction timescales for massive globular clusters in the low-density dEs is quite short, therefore many nuclei could simply be bright clusters that have spiraled into the center (Lotz et al. 2001; Oh & Lin 2000; Hernandez & Gilmore 1998), and contain predominately old and metal-poor stars.
The integrated colors and spectral features of the field stars in nearby cluster dEs are consistent with the intermediate and old mean ages ( Gyr) and intermediate metallicities ( [Fe/H] 0) derived for most Local Group dE/dSphs (e.g. Rakos et al. 2001; Conselice, Wyse, & Gallagher 2003; Geha et al. 2003). The details of the past star-formation events are impossible to recover from the integrated colors and spectral features of a complex stellar population; however spectroscopic measurements of the abundance of alpha elements (produced in both Type I and II SN) as compared to iron (primarily produced in Type I SN) give /Fe ratios equal to the solar value and below (Thomas et al. 2003; Geha et al. 2003). This implies that the majority of stars in dEs were produced more than 1 Gyr after initial onset of star-formation and after Type I SN chemically-enriched the dE interstellar medium.
In this paper, we examine the colors of the globular clusters, nuclei, and field stars of 69 dwarf elliptical galaxies observed with the Hubble Space Telescope. In §2, we describe our globular cluster detection and photometry, and the photometry for the dE stellar envelopes. In §3, we present the observed colors for each of these sub-populations and their dependence on the host galaxy properties and environment. In §4, we discuss the implications of the observed correlations for the formation of dE globular cluster systems and the star-formation histories of dEs.
2 HST dE SNAPSHOT SURVEYS I, II, & III
The HST Dwarf Elliptical Galaxy Snapshot Survey has observed 69 dEs (Table 1) in the Leo Group and the Virgo and Fornax Clusters with the Hubble Space Telescope Wide Field/Planetary Camera 2 (HST WFPC2, GO Programs 6352, 7377, and 8500). The dE sample spans 6 magnitudes in () and has 45 nucleated and 24 non-nucleated dEs. HST WFPC2 images in filters F555W (2 230 s) and F814W (300 s) were taken of each galaxy, with the galaxy centered on chip WF3. The data were corrected for instrumental signatures by the standard HST calibration pipeline. A combined, cosmic-ray rejected F555W image was created with the cosmic-ray rejection routine COSMICRAYS (R. White, priv. comm.) and used as a template to identify and remove cosmic-rays from the single F814W image.
2.1 Globular cluster candidate detection and photometry
Globular clusters are compact bright star clusters, with typical absolute magnitudes and half-light radii pc (Ashman & Zepf 1998). The high angular resolution of the WFPC2 images ( per pixel) allows us to distinguish bright globular cluster candidates and nuclei from the underlying diffuse halo of dE field stars. At the distance of the Leo Group and the Virgo and Fornax Clusters, globular clusters are not truly resolved in short exposures by the WF camera and may be treated as point sources. The IRAF DAOPHOT point-source detection algorithm was run on the combined, cosmic-ray corrected F555W image to identify compact sources with fluxes above the background within a 0.2 ″ radius aperture. The F555W and F814W fluxes for all detected point sources were measured within this aperture, and corrected for the missing flux in the wings of the PSF (i.e. aperture-corrected). The average aperture corrections for the WF chips are magnitudes for F555W and magnitudes for F814W (see §2.4 in Miller et al. 1997 for description of how these corrections are calculated). We also corrected the flux of the globular cluster candidates for the charge transfer efficiency effects across the WF chips (Whitmore & Heyer 1995). We adopted the Holtzman et al. (1995) photometric calibrations to transform our F555W and F814W photometry to the standard Johnson and Cousins values. Foreground Galactic extinction and reddening values were taken from Schlegel et al. (1998, courtesy of the NASA Extragalactic Database) for each galaxy. Because most dEs are gas-poor systems, we assumed no internal extinction. Only FCC46 shows evidence for internal dust and active star-formation (Drinkwater et al. 2000). We adopted distance moduli of 30.0 for the Leo Group, 30.92 for the Virgo Cluster, and 31.39 for the Fornax Cluster, based on the Cepheid distances calculated by the HST Key Project (Freedman et al. 2001). It is important to note that these are average distances to these clusters and that the Virgo and Fornax Clusters have a depth along the line of sight of Mpc (Neilsen & Tsventanov 2000). We do not have independent distance estimates for each dE, and so the absolute magnitudes for the globular clusters and dEs have distant-dependent uncertainties on the order of magnitudes.
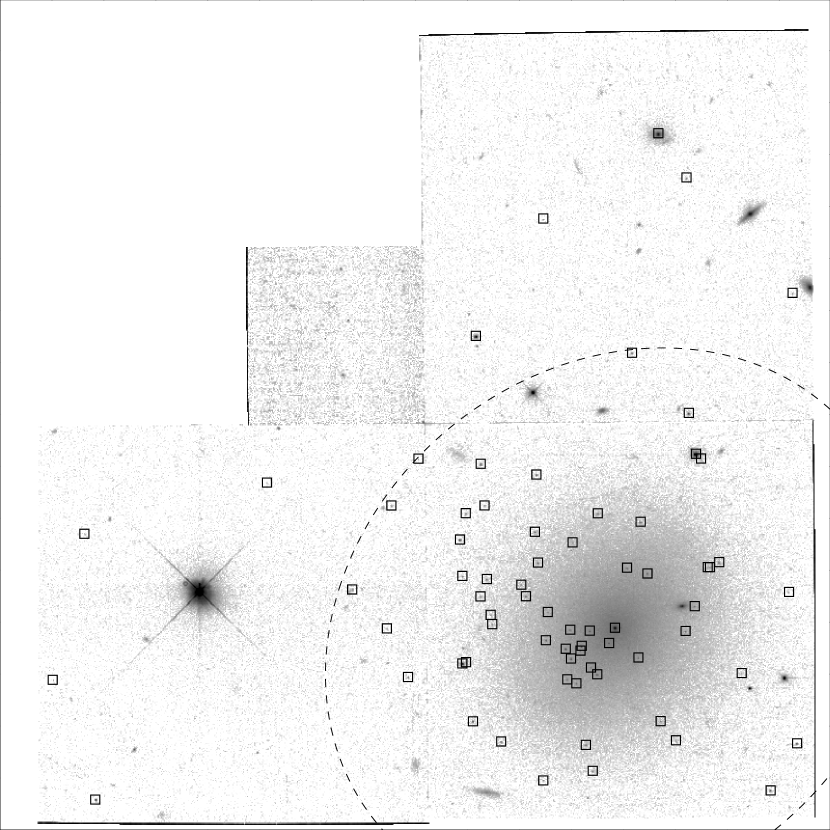
Globular cluster candidates (GCCs) were selected based on size (FWHMF555W 2.5 pixels), color ( and error ), and proximity to the galaxy (see Miller et al. 1997 for discussion of globular cluster candidate color and size selection). Compact background galaxies and foreground stars within our color criteria may be mistaken for globular cluster candidates, and there may exist intergalactic globular clusters which are not bound to the dEs. We must correct for this contamination when estimating the number of globular clusters associated with each dE and examining their colors. In Tables 2 and 3, we have assumed that objects meeting our candidate criteria on WF chips 2 and 4 and outside of an elliptical aperture centered on the dE with semi-major axis length equal to 5 times the dE’s exponential scalelength are background contaminants (Figure 1). The number density per area of these background objects were used to correct the number of observed GCCs on WF chip 3 and those on WF chips 2 and 4 that lie within 5 scalelengths of each dE.
Monte Carlo simulations of our point source detection indicate that our detections become incomplete at . Assuming that dE globular clusters have a intrinsic luminosity function similar to the Milky Way globular cluster luminosity function, we detect of the globular clusters in the Fornax dE images, 90% of the globular clusters in the Virgo dE images, and 98% of the globular clusters in the Leo dE images.
2.2 Galaxy photometry
The HST snapshot observations are not well suited to measuring the total galaxy luminosities. The flux of brightest dEs spills out onto chips WF2 and WF4, whereas the faintest (and lowest surface brightness) dEs are barely detectable above the sky noise. Stiavelli et al. (2001) fit the surface brightness profiles for a subset of 25 dEs (observed during cycle 6) with Sersic profiles and derived total magnitudes from their fits. They also measured the color profiles and find little evidence for radial color gradients. Therefore the color measured within a fixed aperture should be a reliable estimate of the galaxy’s true color.
We measured the relative fluxes of and within a fixed isophotal aperture for 45 dEs in our sample with central surface brightnesses magnitudes per □″, using the galaxy photometry package SExtractor (Bertin & Arnouts 1996). In order to improve the signal to noise for the galaxy detection algorithm, the F555W and F814W images were summed together and used as the SExtractor detection image. The isophotal aperture for each galaxy was set at 1 above the sky level in the summed image; a lower detection threshold resulted in numerous spurious noise detections around the perimeter of the galaxy and a higher detection threshold failed to find the dEs. The galaxy flux within this aperture was then measured for the F555W and F814W images separately. SExtractor also corrects the measured galaxy fluxes for extended background galaxies observed directly behind the galaxy. The flux from the compact globular cluster candidates and the central nuclei was included in the isophotal flux of the galaxy. Most nuclei are too faint to contribute significantly to the measured colors of the dE stellar envelopes. The two brightest nuclei are the red nucleus of VCC1254 () and the very blue nucleus of FCC46 (). For these two galaxies, we masked out the nuclei and re-measured the stellar envelope color. We found no change in the color of FCC46, while VCC1254 became 0.05 magnitudes redder. Given that the errors on the galaxy colors are , we expect that the rest of the nuclei will have a negligible effect on the dE halo colors.
The measured galaxy colors were transformed to the Johnson-Cousins photometric system using the same equations as the globular clusters (Holtzman et al. 1995). Due to the extended nature of the galaxies, no charge transfer efficiency corrections were applied to the galaxy colors. Ignoring this correction adds an additional 1.5% uncertainty. The galaxy colors were de-reddened using the Schlegel et al. (1998) foreground extinction values. The galaxies’ surface brightness profiles were measured from the WFCP2 F555W images in elliptical apertures using the IRAF task ELLIPSE and fit to exponential profiles:
| (1) |
where is the central intensity and is the exponential scalelength.
3 COLORS OF dE STELLAR POPULATIONS
3.1 dE Globular Cluster Systems
Although dEs have large numbers of globular clusters for their luminosities (Miller et al. 1998), they are faint and possess at most a handful of clusters. We generally find less than 20 GCCs above the background counts for each dE (Tables 2 and 3). Because of the relatively high fraction of background contamination (), determining the mean color and the color distribution for each dE globular cluster system is impossible without spectroscopic confirmation of the globular cluster candidates. Instead, we have constructed composite cluster color distributions for all the dEs within a given absolute magnitude range. By binning the globular cluster candidates by host galaxy luminosity, we improve our number statistics, can correct for the background contamination, and look for broad trends with dE luminosity.
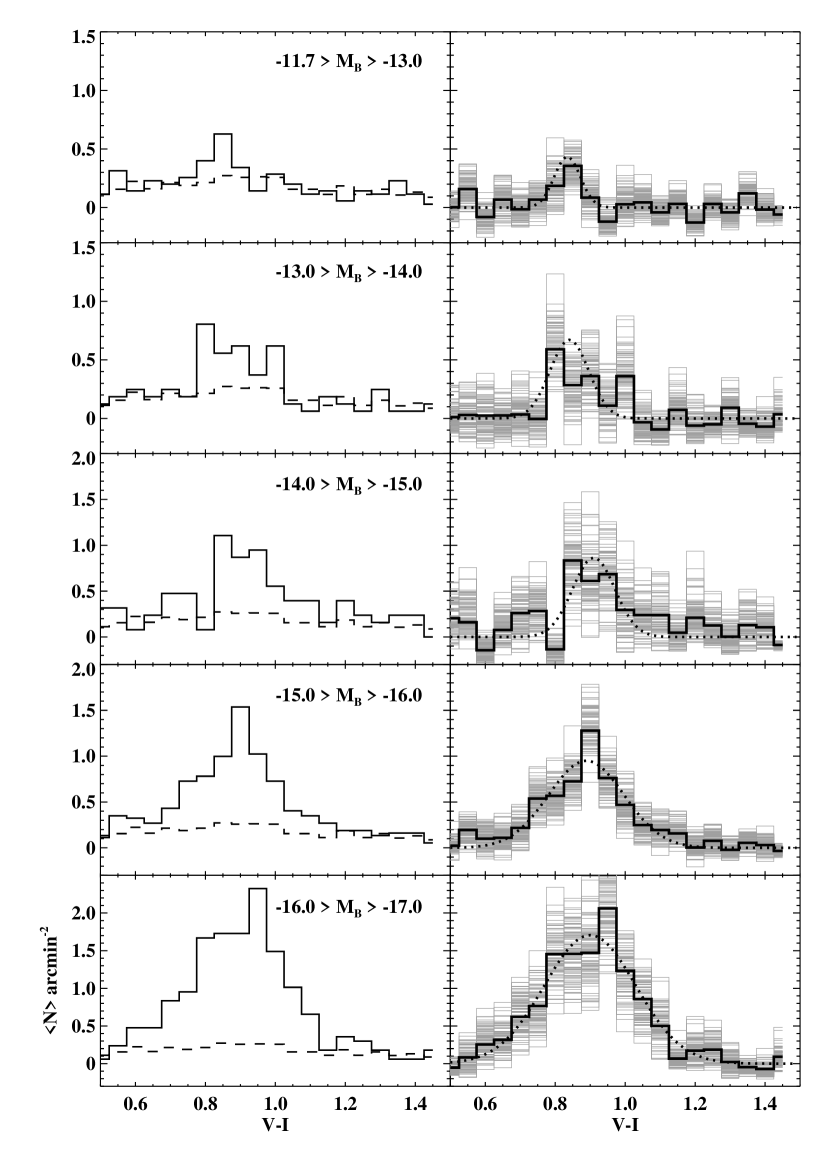
A color histogram is created for all of the GCCs for the dEs within a luminosity range and normalized to the total area of the galaxies sampled (left of Figure 2). Then the color histogram for all background objects (also normalized to the total area of the background detections) is used to correct for the background object color distribution. The resulting background-corrected GCC color histograms are shown in heavy solid lines in the right of Figure 2. Also shown in Figure 2 are the color histograms produced by “bootstrapping” or re-sampling at random the original sample of background objects and dE GCCs 100 times (gray histograms) to illustrate the uncertainty of each derived color distribution. Each bootstrapped distribution contains the same number of background objects and dE GCCs as the original sample, but does not require that each replacement data point be unique.
Most of the dE GCCs are as blue in as the metal-poor globular clusters in the Milky Way and other bright galaxies (Harris 1991; Forbes & Forte 2000; Kundu & Whitmore 2001). We detect very few globular cluster candidates bluer than . This is also consistent with the minimum globular cluster metallicity observed in the Milky Way ([Fe/H] , Laird et al. 1988). Assuming the dE globular cluster candidates are as old as typical Milky Way globular clusters ( 10 Gyr), their color range agree with the metallicity range found for the globular cluster observed in Local Group dwarf spheroidal galaxies (dSphs) and nearby dEs ( [Fe/H]; see Table 5 ).
However, the dE GCC color distributions are not uniform. We find that the GCC color distribution significantly broadens and the mean color becomes slightly redder with increasing dE luminosity (Figure 2). We have randomly re-sampled the original background objects and dE GCCs 10,000 times and fit single Gaussians to the binned and background-corrected color distributions with the IDL routine GAUSSFIT in order to derive peak colors and . In Figure 2, we have plotted the Gaussian fits with the median peak color for the 10,000 bootstrapped color distributions (see also Table 4). This median color distribution has a peak and for the faintest dEs () and a peak and for the brightest dEs (). We find that a linear fit to the observed peak GCC color - dE luminosity trend gives a shallow but significant slope :
| (2) |
with .
In Figure 3, we compare the peak colors to the average colors of the literature dEs (Table 5), giant elliptical galaxy (E) and S0 globular cluster systems (Kundu & Whitmore 2001, Gebhardt & Kissler-Patig 1999; here after KW01 and GKP99). We have converted the literature values for the mean [Fe/H] of the globular cluster systems of five Local Group dE/dSphs, as well as three dEs outside of the Local Group, to a color with the empirical globular cluster - metallicity calibration of Kissler-Patig et al. (1998):
| (3) |
(This conversion implicitly assumes that the globular clusters are relatively old.) The E/S0 globular cluster systems show a great deal of scatter in their mean colors, and the E/S0 sample spans a small range in luminosity, thus there has been some debate in the literature over the existence of a GC color - host galaxy luminosity trend (Harris 1991; Ashman & Zepf 1998; Strader, Brodie & Forbes 2004). However, for all but a few galaxies, the average colors of the E/S0 colors are consistent with the color-luminosity trend observed in dE sample, as are the 8 nearby dE/dSph GCS. Including the colors derived from the literature mean [Fe/H] values for dSph and dE, we find
| (4) |
with . Including the 70 E/S0 colors from GKP99 and KW01 in our linear fit gives a worse but a similar slope for the GC color - -band luminosities:
| (5) |
The globular cluster color distributions are clearly broader for E/S0s than the dEs. In Figure 4, we illustrate the increasing breadth of the color distributions as a function of host galaxy luminosity. In both panels of Figure 4, the dE GCC peak colors are plotted as a function of dE (assuming where is unavailable) and the Gaussian color dispersions given in Table 4 are shown as the error-bars. We have excluded the literature dE/dSph GCS from these plots because of the small numbers of GCs in each system and the uncertainties associated with calculating a robust mean color and dispersion for very small samples (see Strader et al. 2004). In the top panel, we compare our dEs to the fitted color distributions for 43 E/S0 globular cluster systems taken from GKP99. They fit the color distributions with a bi-weight estimate of the location and scale, which correspond to a Gaussian mean and to first order. We have binned the E/S0 GCS by host galaxy luminosity, and plot the mean GKP99 peak values, with error-bars to indicate the mean scale (roughly equivalent to ), along side our dE globular cluster peak colors and (Figure 4) as a function of host galaxy luminosity. While the overwhelming majority of E/S0 globular cluster systems have larger than those observed in the brightest dE, there is no correlation between and E/S0 luminosity.
In the bottom panel of Figure 4, we plot the dE and with the results of bi-modal Gaussian fits to “red” and “blue” globular cluster peaks for 16 E/S0s (Larsen et al. 2001). The fitted peak colors for the E/S0 blue globular clusters are consistent with the extrapolation of the peak GC color- host galaxy luminosity trend observed in our sample of dEs (Equation 2), but are significantly bluer than the correlation derived when the literature dE/dSph cluster systems are included (Equation 4). Strader et al. (2004) also converted the metallicities of 9 dSph/dI globular clusters systems to color using a different relation and found that their colors were consistent with the color-luminosity dependence observed the blue GCs of ellipticals and spirals. While all galaxies possess globular clusters as blue as those in dEs, the brighter galaxies also possess increasing proportions of globular clusters redder than . The broadening in color distribution combined with the increasing number of the reddest globular clusters is what gives rise to the trend observed in Figure 2, rather than a shifting narrow distribution.
3.2 dE field stars
Early work on the Fornax dE population by Caldwell & Bothun (1987) found that dEs followed the vs. color-magnitude relation observed for the Fornax giant ellipticals. However, dEs showed increased scatter in their colors and nucleated dEs were redder than non-nucleated dEs at the same luminosity. The observed color-magnitude slope was consistent with the metallicity-luminosity relation found for Local Group dSph (, Dekel & Silk 1986). Similar E/dE color-magnitude slopes have been subsequently observed in the Fornax (Cellone et al. 1994, Rakos & Schombert 2004), Coma (Secker & Harris 1996), and Perseus Clusters (Conselice et al. 2002), again with increased scatter towards the fainter luminosities. Spectroscopic abundances have confirmed that cluster dEs and Local Group dSphs follow the metallicity-mass correlation of giant ellipticals (Geha et al. 2003; Thomas et al. 2003). However, several more recent studies of the Fornax Cluster dE/dSph populations which probed luminosities as faint as have derived slightly shallower color v. magnitude slopes that imply (Hilker, Mieske, & Infante 2003; Karrick, Drinkwater, & Gregg 2003).
We find that the integrated dE field star populations are redder than their globular clusters by magnitudes (Figure 5). When we examine the nucleated dE and non-nucleated dEs separately, we find evidence for a color-luminosity trend for the nucleated dEs, whereas no such trend is evident for the non-nucleated dEs. A Spearman rank correlation test finds a 99.7 % probability of a color-luminosity correlation for nucleated dE, and a 44.8 % probability of correlation for non-nucleated dE. The entire dE sample gives a 94.6 % probability of a color-luminosity correlation. The derived color-magnitude relations are:
| (6) |
The slope of the color-magnitude relation for the dE,N matches the shallower trends found by Hilker et al. (2003) and Karrick et al. (2003), but is not inconsistent with the slightly steeper slope for cluster ellipticals. When both nucleated and non-nucleated dEs are considered, the color-magnitude relation has a slope more like than found for the globular cluster systems but with a higher zeropoint.
Several groups have claimed evidence for gradients in the color of dE population with distance from the cluster centers (Secker 1996; Rakos et al. 2001), which would imply age or metallicity dependence on cluster position. In Figure 6, we plot galaxy color as a function of projected distance from the (closest) central cluster galaxy (M51 for the Leo Group, NGC1399 for Fornax, and either M87 or NGC4472 for Virgo). We find no obvious correlation between dE stellar halo color and the projected radial distance from the central cluster galaxy for both the Virgo and Fornax cluster dEs (%).
3.3 dE nuclei
We identify the nucleus of each dE,N galaxy as a bright compact object within 1.5 ″ the dE’s isophotal center. All nuclei meet our cluster candidate criterion (implying sizes pc), and are measured via the aperture photometry described in §2.2. We find 6 galaxies with previously unidentified nuclei (FCC46, FCC150, FCC242, FCC246, VCC646, and VCC1577). VCC9 was originally classified as nucleated by Binggeli et al. (1985), but its brightest globular cluster candidate is 1.8 ″ from its center.
The dE nuclei are significantly bluer than their stellar envelopes (top left of Figure 7), contradicting previous ground-based studies (Caldwell & Bothun 1987; Rakos & Schombert 2004). Two dEs possess very blue nuclei with (VCC1714 and FCC46). We find a correlation between nuclear color and dE color (%), where redder nuclei are found in redder and brighter dEs and one of the bluest nuclei lies in a very blue dE (FCC46). Nuclear luminosity is a strong function of the host galaxy’s luminosity, although with a magnitude dispersion not accounted for by the photometric uncertainties (top right of Figure 7).
The nuclei colors are also correlated with host galaxy luminosity at the 99.5% confidence level (bottom left of Figure 7), with a linear fit giving
| (7) |
When the two very blue nuclei are excluded, nuclear color is also found to be correlated with nuclear luminosity at the 99.5% level (bottom right of Figure 7), with a slope as shallow as for the nuclear color- host galaxy luminosity trend (bottom left of Figure 7).
The nuclei are often slightly redder than the dE globular cluster systems (bottom left of Figure 7). Many nuclei are much brighter than typical globular cluster candidates, which have a peak in their luminosity function at (Miller 2003). Because nuclei become redder as they increase in luminosity, we have compared the faint () nuclei colors to those of the dE globular cluster candidates with the same range of absolute magnitudes. We find no color difference between the dE nuclei and globular clusters at fixed nucleus/cluster luminosity, suggesting that the faint nuclei are indistinguishable from bright globular clusters.
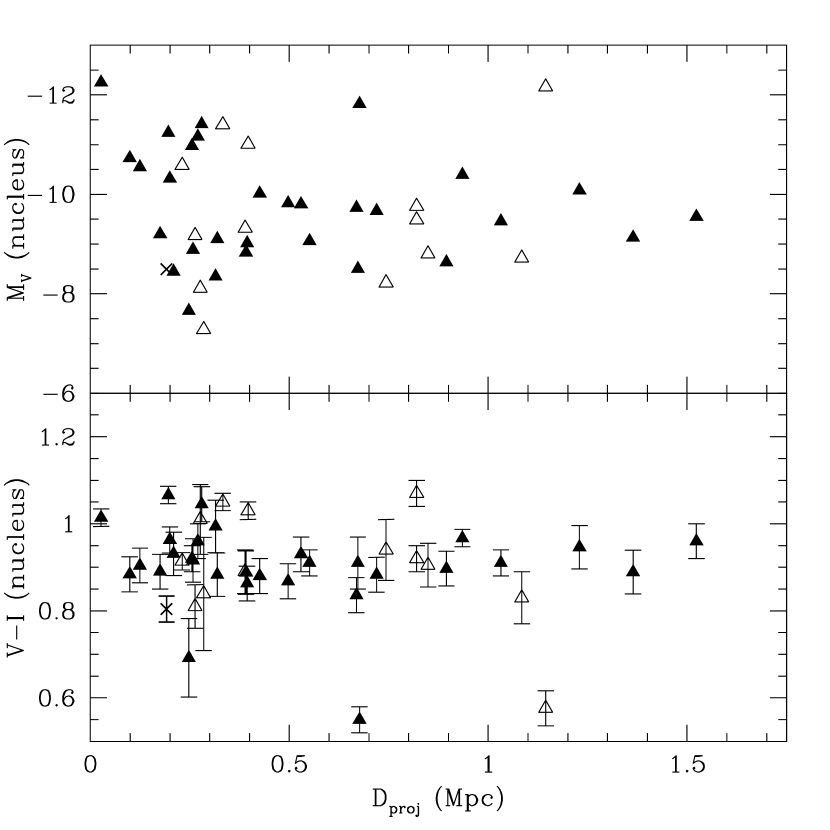
We have also looked for trends in the dE nuclear properties with position in the Virgo and Fornax Clusters. As with the dE stellar envelopes, we fail to find any significant nuclear color or luminosity trends with distance from central cluster galaxy, even when the two very blue nuclei are excluded from the sample (%; Figure 8).
4 DISCUSSION
4.1 Constraints on Ages and Metallicities
The integrated color of a stellar population is primarily a function of the temperature of the stellar population’s red-giant branch, which becomes hotter and bluer with younger ages as well as lower metallicities. Therefore with a single optical color, it is impossible to distinguish between a young, metal-rich stellar population and an old, metal-poor stellar population. Nevertheless, we attempt to place some reasonable constraints on the relative ages and metallicities for the dE stellar populations given the observed and what we know about local dE/dSph systems. Using the Bruzual & Charlot (2003) population synthesis models for a single starburst with a Salpeter stellar initial mass function and the Padova 1994 isochrones, we have plotted the range of possible ages and metallicities for the dE stellar halos () and dE globular clusters () in Figure 9. In these plots, the dashed lines are lines of constant color, and the shaded regions show the range of observed colors and possible ages and metallicities for each dE stellar population. Most of the dE stellar halos have (Figure 6), implying luminosity-weighted ages 2 Gyr and [Fe/H] , consistent with the more precise ages and metallicities of dSph/dEs derived via spectroscopic absorption lines and resolved stellar color magnitude diagrams (Geha et al. 2003; see also Table 5). The bluer colors of the globular clusters (and nuclei) give much weaker constraints, but are consistent with [Fe/H] observed for old dSph GCs (Table 5). The Bruzual & Charlot (2003) tracks for the colors of the GCs in the faintest dEs () imply that these clusters are younger than 8 Gyr. (However, the older Bruzual & Charlot models allow for ages greater than 8 Gyr if [Fe/H] and . Also, several Milky Way globular clusters have integrated , [Fe/H] , and ages Gyr.) The model tracks also require that the two nuclei with are younger than 1 Gyr.
The color offset between the dE stellar halos and their globular cluster systems requires that the bulk of the dE field stars are either significantly more metal-rich or older than their globular clusters. If the dE globular cluster systems were bluer because they were several Gyr younger than the dE field stars, one may expect them to be magnitudes brighter than old Milky Way globular clusters of the same mass and color. However, initial estimates of the composite dE globular cluster luminosity function (GCLF) indicate that its characteristic luminosity is identical to that of the Milky Way (; Miller 2003). Given that Local Group dE/dSph globular clusters systems are more metal-poor than their hosts’ field stars and that the dE GCLF is indistinguishable from that of the Milky Way, we will assume that our sample of dE GCs is dominated by old and metal-poor globular clusters for the rest of this discussion. This implies either separate star-formation epochs for the dE GCs and field stars, or a strong metallicity gradient for dE stars with the destruction of the inner and more metal-rich clusters and the inward migration of the outer, more metal-poor clusters. Most dE nuclei span a similar color range as the dE GCs, and therefore could be coeval with the dE GCs. However, the existence of two very blue nuclei requires that some nuclei are formed in a later star-formation event, after both the dE globular cluster and field star formation epochs. In this section, we discuss the possible formation histories of these three dE sub-populations (clusters, field stars, and nuclei) and the constraints on the evolution of the dEs.
4.2 dE GC formation
The observed correlations between dE GC colors and host dE luminosities is strong evidence that the GCs knew about the gravitational potentials of their host dEs during their formation and were not accreted by the dEs at a later time. This rules out a primordial or pre-galactic origin for the globular clusters in dEs (Peebles & Dicke 1968). If the majority of the dE globular clusters are old and roughly coeval, the observed mean GCS color- host galaxy luminosity relation suggests a mean GCS metallicity - host galaxy luminosity correlation of
| (8) |
assuming the [Fe/H] calibration of Kissler-Patig et al. 1998. The uncertainty in the color-metallicity calibration has been added to the errors in quadrature. If we assume the slighter steeper [Fe/H] calibration for the Galactic globular clusters from Barmby et al. (2000), we find that the exponents for derived GC metallicity - host galaxy relations are 0.04 - 0.06 greater, but agree with those in Eqn. 8 to within the uncertainties. These correlations are significantly shallower than the metallicity-luminosity relation observed for the field star populations of local dwarf galaxies (, Dekel & Silk 1986), and that predicted for GCS by recent SPH hierarchical galaxy evolution models (, Kravtsov & Gnedin 2003).
Assuming the dE GCs are older than 5 Gyr, the observed increasing color dispersion also implies an increasing dispersion in metallicity. The Simple model of galactic chemical evolution is the zeroth order model against which to compare the metallicity (and color) distribution of a stellar population (Tinsley 1975), or, because each globular cluster is a chemically homogeneous population, the metallicity distribution of a system of globular clusters. The Simple model assumes that 1) the galaxy is a “closed box” with no inflow or outflow of gas; 2) the metals are well mixed; 3) the galaxy is initially pure gas with primordial abundances; and 4) the nucleo-synthetic yields of stars are constant for “primary elements” (elements created directly from hydrogen and helium). The metallicity distribution of stars for a Simple model is
| (9) |
where and is the effective chemical yield. In Figure 10, we have fit Simple model metallicity distributions to the color distributions, again assuming the Kissler-Patig et al. (1998) color-metallicity calibration. (Strictly speaking, the Simple model distribution applies only to primary elements which follow the instantaneous recycling approximation, but may be applied to iron (Fe) if we assume the ratio of primary elements to Fe is constant). The background-corrected GC color distributions for the entire sample of dE GCC are well-fit by the Simple model, as are the GCC distributions for dEs brighter than , with effective yields ( ) The Simple model does poorly for fainter dEs (), although the numbers are small.
The comparison of the implied metallicity distributions of the dE globular cluster systems to Simple closed-box chemical evolution models suggests that a significant amount of metals is lost or unavailable for star-formation during the period of globular cluster formation. In closed systems, the effective yield is expected to reach the true chemical yield of supernovae. The low effective yield may be the result of a homogeneous wind, where gas and metals are lost proportionally to the star formation rate (Hartwick 1976). Fainter, less massive dEs would be more likely to experience a terminal wind in which all of the galaxy’s gas is expelled at a particular time (for example, via supernovae “blow-out”; Arimoto & Yoshii 1987), and results in a sharp cutoff at higher cluster metallicities. For such cases where the gas is removed on very short timescales, the steep metallicity-luminosity scaling relation observed for the stellar halos of Local Group dSphs is expected (; Dekel & Silk 1986). We are unable to conclusively determine whether the field star colors of our dEs are more consistent with a and correlation because of the large scatter in the dE color-magnitude relation.
If the implied correlation between globular cluster metallicity and dE host galaxy luminosity is confirmed by more reliable metallicity estimates, and if the metallicity- luminosity relation of the dE field stars is like that of the Local Group dEs/dSphs, then the gas heating mechanism or timescales regulating the chemical evolution of dE globular clusters must be markedly different from that regulating the chemical evolution of dE field stars. We note that for slower adiabatic winds where the gas is removed on timescales comparable to the crossing time of the system, a metallicity - host galaxy luminosity scaling relation similar to that observed for the globular cluster systems is derived (; Dekel & Silk 1986). The GC formation model of Kravtsov & Gnedin (2003), which predicts too strong of a GC metallicity-host galaxy luminosity relationship, produces GCs during and after re-ionization in relatively massive halos (). Smaller halos, however, may be unable to efficiently cool and form the dense molecular clouds needed for GC production after re-ionization and/or the on-set of supernovae-driven winds. GC formation in dwarfs prior to re-ionization would not be subject to the heating effects of a high UV-background, and therefore dwarf halos may initially lose metals more gradually than at later times.
It is impossible to determine from the colors alone if dE globular clusters were formed before or after the epoch of re-ionization. Globular clusters formed before re-ionization at redshifts would be Gyr old, while clusters formed after the inter-galactic UV background had cooled at redshift would be 8 Gyr old. One possible way to distinguish between these two formation epochs is to examine the chemical abundance patterns in dE globular clusters. Globular clusters do not have primordial abundances, therefore at least some stars must have formed and enriched the gas in dEs before the globular clusters were produced. Chemical enrichment of the stellar halo would happen quite quickly, as massive stars have lifetimes less than years. Assuming stars in the early universe evolve with the same timescales and nuclear processes as stars formed at later times (Qian & Wassberburg 2002), stars in dEs formed before the epoch of re-ionization would show enrichment patterns enhanced in elements (relative to the Sun) created by massive, short-lived stars, as there would not be enough time prior to re-ionization for lower mass, primarily iron-producing stars to enrich the interstellar medium. The -element abundance ratios of dE globular clusters are unknown, but spectroscopic observations of a small number of dEs suggest that their field stars are not alpha-element enhanced (Thomas et al. 2003; Geha et al. 2003), and therefore the majority of dE stars did not form prior to re-ionization.
Another possibility is that the dE field stars and globular clusters did not form in separate events, but rather a combination of strong metallicity gradients in the globular cluster populations and the preferential destruction of clusters with higher metallicities has produced the metallicity offset observed today. This might arise naturally if inner, more metal-rich clusters were destroyed via disk-shocking or dynamical decay into the dE centers, while outer, more metal-poor clusters migrated inwards. However, destruction of more metal-rich clusters via dynamical friction would produce dE nuclei with colors more like the dE field stars, which is not observed. Also, there is little evidence for strong metallicity gradients between the inner and outer regions of dE. Most dE show either no color gradients or bluer centers (Stiavelli et al. 2001; Jerjen, Binggeli, & Freeman 2000). Spectroscopic estimates of any abundance gradients in the dE field star populations as well as the -element ratios of dE GCs would help resolve this issue.
4.3 dE Field Star Formation
The colors of the dEs are magnitudes redder than their globular clusters, and therefore the majority of the dE field stars probably did not form in the same event as their globular clusters. The majority of dE stars cannot be the remnants of a disrupted GC population (Fall & Rees 1977), nor were the Virgo and Fornax dE stellar populations formed in a single starburst (e.g. Dekel & Silk 1986). Given the ages and metallicities derived for nearby dSphs/dEs and their GCs, it is most likely that the dE stars are more metal-rich, and possibly several Gyr younger than their GCS. An offset in metallicity suggests that the bulk of dE stars were formed after a period of ISM chemical enrichment, perhaps by the massive stars in the GCs. The initial epoch of globular cluster formation must have input a significant amount of energy into the dwarf’s remaining gas in the form of UV radiation and supernovae-driven winds, as would background UV radiation during the epoch of re-ionization (e.g. Babul & Rees 1992, Efstathiou 1992). While the feedback from young clusters and a strong UV-background could have halted star-formation temporarily, it must not have been enough to completely “blow-away” or “photo-evaporate” the remaining gas, and therefore later generations of stars could have formed in the halo once the gas had cooled sufficiently. The observed solar and sub-solar -element ratios in the dE stellar halos (Geha et al. 2003; Thomas et al. 2003) require field star-formation during or after a period of extended chemical enrichment, implying either a 1 Gyr age difference between the dE field stars and their GCs or a 1 Gyr age spread in the dE field stars. As we discussed above, the difference between the metallicity-host galaxy luminosity relations observed for the dE GCs and field stars suggests that different mechanisms regulated the chemical enrichment during each star-formation episode. Later star-formation events must have been much less efficient at forming massive, tightly bound GCs which could survive to present-day. (Only a few intermediate-age GCs have been found in Local Group dSph; van den Bergh 2000.) The different star-formation regulating mechanisms may have also lowered the star-formation efficiency below that required to create gravitationally-bound clusters (Kroupa et al. 2001).
We find evidence for a marginally significant color-luminosity trend in the dE,N that is not detected in dEs without nuclei. The non-nucleated dEs also have slightly bluer colors. This is suggestive of younger ages for the non-nucleated dE, although spectroscopically derived ages for a larger sample will be needed to confirm this. We find no clear environmental dependence on the dEs and dE,Ns colors (Figure 7). Other authors have found marginal trends for redder colors with larger projected cluster distances with ground-based data (Rakos et al. 2001; Secker 1996). A lack of correlation between dE color and cluster position would rule out the popular “infall” model for the origin of cluster dEs (Moore, Lake, & Katz 1998; Conselice et al. 2003), unless a age-metallicity conspiracy existed in which the dEs in the outskirts of clusters were both younger and more metal-rich than inner dEs.
4.4 dE Nuclei Formation
The nuclei of dEs are significantly bluer than their associated stellar halos, unlike the nuclei and bulges of spirals and giant ellipticals. The nuclei have colors similar to the globular cluster systems and are as compact as the globular cluster candidates. They could possess some of the oldest stars in dEs, formed first in the densest regions of the dwarf halos or from the infall of massive globular clusters into the dE centers via dynamical friction (Lotz et al. 2001, Oh & Lin 2001, Hernandez & Gilmore 1998). Both nuclear formation scenarios are consistent with the correlations of nuclear color and luminosity with host galaxy luminosity. Brighter dEs have deeper central potential wells, and thus would be better able to accrete and retain gas to form brighter and more metal-rich nuclei. Brighter dEs also have redder and larger globular cluster populations from which their nuclei could coalesce.
Two dEs possess very blue nuclei which require ages Gyr, as does NGC 205, a dE satellite of M31 (Jones et al. 1996). If many nuclei are relatively young compared to typical globular clusters, they could trace a third star-formation episode, after both the globular cluster and dE halo formation events. The trend of bluer nuclei in fainter dE hosts might then imply that the nuclei in fainter dEs are typically younger than the nuclei in brighter dEs. However, the two very blue nuclei are in dEs brighter than . Spectroscopic line indices are needed to place stronger constraints on the ages, metallicities, and formation scenarios for the dE nuclei.
We find no significant trends for nuclear color or luminosity with local environment (Figure 8), nor do we find any significant differences between the Virgo and Fornax dE nuclei. This is contrary to the IGM pressure-induced star-formation model of Babul & Rees (1992), which predicts that nuclei formed in the densest regions of the cluster undergo the most intense and rapid starbursts and should be significantly older, more metal-rich and redder than dE nuclei formed in the outskirts of the cluster. This also contradicts the infall model for dE formation, in which nucleated dEs are the stripped remnants of disk galaxies that experience a central starburst upon accretion (Moore, Lake, & Katz 1998). Conversely, the nuclei are typically bluer and fainter than the ultra-compact galaxies observed in the Fornax Cluster with (Karrick et al. 2003). While it seems unlikely that the ultra-compact galaxies have been drawn from the present-day dE,N population, perhaps the ultra-compacts are consistent with a tidally-disrupted population of spirals.
5 SUMMARY
We have examined the HST WFPC2 colors for the globular cluster systems, nuclei, and stellar envelopes of 69 dwarf elliptical galaxies in the Leo Group and Virgo and Fornax Clusters. We find the following:
(1) The mean and dispersion in GC color is a function of host dE luminosity. Assuming the majority of dE GCs are as old as Local Group dSph GCs, the implied metallicity-luminosity relation is , which is significantly shallower than that observed for the field stars of Local Group dSph ().
(2) The and host galaxy luminosities of E/S0s are consistent with the slope computed for our dE sample plus literature values for 8 local dE/dSph GCS. However, the E/S0 GCS color distributions often have a bi-modality not observed in dEs and show no correlation between and galaxy luminosity. The dE GCs are as blue as the metal-poor GC sub-populations observed in the Milky Way and local E/S0s. The blue GC peak color - host galaxy luminosity trend for E/S0 reported by Larsen et al. (2001) is consistent with the slope fit to the peak GC colors for our sample of dEs, but is shallower than the slope fit to our sample and literature dE/dSph GC values.
(3) With the exception of two very blue nuclei, the dE nuclei have colors similar to but slightly redder than the GCs, and show the same correlations with host galaxy luminosity. Their colors are also correlated with host galaxy color, as well as with nuclear luminosity.
(4) We measure the integrated colors for 45 dEs brighter than . The dE field stars are magnitudes redder than their GCs and nuclei, implying a more metal-rich stellar population. The colors of the nucleated dEs are weakly correlated with their luminosity, while the non-nucleated dEs show no significant correlation.
(5) We find no correlation between dE field star color or nuclear color and the dE’s projected distance from the brightest cluster galaxy, nor do we find any significant difference between the colors of the Virgo and Fornax dE stellar populations.
Therefore, we conclude that:
(1) Virgo and Fornax Cluster dEs have probably undergone multiple star-formation episodes. Given the spectroscopic metallicities of Local Group dEs/dSphs, it is most likely that the redder dE field star populations are significantly more metal-rich and possibly younger than their associated GCs. At least two dE nuclei trace a third star-formation event less than 1 Gyr ago, after both the GC and field star formation epochs.
(2) dE GCs must have formed within the gravitational potential wells of proto-dE halos, and were not produced in “pre-galactic” gas clouds.
(3) Assuming dE field star populations follow the same metallicity-luminosity relation as Local Group dEs/dSphs, the mechanisms regulating the chemical evolution of dE GCs are significantly different from that of the dE field stars. We suggest that the majority of dE GCs formed at early times, prior to re-ionization and/or strong feedback from supernovae, and therefore lost metals more gradually than stellar populations formed at later times. Subsequent star-formation events (after re-ionization and/or the onset of supernovae-driven winds) were subject to more rapid metal-loss and are unable to proceed as efficiently as needed to produce significant numbers of GCs.
(4) Cluster dE evolution models which predict strong color gradients with projected cluster radius for stellar envelopes and nuclei are ruled out. This includes both the infall model (Moore, Lake, & Katz 1998) and IGM pressure-induced star-formation scenario (Babul & Rees 1992).
This work is based on observations made by the Hubble Space Telescope GO Programs 6352, 7377, and 8500. We would like to thank R. Wyse and J. Strader for useful discussions, and our anonymous referee for their helpful comments. J.M.L. acknowledges support from NASA, through LTSA grant number NAG5-11513 and NASA grant number 9515 from the Space Telescope Science Institute, which is operated by AURA, under NASA contract NAS 5-26555. B.W.M. is supported by the Gemini Observatory, which is operated by the Association of Universities for Research in Astronomy, Inc., on behalf of the international Gemini partnership of Argentina, Australia, Brazil, Canada, Chile, the United Kingdom, and the United States of America.
References
- (1) Aaronson, M. 1983, ApJ, 266, L11
- (2) Arimoto, N., & Yoshii, Y. 1987, A&A, 173, 23
- (3) Ashman, K.M. & Zepf, S.E. 1998, Globular Cluster Systems (Cambridge, U.K.: Cambridge University Press)
- (4) Babul, A. & Rees, M. 1992, MNRAS, 255, 346
- (5) Barmby, P., Huchra, J.P., Brodie, J.P., Forbes, D.A., Schroder, L.L., & Grillmair, C.J. 2000, AJ, 119, 727
- (6) Beasley, M.A., Kawata, D., Pearce, F.R., Forbes, D. & Gibson, B.K. 2003, ApJ, 596L, 187
- (7) Bertin, E., & Arnouts, S. 1996, A&AS,. 117, 393
- (8) Binggeli, B. & Cameron, L.M. 1991, A&A, 252, 27
- (9) Binggeli, B., Sandage, A., & Tammann, G.A. 1985, AJ, 90, 1681
- (10) Brodie, J.P., & Huchra, J. 1990, ApJ, 362, 503
- (11) Bromm, V., & Clarke, C.J. 2002, ApJ, 566, L1
- (12) Bruzual, G., & Charlot, S. 2003, MNRAS, 344, 1000
- (13) Buonanno, R., Corsi, C.E., Castellani, M., Marconi, G., Fusi Pecci, F., & Zinn, R. 1999, AJ, 118, 1671
- (14) Bullock, J.S., Kravtsov, A.V., & Weinberg, D.H. 2000, ApJ, 539, 517
- (15) Burgarella, D., Kissler-Patig, M., & Buat, V. 2001, AJ, 121, 2647
- (16) Caldwell, N., & Bothun, G.D. 1987, AJ, 94, 1126
- (17) Carigi, L., Hernandez, X. & Gilmore, G. 2002, MNRAS, 334, 117
- (18) Cellone, S.A., Forte, J.C., & Geisler, D. 1994, ApJS, 93, 397
- (19) Conselice, C.J.,Gallagher, J.S., & Wyse, R.F.G. 2002, AJ, 123
- (20) Conselice, C.J., Gallagher, J.S., & Wyse, R.F.G. 2003, ApJ, 125, 66
- (21) Côté, P, Marzke, R. O., West, M. J. 1998, ApJ, 501, 554
- (22) Da Costa, G.S., & Mould, J.R. 1988, ApJ, 334, 159
- (23) Dekel, A., & Woo, J. 2003, MNRAS, 344, 1131
- (24) Dekel, A. & Silk, J. 1986, ApJ, 303, 39
- (25) Dong, S., & Murray, S.D., Lin, D.C. 2003, ApJ, 596, 930
- (26) Drinkwater, M. J., Jones, J. B., Gregg, M. D., & Phillipps, S. 2000, PASA, 17, 227
- (27) Durrell, P.R., McLaughlin, D. E., Harris, W. E., & Hanes, D. A. 1996a, ApJ, 463, 543
- (28) Durrell, P. R., Harris, W.E., Geisler, D., & Pudritz, R.E. 1996b, AJ, 112, 972
- (29) Efstathiou, G. 1992, MNRAS, 256, 43
- (30) Fall, S.M. & Rees, M.J. 1977, MNRAS, 181, 37
- (31) Ferguson, H.C., & Sandage, A. 1989, ApJ, 346, L53
- (32) Ferguson, H.C., & Sandage, A. 1990, AJ, 100, 1
- (33) Forbes, D. & Forte J. 2001, MNRAS, 322, 257
- (34) Freedman, W.L. et al. 2001, ApJ, 553, 47
- (35) Gebhardt, K. & Kissler-Patig, M. 1999, AJ, 118, 1526
- (36) Geha, M., P. Guhathakurta, & R.P. van der Marel 2002, AJ, 124, 3073
- (37) Geha, M., P. Guhathakurta, & R.P. van der Marel 2003, AJ, 126, 1794
- (38) Geisler, D., Armandroff, T., Da Costa, G., Lee, M.G., & Sarajedini, A. 1999, in The Stellar Content of Local Group Galaxies, p. 231
- (39) Grebel, E. 1997, Rev. Mod. Astron., 10, 29
- (40) Han, M., Hoessel, J.G., Gallagher, J.S., Holtzman, J., & Stetson, P.B. 1997, AJ, 113, 1001
- (41) Harris, W. 1991, ARA&A, 29, 543
- (42) Hartwick, F.D.A. 1976, ApJ, 209, 418
- (43) Held, E.V., & Mould, J. 1994, AJ, 107, 1307
- (44) Hernandez, X., & Gilmore, G. 1998, MNRAS, 297, 517
- (45) Hilker, M., Mieske, S. & Infante, L. 2003, A&A, 397, L9
- (46) Ho, L., Filippenko, A.V., & Sargent, W.L. 1995, ApJS, 98, 477
- (47) Holtzman, J. A., Burrows, C. J., Casertano, S., Hester, J. J., Trauger, J. T., Watson, A. M., & Worthey, G. 1995, PASP, 107, 1065
- (48) Jerjen, H., Binggeli, B. & Freeman, K.C. 2000, AJ, 119
- (49) Jones, H., et al., 1996, ApJ, 466, 742
- (50) Karrick, A.M., Drinkwater, M.J., & Gregg, M.D. 2003, MNRAS, 344, 188
- (51) Kauffmann, G., White, S.D.M., & Guiderdoni, B. 1993, MNRAS, 264, 201
- (52) Kissler-Patig, M., Brodie, J.P., Schroder, L.L., Forbes, D.A., Grillmair, C.J., & Huchra, J.P. 1998, AJ, 115, 105
- (53) Kormendy, J. 1985, ApJ, 295, 73
- (54) Kravtsov, A.V., & Gnedin, O.Y. 2003, astroph/0305199
- (55) Kravtsov, A.V., Gnedin, O.Y., & Klypin, A.A., 2004, astroph/0401088
- (56) Kroupa, P., Aaresht, S., & Hurley, J. 2001, MNRAS, 321, 699
- (57) Kundu, A., & Whitmore, B.C. 2001, AJ, 121, 2950
- (58) Laird, J.B., Rupen, M., Carney, B., & Latham, D.W. 1988, AJ, 96, 1908
- (59) Larsen, S.S., Brodie, J., Huchra, J.P., Forbes, D.A., & Grillmair, C. 2001, AJ, 121, 2974
- (60) Lin, D.N.C. & Faber, S.M. 1983, ApJ, 266, 21
- (61) Lotz, J., Telford, R., Ferguson, H. C., Miller, B. W., Stiavelli, M., & Mack, J. 2001, ApJ, 552, 572
- (62) Martinez-Delgrado, D., & Aparicio, A., 1998, AJ, 115, 1462
- (63) Mateo, M. 1998 ARA&A, 36, 435
- (64) Miller, B.W. 2003, Extragalactic Globular Cluster Systems, 199
- (65) Miller, B.W., Lotz, J.M., Ferguson, H.C., Stiavelli, M., & Whitmore, B.C. 1998, ApJ, 508, L133
- (66) Miller, B.W., Whitmore, B. C., Schweizer, F., & Fall, S. M. 1997, AJ, 114, 2381
- (67) Monaco, L., Ferraro, F.R., Bellazzini, M., & Pancino, E. 2002, ApJ, 578, 47
- (68) Moore, B. 1996, ApJ, 461, 13
- (69) Moore, B., Lake, G., & Katz, N. 1998, ApJ, 495, 139
- (70) Montegriffo, P., Bellazzini, M., Ferraro, F.R., Martins, D., Sarajedini, A., & Fusi Pecci, F. 1998, MNRAS, 294, 315
- (71) Mould, J., Kristian, J., & Da Costa, G.S. 1984, ApJ, 278, 575
- (72) Neilsen, E. & Tsventanov, Z. 2000, ApJ, 536, 255
- (73) Oh, K.S., & Lin, D.N.C. 2000, ApJ, 543, 620
- (74) Peebles, P. J. E., & Dicke, R. H. 1968, ApJ, 154, 891
- (75) Pont, F., Zinn, R., Gallart, C., Hardy, E., & Winnick, R. 2004, AJ, 127, 840
- (76) Pryor, C., McClure, R.D., Fletcher, J.M, & Hesser, J.E. 1989, AJ, 98, 596
- (77) Puzia, T.H., Kissler-Patig, M., Brodie, J., & Schroder, L. 2000, A&A, 120, 1160
- (78) Qian, Y.-Z., & Wasserburg, Y. 2002, ApJ, 567, 515
- (79) Rakos, K., Schombert, J., Maitzen H.M., Prugovecki, S., & Odell, A. 2001, AJ, 121, 1974
- (80) Rakos, K., & Schombert, J., 2004, AJ, 127, 1502
- (81) Reaves, G. 1983, ApJS, 53, 375
- (82) Sarajedini, A., & Layden, A.C 1995, AJ, 109, 1086
- (83) Searle, L., & Zinn, R. 1978, ApJ, 225, 357
- (84) Secker, J. 1996, ApJ, 469L, 81
- (85) Secker, J., & Harris, W.E. 1996, ApJ, 469, 623
- (86) Schlegel, D. J., Finkbeiner, D. P., & Davis, M. 1998, ApJ, 500, 525
- (87) Smecker-Hane, T.A., Stetson, P., Hesser, J.E., & Lehnert, M.D. 1994, AJ, 108, 507
- (88) Stiavelli, M., Miller, B. W., Ferguson, H. C., Mack, J., Whitmore, B. C., & Lotz, J. M.2001, AJ, 121, 1385
- (89) Strader, J., Brodie, J.P., Forbes, D.A., Beasley, M.A., & Huchra, J.P. 2003, AJ, 125, 1291
- (90) Strader, J., Brodie, J.P., & Forbes, D.A. 2004, astro-ph/0403160
- (91) Thomas, D., Bender, R., Hopp, U., Maraston, C., & Greggio, L. 2003, Ap&SS,. 284, 599
- (92) Tinsley, B.M. 1975, ApJ, 159, 162
- (93) Tully, R.B., Sommerville, R.S., Trentham, N., & Verheijen, M.A. 2002, ApJ, 569, 573
- (94) van den Bergh, S. 2000, ApJ, 530, 777
- (95) Whitmore, B.C. & Heyer, I 1995, in Calibrating Hubble Space Telescope. Post Servicing Mission. eds. A. Koratkar, & C. Leitherer, Baltimore, Maryland: Space Telescope Science Institute, p. 305
- (96)
| Galaxy11FCC = Fornax Cluster Catalog, Ferguson 1989; VCC = Virgo Cluster Catalog, Binggeli, Sandage & Tammann 1985; LGC = Leo Group Catalog, Ferguson & Sandage 1990; apparent B magnitude and morphological types taken from these catalogs. | IDs22NG = New Galaxy, IC = Index Catalog, UGC = Uppsala General Catalog of Galaxies, NGC= New General Catalog, R = Reaves 1983, DDO = David Dunlop Observatory Catalogue of Low Surface Brightness Galaxies | 11FCC = Fornax Cluster Catalog, Ferguson 1989; VCC = Virgo Cluster Catalog, Binggeli, Sandage & Tammann 1985; LGC = Leo Group Catalog, Ferguson & Sandage 1990; apparent B magnitude and morphological types taken from these catalogs. | 33Absolute B magnitudes calculated assuming = 30.0 for Leo Group, 30.92 for Virgo Cluster, and 31.39 for the Fornax Cluster (Freedman et al. 2001). The values have not been corrected for foreground extinction. | Type11FCC = Fornax Cluster Catalog, Ferguson 1989; VCC = Virgo Cluster Catalog, Binggeli, Sandage & Tammann 1985; LGC = Leo Group Catalog, Ferguson & Sandage 1990; apparent B magnitude and morphological types taken from these catalogs. | RA(J2000) | DEC(J2000) | 44 The Schlegel et al. 1998 values for foreground Galactic extinction, taken from the NASA/IPAC Extragalactic Database (NED), which is operated by the Jet Propulsion Laboratory, California Institute of Technology, under contract with the National Aeronautics and Space Administration. | 44 The Schlegel et al. 1998 values for foreground Galactic extinction, taken from the NASA/IPAC Extragalactic Database (NED), which is operated by the Jet Propulsion Laboratory, California Institute of Technology, under contract with the National Aeronautics and Space Administration. |
|---|---|---|---|---|---|---|---|---|
| LGC47 | UGC05944 | 15.2 | dE | 10:50:18 | 13:16:19 | 0.093 | 0.039 | |
| LGC50 | 17.0 | dEN | 10:51:01 | 13:20:02 | 0.093 | 0.039 | ||
| FCC25 | NG31 | 17.7 | dE0N | 3:23:33 | 36:58:57 | 0.069 | 0.029 | |
| FCC27 | 19.3 | dE2 | 3:23:56 | 34:12:29 | 0.035 | 0.014 | ||
| FCC46 | 15.6 | dE4 | 3:26:25 | 37.53:20 | 0.061 | 0.025 | ||
| FCC48 | NG61 | 17.1 | dE3 | 3:26:42 | 34:28:04 | 0.036 | 0.015 | |
| FCC59 | 19.4 | dE0N | 3:27:47 | 33:27:10 | 0.043 | 0.018 | ||
| FCC64 | 17.5 | dE5 | 3:38:00 | 38:28:47 | 0.061 | 0.025 | ||
| FCC110 | NG26, ESO358-G14 | 16.8 | dE4 | 3:32:57 | 35:16:44 | 0.050 | 0.021 | |
| FCC136 | NG24 | 14.8 | dE2N | 3:34:29 | 35:28:11 | 0.053 | 0.022 | |
| FCC144 | 19.2 | dE0 | 3:35:00 | 35:41:39 | 0.047 | 0.020 | ||
| FCC146 | 19.5 | dE4N | 3:35:31 | 35:41:37 | 0.049 | 0.021 | ||
| FCC150 | 15.7 | dE4 | 3:35:24 | 36:39:10 | 0.046 | 0.019 | ||
| FCC174 | 16.7 | dE1N | 3:36:45 | 33:00:10 | 0.026 | 0.011 | ||
| FCC189 | 18.8 | dE4N | 3:37:08 | 34:17:08 | 0.046 | 0.019 | ||
| FCC212 | NG119 | 17.6 | dE1? | 3:38:21 | 36:36:12 | 0.036 | 0.015 | |
| FCC218 | NG72 | 18.5 | dE4 | 3:38:45 | 35:41:31 | 0.041 | 0.017 | |
| FCC238 | NG109 | 18.7 | dE5N | 3:40:17 | 36:28:54 | 0.031 | 0.013 | |
| FCC242 | NG51 | 17.8 | dE5 | 3:40:20 | 37:22:21 | 0.047 | 0.020 | |
| FCC246 | 19.1 | dE2 | 3:40:37 | 36:53:43 | 0.038 | 0.016 | ||
| FCC254 | NG22 | 17.6 | dE0N | 3:41:00 | 35:16:26 | 0.034 | 0.014 | |
| FCC304 | 18.8 | dE1 | 3:45:30 | 34:30:39 | 0.023 | 0.010 | ||
| FCC316 | NG12 | 16.7 | dE1N | 3:36:45 | 33:00:10 | 0.036 | 0.015 | |
| FCC324 | ESO358-G66 | 15.3 | dS01(8) | 3:47:52 | 36:32:41 | 0.032 | 0.013 | |
| VCC9 | IC3019, UGC07136 | 13.9 | dE1N | 12:09:22 | 13:59:34 | 0.128 | 0.053 | |
| VCC118 | R92 | 15.6 | dE3 | 12:14:36 | 9:41:20 | 0.053 | 0.022 | |
| VCC128 | UGCA275, R903 | 15.6 | dE0 | 12:14:59 | 9:33:54 | 0.051 | 0.022 | |
| VCC158 | UGC07269, R1513 | 15.8 | dE3N | 12:15:40 | 15:00:18 | 0.131 | 0.055 | |
| VCC240 | R1419 | 18.2 | dE2N | 12:17:31 | 14:21:21 | 0.108 | 0.045 | |
| VCC452 | R1223 | 15.8 | dE4N | 12:21:04 | 11:45:18 | 0.093 | 0.039 | |
| VCC503 | R817 | 16.8 | dE3N | 12:21:50 | 8:32:31 | 0.062 | 0.026 | |
| VCC529 | R1015 | 18.2 | dE4N | 12:22:08 | 9:53:41 | 0.079 | 0.033 | |
| VCC543 | UGC07436 | 14.8 | dE5 | 12:22:19 | 14:45:38 | 0.105 | 0.045 | |
| VCC546 | R1017 | 15.7 | dE6 | 12:22:21 | 10:36:06 | 0.121 | 0.050 | |
| VCC646 | 18.8 | dE3 | 12:23:31 | 17:47:42 | 0.099 | 0.041 | ||
| VCC747 | R924 | 16.2 | dE0N | 12:24:47 | 8:59:21 | 0.072 | 0.030 | |
| VCC871 | R1240 | 15.4 | dE4N | 12:26:05 | 12:33:33 | 0.109 | 0.045 | |
| VCC896 | R1352 | 17.8 | dE3N | 12:26:22 | 12:47:03 | 0.096 | 0.040 | |
| VCC917 | IC3344 | 14.9 | dE6 | 12:26:32 | 13:34:44 | 0.107 | 0.045 | |
| VCC940 | IC3349, R1243 | 14.8 | dE1N | 12:26:47 | 12:27:12 | 0.101 | 0.042 | |
| VCC949 | R1027 | 15.1 | dE4N | 12:26:54 | 10:39:56 | 0.102 | 0.042 | |
| VCC965 | IC3363, R1245 | 15.4 | dE7N | 12:27:03 | 12:33:37 | 0.100 | 0.042 | |
| VCC992 | R827 | 15.8 | dE0N | 12:27:18 | 8:12:45 | 0.075 | 0.031 | |
| VCC996 | R1360 | 18.4 | dE5 | 12:27:21 | 13:06:41 | 0.100 | 0.041 | |
| VCC1073 | IC794, UGC07585 | 14.2 | dE3N | 12:28:08 | 12:05:34 | 0.091 | 0.038 | |
| VCC1077 | 19.2 | dE0N | 12:28:09 | 12:48:23 | 0.078 | 0.032 | ||
| VCC1105 | R1440 | 16.2 | dE0N | 12:28:27 | 14:09:15 | 0.146 | 0.061 | |
| VCC1107 | NGC4472 DW01, R731 | 15.1 | dE4N | 12:28:30 | 7:19:28 | 0.069 | 0.029 | |
| VCC1252 | 18.8 | dE0N | 12:30:01 | 9:28:24 | 0.066 | 0.028 | ||
| VCC1254 | NGC4472 DW08, R834 | 15.0 | dE0N | 12:30:05 | 8:04:22 | 0.074 | 0.031 | |
| VCC1272 | 18.5 | dE1N | 12:30:15 | 13:18:28 | 0.088 | 0.036 | ||
| VCC1308 | IC3437 | 15.1 | dE6N | 12:30:46 | 11:20:33 | 0.116 | 0.048 | |
| VCC1311 | NGC4472 DW03, R737 | 15.6 | dE1N | 12:30:47 | 7:36:18 | 0.063 | 0.026 | |
| VCC1363 | 19.0 | dE3N | 12:31:27 | 10:56:07 | 0.107 | 0.044 | ||
| VCC1386 | IC3457, UGC3457, R1264 | 14.4 | dE3N | 12:31:51 | 12:39:42 | 0.084 | 0.035 | |
| VCC1497 | UGC07707 | 15.7 | dE4N | 12:33:18 | 17:27:35 | 0.086 | 0.036 | |
| VCC1514 | 15.1 | dE7N | 12:33:37 | 7:52:14 | 0.064 | 0.026 | ||
| VCC1530 | 18.3 | dE2N | 12:33:55 | 5:43:07 | 0.075 | 0.031 | ||
| VCC1577 | IC3519, R1555 | 15.8 | dE4 | 12:34:38 | 15:36:10 | 0.093 | 0.038 | |
| VCC1651 | R640 | 17.0 | dE5 | 12:36:07 | 6:03:10 | 0.063 | 0.026 | |
| VCC1714 | R1461 | 18.5 | dE4N | 12:37:25 | 14:18:46 | 0.097 | 0.040 | |
| VCC1729 | 17.8 | dE5? | 12:37:46 | 10:59:07 | 0.077 | 0.032 | ||
| VCC1762 | R1055 | 16.2 | dE6 | 12:38:32 | 10:22:37 | 0.072 | 0.030 | |
| VCC1781 | R842 | 18.7 | dE4 | 12:39:11 | 8:04:17 | 0.087 | 0.036 | |
| VCC1876 | IC3658, R1465 | 14.9 | dE5N | 12:41:20 | 14:42:03 | 0.103 | 0.043 | |
| VCC1877 | R844 | 18.6 | dE2 | 12:41:23 | 8:22:00 | 0.093 | 0.038 | |
| VCC1948 | R1062 | 15.1 | dE3 | 12:42:58 | 10:40:54 | 0.080 | 0.033 | |
| VCC2008 | IC3720, DDO145 | 15.1 | dE5 | 12:44:46 | 12:03:57 | 0.090 | 0.037 | |
| VCC2029 | R964 | 18.2 | dE3 | 12:45:40 | 9:24:25 | 0.082 | 0.034 |
| Galaxy | 11From Stiavelli et al. 2001 | (″) | (kpc) | (nucleus) | (nucleus) | 22Corrected for background contamination | |||
|---|---|---|---|---|---|---|---|---|---|
| VCC1073 | 13.89 0.11 | 1.15 0.03 | 0.30 | 8.6 0.5 | 636.6 | 0.01 | 1.07 0.02 | 16.7 5.8 | |
| FCC136 | 14.32 0.18 | 1.12 0.03 | 0.20 | 8.4 1.3 | 641.9 | 0.01 | 1.05 0.02 | 18.0 5.3 | |
| VCC1386 | 1.06 0.03 | 0.30 | 12.7 0.1 | 945.3 | 0.04 | 0.88 0.04 | 22.7 6.1 | ||
| VCC940 | 1.08 0.03 | 0.16 | 10.8 0.2 | 799.9 | 0.04 | 0.96 0.04 | 52.4 8.1 | ||
| FCC324 | 14.95 0.10 | 1.10 0.03 | 0.63 | 13.9 0.3 | 1283.9 | 0.05 | 0.91 0.05 | 9.0 4.6 | |
| VCC1876 | 14.39 0.18 | 1.04 0.03 | 0.49 | 10.5 0.3 | 780.6 | 0.03 | 0.97 0.02 | 22.1 6.3 | |
| VCC1254 | 14.82 0.13 | 1.16 0.03 | 0.03 | 7.7 0.2 | 568.4 | 0.02 | 1.01 0.02 | 20.5 8.0 | |
| VCC949 | 1.11 0.03 | 0.30 | 10.7 0.3 | 793.2 | 0.04 | 0.93 0.04 | 21.6 5.5 | ||
| VCC1308 | 1.05 0.03 | 0.30 | 6.0 0.4 | 443.7 | 0.04 | 1.05 0.04 | 19.7 5.9 | ||
| VCC1514 | 1.00 0.03 | 0.67 | 12.6 0.3 | 932.0 | 0.04 | 0.92 0.05 | 7.0 4.4 | ||
| VCC1107 | 1.12 0.05 | 0.33 | 11.8 0.3 | 871.8 | 0.04 | 0.96 0.03 | 1.8 2.5 | ||
| FCC46 | 0.88 0.03 | 0.38 | 5.3 0.7 | 489.0 | 0.03 | 0.58 0.04 | 8.0 4.2 | ||
| FCC150 | 15.13 0.10 | 1.05 0.03 | 0.15 | 5.5 0.3 | 502.9 | 0.02 | 1.03 0.02 | 8.0 4.2 | |
| VCC871 | 1.05 0.03 | 0.33 | 10.8 0.2 | 785.8 | 0.03 | 0.88 0.05 | 15.6 4.9 | ||
| VCC965 | 1.02 0.03 | 0.49 | 13.4 0.3 | 990.6 | 0.04 | 0.92 0.03 | 13.2 4.6 | ||
| VCC1311 | 1.03 0.03 | 0.08 | 9.6 0.3 | 713.8 | 0.03 | 0.90 0.04 | 15.7 4.7 | ||
| VCC1497 | 1.04 0.03 | 0.47 | 12.7 0.5 | 945.3 | 0.05 | 0.89 0.05 | 5.0 4.6 | ||
| VCC158 | 1.14 0.03 | 0.33 | 12.5 0.3 | 929.0 | 0.05 | 0.95 0.05 | 3.0 4.1 | ||
| VCC452 | 15.36 0.11 | 1.06 0.03 | 0.22 | 7.8 0.4 | 579.5 | 0.04 | 0.91 0.06 | 15.5 5.3 | |
| VCC992 | 1.04 0.06 | 0.08 | 7.8 0.3 | 580.2 | 0.04 | 0.89 0.04 | 12.5 5.0 | ||
| VCC1577 | 15.17 0.31 | 1.04 0.03 | 0.24 | 7.1 0.4 | 523.9 | 0.05 | 0.90 0.04 | 8.9 4.6 | |
| FCC174 | 16.16 0.1 | 0.97 0.08 | 0.17 | 4.9 0.5 | 454.1 | 0.02 | 0.92 0.03 | 4.1 3.4 | |
| FCC316 | 16.17 0.1 | 1.06 0.03 | 0.30 | 8.2 0.3 | 750.6 | 0.02 | 1.07 0.03 | 8.0 3.7 | |
| VCC1105 | 0.93 0.17 | 0.14 | 10.3 0.5 | 761.3 | 0.04 | 0.87 0.04 | 14.0 4.9 | ||
| VCC747 | 0.20 | 10.1 0.7 | 747.2 | 0.03 | 0.88 0.04 | 17.0 5.6 | |||
| VCC503 | 16.83 0.10 | 1.02 0.15 | 0.06 | 6.3 0.4 | 468.2 | 0.03 | 0.91 0.03 | 2.5 3.7 | |
| FCC254 | 16.71 0.21 | 1.07 0.10 | 0.16 | 10.5 0.5 | 967.1 | 0.01 | 0.91 0.02 | 4.5 4.2 | |
| FCC25 | 0.25 | 6.1 0.3 | 564.6 | 0.03 | 0.90 0.04 | 2.5 3.7 | |||
| FCC242 | 0.43 | 9.3 0.6 | 852.8 | 0.05 | 0.94 0.07 | 0.0 2.7 | |||
| LGC50 | 16.04 0.21 | 1.03 0.03 | 0.36 | 10.2 0.4 | 494.2 | 0.02 | 0.80 0.03 | 7.2 3.8 | |
| VCC896 | 0.98 0.15 | 0.38 | 8.8 0.6 | 655.9 | 0.04 | 0.99 0.06 | 4.5 3.9 | ||
| VCC529 | 0.43 | 6.6 0.5 | 489.7 | 0.03 | 0.88 0.04 | 2.0 2.0 | |||
| FCC238 | 0.34 | 7.0 0.7 | 644.7 | 0.03 | 0.89 0.05 | 7.2 4.1 | |||
| VCC240 | 16.34 0.70 | 0.98 0.10 | 0.35 | 9.5 1.0 | 705.6 | 0.02 | 0.91 0.03 | 3.5 3.5 | |
| FCC189 | 0.26 | 2.4 0.3 | 222.0 | 0.03 | 0.81 0.05 | 6.5 4.2 | |||
| VCC1530 | 0.15 | 5.9 0.3 | 440.7 | 0.03 | 0.84 0.04 | 0.5 3.4 | |||
| VCC1714 | 0.39 | 12.0 0.8 | 893.4 | 0.02 | 0.55 0.03 | 2.5 3.4 | |||
| VCC1272 | 0.40 | 4.2 0.4 | 308.7 | 0.05 | 0.69 0.09 | 0.0 3.8 | |||
| FCC246 | 0.38 | 6.6 0.7 | 609.7 | 0.09 | 0.84 0.13 | 0.0 2.7 | |||
| VCC646 | 0.23 | 5.6 0.2 | 414.1 | 0.03 | 0.96 0.04 | 6.5 4.2 | |||
| VCC1252 | 0.05 | 4.7 0.5 | 345.0 | 0.03 | 0.86 0.04 | 4.5 3.9 | |||
| FCC59 | 0.38 | 11.0 2.2 | 1016.8 | 0.04 | 0.83 0.06 | 0.0 3.2 | |||
| VCC1363 | 0.35 | 3.7 0.2 | 271.6 | 0.03 | 0.89 0.05 | 0.5 2.7 | |||
| FCC146 | 0.49 | 3.3 0.4 | 304.9 | 0.05 | 1.01 0.08 | 0.0 2.6 | |||
| VCC1077 | 0.18 | 3.7 0.3 | 242.6 | 0.04 | 0.93 0.05 | 1.5 4.5 |
| Galaxy | 11From Stiavelli et al. 2001 | (″) | (kpc) | 22Corrected for background contamination. | |||
|---|---|---|---|---|---|---|---|
| VCC9 | 13.21 0.10 | 1.00 0.03 | 0.16 | 18.3 0.6 | 1358.6 | 23.9 6.9 | |
| VCC543 | 1.07 0.03 | 0.46 | 8.5 0.7 | 630.0 | 13.0 4.4 | ||
| VCC917 | 14.76 0.10 | 1.01 0.03 | 0.46 | 6.0 0.2 | 443.0 | 6.0 5.1 | |
| VCC1948 | 0.99 0.03 | 0.28 | 7.3 0.1 | 540.9 | 6.5 3.7 | ||
| VCC2008 | 1.00 0.03 | 0.71 | 36.8 0.9 | 2729.1 | 7.5 5.1 | ||
| VCC118 | 15.55 0.15 | 0.94 0.03 | 0.22 | 8.0 0.6 | 592.2 | 3.0 3.6 | |
| VCC128 | 1.10 0.05 | 0.09 | 12.1 0.6 | 898.6 | 11.1 4.4 | ||
| VCC546 | 0.91 0.03 | 0.61 | 10.6 0.4 | 785.8 | 4.8 3.3 | ||
| LGC47 | 14.57 0.10 | 1.02 0.03 | 0.13 | 12.9 0.6 | 623.2 | 2.9 4.4 | |
| VCC1762 | 15.81 0.20 | 0.97 0.03 | 0.53 | 6.9 0.2 | 504.6 | 4.0 3.5 | |
| FCC110 | 16.49 0.10 | 1.14 0.03 | 0.40 | 10.8 0.4 | 994.7 | 0.0 4.2 | |
| FCC48 | 16.55 0.13 | 1.00 0.03 | 0.45 | 6.9 0.4 | 631.8 | 7.0 4.4 | |
| FCC64 | 17.09 0.10 | 1.12 0.03 | 0.25 | 8.3 0.7 | 767.2 | 0.0 2.9 | |
| VCC1651 | 16.08 0.29 | 1.11 0.11 | 0.44 | 19.2 1.1 | 1424.6 | 4.2 5.3 | |
| FCC212 | 0.36 | 15.1 0.8 | 1388.9 | 5.5 5.3 | |||
| VCC1729 | 0.98 0.03 | 0.47 | 6.3 0.4 | 466.0 | 1.0 3.0 | ||
| FCC218 | 0.31 | 5.6 0.5 | 513.9 | 0.0 2.7 | |||
| VCC2029 | 16.98 0.28 | 1.00 0.03 | 0.32 | 5.0 0.3 | 463.3 | 1.0 3.6 | |
| FCC304 | 0.15 | 7.2 0.9 | 660.4 | 0.0 3.1 | |||
| VCC996 | 0.33 | 7.0 0.4 | 517.9 | 0.0 3.7 | |||
| VCC1877 | 0.43 | 7.4 0.2 | 546.9 | 3.0 3.3 | |||
| VCC1781 | 0.32 | 5.6 0.4 | 417.7 | 2.5 3.4 | |||
| FCC144 | 0.19 | 3.7 0.4 | 337.1 | 0.5 3.4 | |||
| FCC27 | 0.26 | 3.6 0.5 | 334.3 | 0.5 3.1 |
| Magnitude Bin | Ngalaxy | NGC | 11Median Gaussian fit and standard deviation of fitted parameter for 10,000 bootstrap realizations of background-corrected GC color distributions. | 11Median Gaussian fit and standard deviation of fitted parameter for 10,000 bootstrap realizations of background-corrected GC color distributions. | |
|---|---|---|---|---|---|
| 22 | 28 16 | 0.83 0.02 | 0.03 0.01 | ||
| 9 | 29 12 | 0.84 0.05 | 0.04 0.03 | ||
| 8 | 54 10 | 0.91 0.03 | 0.07 0.05 | ||
| 21 | 216 22 | 0.89 0.01 | 0.10 0.02 | ||
| 9 | 194 18 | 0.90 0.01 | 0.13 0.01 |
| Galaxy | NGC | [Fe/H] | [Fe/H] | Age | Notes | |||
|---|---|---|---|---|---|---|---|---|
| Local Group dSph/dE | ||||||||
| Fornax | 5 | 0.2 | 0.830.06 | 4 Gyr | 1,2,3 | |||
| Sagittarius | 4 | 0.5 | 0.890.14 | 0.1 | 62 Gyr | 1,4,5; includes Terzan7 | ||
| NGC147 | 2 | 0.4 | 0.750.12 | ? | 4 Gyr | 1,6,7 | ||
| NGC185 | 5 | 0.3 | 0.860.10 | 0.2 | 4 Gyr | 1,6,8,9 | ||
| NGC205 | 7 | 0.1 | 0.950.04 | 0.2 | 4 Gyr | 1,6,10 | ||
| VCC1254 | 0.1 | 0.930.06 | 0.2 | 14 | ||||
| VCC1386 | 0.2 | 0.930.02 | 0.2 | 14 | ||||
| NGC3115DW1 | 7/37 | 0.2 | 0.980.02 | 0.3 | 11,12,13; from 13 | |||
Note. — (1) Mateo 1998; (2) Strader et al. 2003; (3) Pont et al. 2004; (4) Montegriffo et al. 1998 and references therein; (5) Monaco et al. 2002; (6) Da Costa & Mould 1988; (7) Han et al. 1997; (8) Martinez-Delgado & Aparicio 1998; (9) Geisler et al. 1999; (10) Mould, Kristian, & Da Costa 1984; (11) Durrell et al. 1996a; (12) Puzia et al. 2001; (13) Kundu & Whitmore 2001b; (14) Durrell et al. 1996b