Spectral and timing properties of the X-ray emission from the millisecond pulsar PSR B182124
We report results on the timing and spectral analysis of observations of the millisecond pulsar PSR B182124 with RXTE, BeppoSAX and Chandra. The X-ray light curve is characterized by two narrow peaks at a phase distance of . The average pulsed emission, over the range 1.6–20 keV, is well represented by a single power law with a photon index and unabsorbed (2–10 keV) pulsed X-ray flux of erg cm-2 s-1. We searched for a possible bunching of X-ray photons to verify if the X ray emission has a time structure similar to that of giant pulses and found a negative result.
Key Words.:
stars: neutron - pulsars: general - pulsars: individual: PSR B182124 - X-rays: stars1 Introduction
PSR B182124 is an isolated millisecond radio pulsar discovered in the core of the globular cluster M28 (Lyne et al. 1987). It is one of the most powerful (spin-down luminosity erg s-1) and youngest (spin-down age yr) millisecond pulsars (MSPs). This solitary MSP has a rotation period of 3.05 ms and a period derivative of s s-1. The inferred magnitude of the dipolar field at the magnetic pole is G, the highest among the known MSPs. The distance of the source, assumed equal to the globular cluster one, ranges from kpc (Rees & Cudworth 1991) to 5.7 kpc (Harris 1996). In analogy with Becker et al. (2003) we use 5.5 kpc in our calculations.
Marginal detection of X-ray pulsed emission was reported by Danner,
Kulkarni & Thorsett (1994) from a ROSAT (PSPC) observation from
which they inferred a luminosity of erg s-1
in the energy band 0.1–2.4 keV. ASCA observation of PSR B182124 (Saito
et al. 1997) evidenced a double peak profile with different shapes and a
phase separation of .
Studies of the absolute phase in order to establish the phase lag
of the X-ray emission with respect to the radio pulses have been
performed with RXTE and Chandra observations (Rots et al. 1998;
Rutledge et al. 2003).
The absolute phase of the higher and narrower of the two
X-ray peaks significantly
lags the corresponding radio feature, named P1 by Backer & Sallmen
(1997), of s.
The total pulsed spectrum was modelled with a single power law
of spectral index for the ASCA/GIS (0.8–10 keV) data,
for the RXTE/PCA data (2–20 keV) and for
the joint ASCA-RXTE data (Kuiper et al. 2003).
Radio giant pulses have been observed from PSR B182124 with intensities that reach 80 times the average pulse energy. The brightest pulses are concentrated in a narrow phase window (0.07), as derived from the average pulsed profile, that lags P1 by 80 s and so it is coincident with the main X-ray peak (Romani & Johnston 2001).
Recently, the high spatial resolution of Chandra allowed us to resolve 12 sources within the core of M28 where the pulsar is located (Becker et al. 2003; Rutledge et al. 2003). This made it possible to measure the unconfused phase averaged X-ray spectrum and the level of the unpulsed emission. The total (pulsed plus unpulsed) X-ray spectrum was modeled by a single power law with a photon index of and an unabsorbed (0.5–8 keV) flux of erg cm-2 s-1 with about 15% assigned to the non-pulsed emission (Rutledge et al. 2003). Moreover, the residuals in the Chandra spectrum show a hint of a feature at 3.3 keV, that Becker et al. (2003) fitted with a Gaussian. This line, having a width of 0.8 keV and a flux of photons cm-2 s-1, was identified as an electron cyclotron line formed in a magnetic field of G. The value, much higher than that derived from the dipole radiation, was explained either with a possible presence of multipolar components or with a strong displacement of the magnetic dipole center.
In this paper we present the timing and spectral analysis of one BeppoSAX and three RXTE observations of the pulsar covering the energy range 1.6–20 keV, including, for the spectral analysis, data from a Chandra/ACIS observation.
2 Observation and data reduction
RXTE observed the source three times from September 1996 to November 1999 as listed in Table 1. The two older observations (1996 and 1997) were performed with all five PCA units operating, while in the 1999 observation only three units were on. Standard selection criteria were applied to the data excluding time intervals corresponding to South Atlantic Anomaly passage, Earth’s limb lower than and angular distance between the source and the satellite pointing direction larger than 002. We used only data obtained with the PCA (Jahoda et al. 1996) accumulated in “Good Xenon” telemetry mode, time tagged with a 1 s accuracy with respect to the spacecraft clock and with absolute time accuracy of 5–8 s with respect to the UTC (Rots et al. 1998). Data from the first detector layer only are selected for the analysis to increase the signal-to-noise ratio.
BeppoSAX observed the source on 17 March 2000 for 196 ks elapsed time. In our analysis we consider only data from the MECS (1.6–10 keV; Boella et al. 1997) whose total exposure was 96.9 ks. MECS events were extracted from a circular region of 2’ radius which maximize the signal-to-noise ratio of the pulsed component.
In addition the BSAX and RXTE data, we used the pulsar spectrum from Becker et al. (2003) which was taken with Chandra between July and September 2002. For observational and data analysis details see Becker et al. (2003).
The observing and exposure times of each observation are shown in Table 1.
| Instrument(ObsId) | Starting time | Exposure | |
|---|---|---|---|
| (MJD) | (ks) | ||
| RXTE/PCA(P10421) | 16 Sep 1996 | 50342.26 | 6.4 |
| RXTE/PCA(P20159) | 10 Feb 1997 | 50489.87 | 97.3 |
| RXTE/PCA(P40090) | 12 Nov 1999 | 51494.25 | 38.7 |
| BSAX/MECS | 17 Mar 2000 | 51620.57 | 96.9 |
| Chandra/ACIS | 4 Jul 2002 | 52459 | 12.7 |
| Chandra/ACIS | 8 Aug 2002 | 52494 | 13.5 |
| Chandra/ACIS | 9 Sep 2002 | 52526 | 11.4 |
3 Timing analysis
Arrival times were converted to the Solar System Barycenter using the (J2000) pulsar coordinates given by Rutledge et al. (2003) (see Table 2) and the JPL2000 ephemeris (DE2000; Standish 1982). Search for the period was performed with the folding technique in a small frequency range around the value expected from the Nançay radio ephemeris reported in Table 2 (Rutledge et al. 2003).
| Parameter | Value |
|---|---|
| Right Ascension (J2000) | |
| Declination (J2000) | |
| Validity Epoch (MJD) | 50351–52610 |
| DM (pc cm-3) | 119.873 |
| (Hz) | 327.40564101150(1) |
| Hz s | |
| Hz s | 0.66 |
| (MJD) | 51468.0 |
The best frequency of each RXTE observation was computed fitting the peak of the distribution with a gaussian and it was found compatible with the expected value from radio measurements. Errors at level were derived by the frequency interval corresponding to a unit decrement with respect to the maximum in the curve (). Table 3 shows the detected frequency for the entire data set at the reference time assumed equal to the central time of each observation; the values in parenthesis are the statistical uncertainty in the last digit corresponding to one gaussian standard deviation.
| Instrument | Reference Time | Frequency |
|---|---|---|
| (MJD) | (Hz) | |
| RXTE/PCA | 50342.31617688 | 327.4056574(8) |
| RXTE/PCA | 50490.95766180 | 327.40565566(1) |
| RXTE/PCA | 51494.73885753 | 327.40564068(5) |
| BSAX/MECS∗ | 51621.70908612 | 327.4056429(4) |
∗Quoted errors are the statistical ones. A further systematic error of Hz must be considered for this observation (see text).

A cumulative RXTE light curve has been generated at the radio ephemeris adding the light curves of each observation. The highest significance of the pulsed emission is reached in the energy interval 2–20 keV (PHA 5–54) and the resulting X-ray pulse profile is shown in the top panel of Fig. 1. Two peaks are evident in this light curve: a sharp peak at phase and a wider and lower peak at phase . In this paper, we use the nomenclature of Backer & Sallmen (1997) referring the peak at phase 0.62 as P1X and the other as P2X. The statistical significance is and for the first and second peak, respectively. The entire pulse profile can be modeled by two Gaussian curves, one for each peak, plus a constant level. The statistical agreement is good and the Gaussian parameters can be used to evaluate some interesting parameters: the phase separation between the two peaks is measured from P2X to P1X; the best fit parameters for P1X and P2X for the FWHM are and for P1X and P2X respectively, and the normalization are and , respectively. Two other pulse profiles in narrower energy ranges (2–10 keV and 10–20 keV) are shown in the other panels of Fig. 1. To search for possible morphology changes, we computed the P2X/P1X ratios in different energy bands. This calculation was performed from the total counts in the phase intervals 0.60–0.65 and 0.13–0.24 for P1X and P2X, respectively, after the subtraction of the off-pulse level, estimated in the phase intervals 0.32–0.57 and 0.73–1.00 (see Fig. 1). The P2X/P1X values of the two ratios were and in the 2–10 keV and 10–20 keV band respectively, indicating only a marginal variation at significance. We verified these results from the integrated Gaussian profiles, with the best fit parameters given above, and found an agreement within one standard deviation.
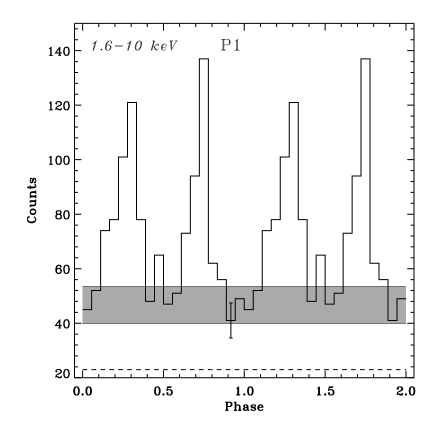
BeppoSAX data were analyzed with the same method and the resulting distribution of the MECS events showed a discrepancy between the measured frequency and the expected one from radio ephemeris , Hz. This difference is due to a systematic of the onboard clock present in the BeppoSAX observations after January 2000 (Nicastro et al. 2002). For this reason, in the production of MECS light curves we used the proper ephemeris . The resulting 1.6–10 keV profile is shown in Fig. 2: two peaks with phase separation are evident. The profile is different from the RXTE one because the worse BeppoSAX timing accuracy ( s; Mineo et al. 2000) widens the two peaks. We arbitrarily associated the higher and narrower peak to P1X because the BeppoSAX accuracy does not allow the evaluation of the absolute phase.
The location of PSR B182124 near the core of the globular cluster makes difficut the evaluation of the pulsed fraction because of the contamination from these sources not resolved by the large MECS point spread function. Their contribution in the extraction region was computed using the results published in Becker et al. (2003) and subtracted from the light curve. The resulting signal is consistent with being 100% pulsed with a upper limit on the unpulsed emission of 20% in agreement with the Rutledge et al. (2003) results.
The occurrence of giant pulses (GPs) at the same phase of the X-ray peak P1X suggests the possibility that energetic photons are emitted during the same events in which the radio GPs are originated. To verify this hypothesis, we searched for a bunching of the X-ray photons, possibly with a rate similar to that of GPs. According to Romani & Johnston (2001) the GP rate from PSR B182124 is –6 events per hour, and therefore, if the X-ray flux is more intense in these occasions, one can expect to observe few pulses with a number of photons largely in excess to the poissonian fluctuations. During the RXTE exposure we should expect about 200 possible X-ray flares correlated with giant pulses. In the search of these events, we applied the same method used in the analysis of the MSP PSR B1937+21 (Cusumano et al. 2003) and produced an X-ray light curve selecting only the events within a narrow phase interval of width (180 s) centered at P1X and studied the frequency distribution of these events. This width has been chosen because it is comparable to the full width half maximum of P1X and of the giant pulse phase window. Since the dead time of the PCA is about 10 s, the maximum content of a bin in the presence of an X-ray flare cannot exceed 18-19 counts. The resulting distribution deviates from the Poisson law because we found a number of bins having more than 2 events much higher than expected. In particular, we obtained 1312 bins with 2 counts, 16 bins with 3 counts, 3 bins with 4 counts and 1 bin with 5 counts. However, comparing this distribution with others from several phase intervals in the off-pulse region, we found a similar number of bins with more than two events. Furthermore, comparable excesses were also found in the analysis of PSR B1937+21 (Cusumano et al. 2003), and therefore they seems related to instrumental timing performance rather than some other origin, like the variation of sources in the field of M28 (Becker et al. 2003). We conclude that there is no evidence for a bunching of the X-ray emission.

4 Spectral analysis
Pulse phase histograms were accumulated for each unit of RXTE/PCA independently for the 256 PHA channels. The same procedure was applied to MECS data accumulating a phase resolved histogram for each energy channel.
RXTE pectra of the two peaks were accumulated in the phase intervals 0.60–0.65 and 0.13–0.24 for P1X and P2X respectively; off-pulse counts were extracted from the phase intervals 0.32–0.57 and 0.73–1.00 (see Fig. 1). The total pulsed spectrum was obtained from the sum of the two peaks. Energy channels were rebinned in order to have at least 30 counts per bin and make the statistics available. RXTE spectra were combined by summing the individual units and assigning a total exposure time equal to the sum of the individual exposures. RXTE response matrix were derived for each PCA unit and summed together weighting with the background subtracted counts of the correspondent PCU’s phase histogram.
A similar procedure was also followed for the MECS spectra. In this case however, because of the broad peak profiles (see Fig. 2), the off-pulse was estimated from the interval 0.40–0.60.
RXTE (energy range 2–20 keV) and MECS (energy range 1.6–10 keV) spectra were simultaneously fitted fixing the intercalibration factor to the value obtained modelling the two spectra in the common range 2–10 keV with a power law. The value is in agreement within two standard deviation with the values expected from the PCA-MECS intercalibration (Kuulkers et al. 2003).
Pulsed spectra were fitted with an absorbed power law with the galactic column density fixed to the values cm-2 obtained by Chandra, in agreement with that computed from the reddening of the globular cluster (Becker et al. 2003).
The average pulsed spectral index was and the unabsorbed (2–10 keV) pulsed X-ray flux was erg cm-2 s-1 corresponding to a uniform luminosity of erg s-1. This value agrees very well with the luminosity estimated by Saito et al. (1997) after the correction due to the small difference in the distance. The ratio of the observed (2–10 keV) luminosity with the spin-down energy loss is
where is the moment of inertia in 1045 gr cm2. It lies very nicely on the correlation between X-ray and spin-down luminosity given by Becker & Trümper (1999) and Possenti et al. (2002). As already noticed by Becker et al. (2003), the value of is essentially intrinsic because the line-of-sight projection of the acceleration in the cluster’s gravitational potential can affect by an amount less than 10%.
The pulsed spectra with the fitting model (top panel) and the relative residuals (bottom panel) are shown in Fig. 3. Only one bin around 3 keV shows a significant excess but it is too narrow to be compatible with the instrumental resolution and cannot be due to a true spectral feature. Moreover, adding a Gaussian line at 3.3 keV and having a width of 0.8 keV we obtained a upper limit of photons cm-2 s-1, which means that neither the RXTE nor the BSAX data are sensitive enough to confirm this spectral feature seen in the Chandra data. Furthermore, a black body spectral distribution did not fit the average pulsed spectra giving an unacceptable reduced (56 d.o.f.).
Fitting a power law spectrum to the two peaks separately, a marginal difference of the spectral indices has been detected with and for P1X and P2X, respectively. Table 3 reports the best fit parameters for the two peaks fitted independently and for the total pulsed emission (P1X+P2X).
To improve the fit accuracy, we performed the spectral analysis of the total signal from PSR B182124 considering also Chandra/ACIS data. This spectrum is relative to the total pulsed emission and includes an unpulsed component that, according Rutledge et al. (2003), can account for 15% of the total emission; presently there is no spectral information about this component. Taking into account these remarks, we fitted the pulsed RXTE and MECS spectra together with the Chandra total one using a single power law. The Chandra/ACIS intercalibration factor was determined with respect to RXTE by fitting the events in the common energy ranges and resulted equal to . The spectral index was found fully compatible with the previous analysis but with a much smaller uncertainty. The subtraction of the RXTE pulsed spectrum, extrapolated at energies below 2 keV, from the Chandra data did not give any significant low energy residuals, indicating that the DC component reported by Rutledge et al. (2003), if detectable, does not have a spectrum much softer than the pulsed one. An estimate of significant constraints on the spectral shape is practically not possible because of the large uncertainty on the intercalibration factors.
| Component | (2–10 keV)1 | (d.o.f.) | |
|---|---|---|---|
| P1X | 0.93(56) | ||
| P2X | 1.22(56) | ||
| P1X+P2X | 1.07(56) | ||
| P1X+P2X+(DC)2 | 0.97(91) |
1 in units of 10-13 erg cm2 s-1
2 MECS, RXTE and Chandra (total signal) data
5 Discussion
Our analysis of the available X-ray observations of PSR B182124 performed with RXTE, BeppoSAX and Chandra confirms the known picture on this source. In particular, the joint analysis of the whole data set provided an accurate estimate of the phase averaged photon index which resulted ; moreover, RXTE and BeppoSAX gave an indication of a spectral difference between the two X-ray peaks. PSR B182124 and PSR B1937+21 are the only two MSPs whose radio emission shows giant pulses concentrated in the same narrow phase window of X-ray pulses (Kinkhabwala & Thorsett 2000, Romani & Johnston 2001, Cusumano et al. 2003). It is unlikely that this phase coincidence would be casual and therefore it can be an indication that radio GPs and X-rays are emitted in the same region of the magnetosphere. For this reason we focused our attention to verify if the X-ray emission is occasionally enhanced with a rate comparable to that of GPs. A statistical test on the distribution of the number of X-ray events gave a negative result, indicating that, differently from GPs, X-rays photons are emitted in a steady process. Furthermore, the fact that the phase distances between normal radio and X-ray pulses are about the same in these two MSPs indicates that their respective origin regions do not have a large spatial separation.
It is possible that the high-energy emission is enhanced in coincidence with radio GPs. This effect has been found in the Crab pulsar whose optical pulses intensity simultaneous to GPs increases on average of 3% with respect to the normal radio pulses (Shearer et al. 2003). This result has not been verified at -ray energies though the present limit cannot exclude it (Lundgren et al. 1995). As pointed out by Shearer et al. (2003) an increase of the pair plasma density of the same order of the optical intensity cannot completely explain the very large flux of radio GPs, which in Crab are orders of magnitude stronger than normal pulses.
In the case of PSR B182124 we can derive a crude upper limit of the pulsed signal fraction emitted in correlation with the GPs. Assuming that of the total pulsed counts are concentrated within the GP phase window, we should expect several bins with 6 or more events in a single pulse; but they are not observed indicating that the fraction must be less than the above value. The same limit applies to the total number of emitting particles, whereas it does not hold for the local fluctuations of their density within a small region of the magnetosphere.
The actual site in the magnetosphere where pulses originate is uncertain. In some models the phase separations close to 0.5 has been considered as an indication that pulses originate from the polar regions of an orthogonal rotator (see e.g. Ruderman 2003). Electrons should then be accelerated in the polar gap and emit coherent and incoherent radiation from this site. Romani & Johnston (2001) proposed for PSR B182124 a different scenario in which GPs and X rays are emitted in the outer gaps, where a high local magnetic field should enhance the synchrotron emissivity and the production rate of secondary e+e- pairs. X-ray pulses are then emitted by this dense pair plasma that would also produce instabilities which in turn increase the particles coherence and hence the emission of radio GPs. Pulse profiles for the outer gap geometry have been calculated by Wang et al. (2002), who obtained narrow radio and X-ray peaks with a phase separation close to 0.5. Whether these models are appropriate to describe the observed scenario can be decided only when more pulsars showing the same behaviour are detected.
Acknowledgements.
This work has been partially supported by INAF (Istituto Nazionale di Astrofisica).References
- Backer & Sallmen, (1997) Backer, D.C., Sallmen, S., 1997, AJ, 114(4), 1539
- Becker et al., (2003) Becker, W, Trümper, J., 1999, A&A, 341, 803
- Becker et al., (2003) Becker, W., Swartz, D.A., Pavlov, G.G., et al., 2003, ApJ, 594, 798
- Boella et al., (1997) Boella, G., Chiappetti, L., Conti, G., et al., 1997, A&AS, 122, 327
- Cusumano et al., (2003) Cusumano, G., Massaro, E., Mineo, T., et al., 2003, A&A 410, L9
- Danner et al., (1994) Danner, R., Kulkarni, S.R., Thorsett, S.E., 1994, ApJ, 436, L153
- Harris (1996) Harris, W.E., 1996, AJ, 112, 1487
- Jahoda et al., (1996) Jahoda, K., Swank, J.H., Giles, A.B., et al., 1996, SPIE, 2808, 59
- Kinkhabwala et al., (1994) Kinkhabwala A., Thorsett S.E., 2000, ApJ, 535, 365
- Kuiper et al., (2003) Kuiper, L., Hermsen, W., Stappers B., 2003, Proceedings of the International Workshop held in Marsala, Pulsars, AXPs and SGRs observed with BeppoSAX and Other Observatories, September 23-25, 2002, eds Cusumano, E. Massaro, T. Mineo.
- Kuulkers E. et al., (2003) Kuulkers E., den Hartog P.R., in’t Zand J.J.M et al., 2003, A&A 399, 663
- Lundgren et al. (1995) Lundgren S.C. et al., 1995, ApJ, 470, 469
- Lyne et al. (1987) Lyne, A.G., et al., 1987, Nature, 328, 399
- Nicatro et al., (2002) Nicastro, L., Cusumano, G., Kuiper, L., et al., 2002, Proceedings of the Seminar on Neutron Stars, Pulsars and Supernova Remnants, Physikzentrum Bad Honnef, eds W.Becker, H.Lesch & J.Trümper
- Possenti et al., (2001) Possenti, A., Cerutti, R., Colpi, M., Mereghetti, S., 2002, A&A, 387, 993
- Mineo et al. (2000) Mineo, T., Cusumano, G., Kuiper, L., et al., 2000, A&A, 355, 1053
- Rees & Cudworth (1991) Rees, R.F., Cudworth, K.M., 1991, AJ, 102, 152
- Romani & Johnston (2001) Romani, R.W., Johnston, S., 2001, ApJ, 557, L93
- Rots et al. (1998) Rots, A.H., Jahoda, K., Macomb, D.J., et al., 1998, ApJ, 501, 749
- Ruderman (2003) Ruderman M., 2003, X-ray and -ray Astrophysics of Galactic Sources, in press, astroph/0311228
- Rutledge et al., (2003) Rutledge, R.E., Fox, D.W., Kulkarni, S.R., et al., 2003, astro-ph/0301453
- Saito et al., (1997) Saito, Y., Kawai, N., Shibata S., Dotani, T., Kulkarni, S.R., 1997, ApJ, 477, L37
- Shearer et al. (2003) Shearer A., Stappers B., O’Connor P. et al., 2003 Science, 301, 493
- Standish, (1982) Standish, E.M., 1982, A&A, 114, 297