The isolated neutron star X-ray pulsars RX J0420.0$-$5022 and RX J0806.4$-$4123: new X-ray and optical observations ††thanks: Based on observations with XMM-Newton, an ESA Science Mission with instruments and contributions directly funded by ESA Member states and the USA (NASA). Optical observations were performed at the European Southern Observatory, ESO programme 66.D-0128(A).
We report on the analysis of new X-ray data obtained with XMM-Newton and Chandra from two ROSAT-discovered X-ray dim isolated neutron stars (XDINs). RX J0806.4$-$4123 was observed with XMM-Newton in April 2003, 2.5 years after the first observation. The EPIC-pn data confirm that this object is an X-ray pulsar with 11.371 s neutron star spin period. The X-ray spectrum is consistent with absorbed black-body emission with a temperature kT = 96 eV and NH = 4 cm-2 without significant changes between the two observations. Four XMM-Newton observations of RX J0420.0$-$5022 between December 2002 and July 2003 did not confirm the 22.7 s pulsations originally indicated in ROSAT data, but clearly reveal a 3.453 s period. A fit to the X-ray spectrum using an absorbed black-body model yields kT = 45 eV, the lowest value found from the small group of XDINs and NH = 1.0 cm-2. Including a broad absorption line improves the quality of the spectral fits considerably for both objects and may indicate the presence of absorption features similar to those reported from RBS1223, RX J1605.3+3249 and RX J0720.4$-$3125. For both targets we derive accurate X-ray positions from the Chandra data and present an optical counterpart candidate for RX J0420.0$-$5022 with B = 26.60.3 mag from VLT imaging.
Key Words.:
X-rays: stars – stars: neutron – stars: magnetic fields – stars: individual: RX J0420.0$-$5022, RX J0806.4$-$41231 Introduction
The two soft X-ray sources RX J0806.4$-$4123 and RX J0420.0$-$5022 belong to the group of X-ray dim isolated neutron stars (XDINs) discovered in the ROSAT all-sky survey data (for recent reviews see Treves et al. 2000; Motch 2001; Haberl 2004). RX J0806.4$-$4123 was discovered by Haberl et al. (1998) in a dedicated search for XDINs applying spectral hardness ratio selection criteria to the ROSAT survey source catalogue restricted to the galactic plane. Two short ROSAT pointed PSPC observations covered the source serendipitously at an off-axis angle of 31′ and the obtained spectra were consistent with a black-body model with temperature kT = 787 eV. No optical counterpart was identified with a limiting B magnitude of 24. A first XMM-Newton observation as part of the telescope scientist guaranteed time revealed a possible candidate for the neutron star spin period of 11.37 s, formally detected at a 3.5 level in the EPIC-pn data (Haberl & Zavlin 2002, hereafter HZ02).
The faintest object in X-rays among the XDINs is RX J0420.0$-$5022, which was selected initially due to a mis-identification with a nearby galaxy. Follow-up ROSAT PSPC and HRI observations and ESO-NTT images, which revealed no optical counterpart brighter than B = 25.25, ruled out possible kinds of known X-ray emitters other than an isolated neutron star (Haberl et al. 1999). The X-ray spectrum - consistent with a Planckian shape as observed from the other XDINs - obtained from the short PSPC pointed observation allowed only coarse estimates of black-body temperature and interstellar absorption, but indicated that it is one of the XDINs with lowest temperature. The PSPC data also showed evidence for periodic modulation of the X-ray flux with a period of 22.7 s suggesting that RX J0420.0$-$5022 is a X-ray pulsar similar to RX J0720.4$-$3125 (Haberl et al. 1997), the only pulsar known among the XDINs at that time.
| Target | Instrument | Read-out | Filter | Sat. Revol./ | Observation | Exp. | ||
| Mode | Obs.-ID | Date | Start | End (UT) | [ks] | |||
| RX J0806.4$-$4123 | EPIC-MOS1/2 | FF, 2.6 s | Thin | 168 | Nov. 8, 2000 | 13:43 | 18:47 | 18.0 |
| EPIC-pn | FF, 73 ms | Thin | 14:24 | 18:53 | 15.6 | |||
| RGS1/2 | Spectro | – | 13:35 | 18:54 | 19.1 | |||
| ACIS-I | FF, 3.2 s | 500239 | Feb. 21, 2002 | 03:33 | 08:55 | 17.9 | ||
| EPIC-MOS1/2 | FF, 2.6 s | Thin | 618 | Apr. 24, 2003 | 14:18 | 21:10 | 24.6 | |
| EPIC-pn | FF, 73 ms | Thin | 14:44 | 21:10 | 22.7 | |||
| RGS1/2 | Spectro | – | 13:49 | 21:11 | 26.4 | |||
| RX J0420.0$-$5022 | ACIS-S | FF, 3.2 s | 500238 | Nov. 11, 2002 | 21:58 | 03:47 | 19.6 | |
| EPIC-MOS1/2 | FF, 2.6 s | Thin | 560 | Dec. 30, 2002 | 03:39 | 09:43 | 21.7 | |
| EPIC-pn | FF, 73 ms | Thin | 04:01 | 09:43 | 20.0 | |||
| EPIC-MOS1/2 | FF, 2.6 s | Thin | 561 | Dec. 31, 2002 | 21:55 | 03:59 | 21.7 | |
| EPIC-pn | FF, 73 ms | Thin | 22:17 | 03:59 | 20.0 | |||
| EPIC-MOS1/2 | FF, 2.6 s | Thin | 570 | Jan. 19, 2003 | 16:42 | 22:55 | 22.2 | |
| EPIC-pn | FF, 73 ms | Thin | 17:05 | 22:55 | 20.5 | |||
| EPIC-MOS1/2 | FF, 2.6 s | Thin | 664 | Jul. 25, 2003 | 21:22 | 03:26 | 21.7 | |
| EPIC-pn | FF, 73 ms | Thin | 21:45 | 03:26 | 20.0 | |||
Here we present the results from the analysis of new XMM-Newton and Chandra data from RX J0806.4$-$4123 and RX J0420.0$-$5022. We derive accurate X-ray positions utilizing the imaging capabilities of Chandra and derive X-ray spectral parameters from the high statistical quality spectra collected by the EPIC-pn instrument on board XMM-Newton. We discuss the measured properties in comparison with the other known XDINs.
2 Chandra and XMM-Newton observations
Using XMM-Newton (Jansen et al. 2001) we observed RX J0806.4$-$4123 and RX J0420.0$-$5022 during the AO2 guest observer programme. Here we report on the analysis of the data collected with the European Photon Imaging Camera based on a pn (EPIC-pn, Strüder et al. 2001) CCD detector which is mounted behind one of the three X-ray telescopes (Aschenbach et al. 2000). We include the first XMM-Newton observation of RX J0806.4$-$4123 (HZ02) from the guaranteed time programme for a comparative study. Spectra obtained from RX J0806.4$-$4123 (RX J0420.0$-$5022 is not sufficiently bright) by the Reflection Grating Spectrometers (RGS, den Herder et al. 2001) are also investigated. Details of the XMM-Newton observations are summarized in Table 1. We do not use the data from the EPIC-MOS (EPIC-MOS1 and -MOS2, Turner et al. 2001) CCDs because of currently un-calibrated changes in the low-energy spectral response. With Chandra we observed the two neutron stars in Cycle 3 of the guest observer programme using the ACIS CCD arrays (Table 1). We used the ACIS data to derive precise X-ray positions. Due to the low statistics (see below) we did not accumulate energy spectra.
2.1 X-ray positions
The best X-ray positions were derived from the Chandra ACIS pre-processed level 2 event files using the ‘celldetect’ task of the Chandra analysis package CIAO 3.0. To optimize the signal to noise ratio we accumulated images in the energy bands 0.3-1.0 keV for RX J0806.4$-$4123 and 0.3-0.7 keV for RX J0420.0$-$5022 (see below). RX J0806.4$-$4123 was detected with 986 net source counts (0.3-1.0 keV, corrected for point spread function losses) and we obtained RA = 08h06m2340 and Dec = –41°22′309 (J2000.0). For RX J0420.0$-$5022 270 net source counts (0.3-0.7 keV) were found yielding a position RA = 04h20m0195 and Dec = –50°22′481 (J2000.0). The 90% confidence systematic position uncertainty is 0.6″ (Aldcroft et al. 2000). We compared the X-ray positions of four RX J0420.0$-$5022 field sources (detected at relatively large off-axis angles of 4′ - 5.5′) with counterparts from the USNO-B catalogue and found agreement to better than 0.5″ in each coordinate. We did not find any systematic shift which would allow to reduce the systematic position error. The Chandra position of RX J0806.4$-$4123 is consistent with that derived from the XMM-Newton observation in Nov. 2000 (HZ02).
2.2 Average EPIC-pn X-ray spectra
To obtain energy spectra with highest statistical quality we used the EPIC-pn data and processed the photon event files using a the XMM-Newton analysis package SAS version 6.0. Single-pixel events from circular regions around the sources with 30″ (RX J0420.0$-$5022) and 35″ (RX J0806.4$-$4123) radius were extracted and background was taken from similar nearby source-free areas. The SAS task ‘arfgen’ was used to calculate effective areas and ready-made redistribution matrices for EPIC-pn full-frame (FF) mode were used for the spectral analysis.


| Object | Obs. | Count Rate | kT | NH | Flux 0.1-2.4 keV | /dof |
| [cts s-1] | [eV] | [cm-2] | erg cm-2 s-1 | |||
| RX J0806.4$-$4123 | 168-pn | 1.7800.012 | 95.61.1 | 0.400.11 | 28.80.2 | |
| 618-pn | 1.7690.010 | 95.50.9 | = | 28.70.2 | 1.50/273 | |
| RX J0420.0$-$5022 | 560-pn | 0.2120.004 | 44.81.8 | 1.010.37 | 4.80.3 | |
| 561-pn | 0.2220.004 | = | = | 5.10.3 | ||
| 570-pn | 0.2170.004 | = | = | 5.10.3 | ||
| 664-pn | 0.2120.004 | = | = | 4.90.3 | 1.25/157 |
Count rates with 68% errors correspond to the 0.13-1.2 keV (RX J0806.4$-$4123) and 0.13-0.9 keV (RX J0420.0$-$5022)
bands as used for the spectral analysis. Fluxes are corrected for point spread
function losses. Temperatures and fluxes are not corrected for relativistic effects and are
given as measured by a distant observer. Errors on the spectral model parameters
are derived for a 90% confidence level.
“=” denotes fit parameter is a single free parameter common to all spectra of one object.
2.2.1 Black-body model
The EPIC-pn spectra obtained from the two XMM-Newton observations of RX J0806.4$-$4123 were fit simultaneously first with an absorbed black-body model. The column density was treated as a free parameter common to both spectra. Temperature and normalization were allowed to vary freely for both spectra independently to allow for possible small gain variations (see also Haberl et al. 2004) and to investigate long-term flux variations. Both spectra are fully compatible in shape and absolute flux and the derived spectral parameters, which are summarized in Table 2, agree within the statistical errors (90% confidence for one parameter of interest). In comparison to the fit presented by HZ02 the up-dated calibration yields reduced residuals and a more reliable value for the absorption (the NH value derived with the same calibration from the EPIC-pn spectrum of RX J1856.4$-$3754 agrees with that obtained from the Chandra LETGS spectrum). Because no significant differences are seen in the two spectra, we merged the data and accumulated a combined spectrum which is presented in Fig. 1. Again it was modeled using the absorbed black-body spectrum and the best fit parameters are listed in Table 3.
| Object | Instr. | Phases | Model | kT | NH | Eline | EW | /dof |
| [eV] | [cm-2] | [eV] | [eV] | |||||
| RX J0806.4$-$4123 | EPIC-pn | all | black-body | 95.60.9 | 0.410.09 | – | – | 1.97/137 |
| all | bb + gauss1 | 91.71.4 | 1.120.22 | 46015 | 6 | 1.51/135 | ||
| RGS1/2 | all | black-body | 1044 | 0.412 | – | – | 0.91/245 | |
| all | bb + gauss1 | 924 | 1.122 | 41319 | 13 | 0.82/243 | ||
| RX J0420.0$-$5022 | EPIC-pn | all | black-body | 44.91.3 | 1.020.26 | – | – | 1.85/51 |
| all | bb + gauss1 | 45.02.6 | 2.020.71 | 32924 | 3 | 0.92/49 | ||
| soft | black-body | 44.01.6 | 1.020.32 | – | – | |||
| hard | black-body | 45.71.6 | = | – | – | 1.84/76 | ||
| soft | bb + gauss1 | 44.51.3 | 2.090.42 | 3292 | 10 | |||
| hard | bb + gauss1 | 45.61.2 | = | 3292 | 8 | 1.17/74 |
1Black-body model with Gaussian absorption line with fixed width of =70 eV. 2Parameter is fixed in the fit.
The four EPIC-pn spectra of RX J0420.0$-$5022 were analyzed in a similar way as those of RX J0806.4$-$4123. Due to the lower flux of this target we allowed only the black-body normalization to vary between the spectra of the individual observations and fitted temperature and NH as common parameters. The results are presented in Table 2. As for RX J0806.4$-$4123 the four spectra are consistent with each other allowing to accumulate a total spectrum from the merged data (Fig. 1). The fit results are listed in Table 3. The temperature of 45 eV is the lowest value derived from any of the known XDINs.
2.2.2 Absorption features ?
The quality of the black-body fits to the phase-averaged merged EPIC-pn spectra of RX J0806.4$-$4123 and RX J0420.0$-$5022 is in both cases not very good. Recently, broad X-ray absorption features from the three XDINs RBS1223 (=1RXS J130848.6+212708, Haberl et al. 2003), RX J0720.4$-$3125 (Haberl et al. 2004) and RX J1605.3+3249 (van Kerkwijk et al. 2004) were discovered in XMM-Newton spectra. In the following we add a broad absorption line to the black-body model. Because the statistical quality in the present spectra is relatively low we fixed the width of the line at 70 eV, a value similar to those found from RX J0720.4$-$3125 and RX J1605.3+3249. The best fit parameters are summarized in Table 3 (phases ‘all’) and the model fit is presented in Fig. 1. Formally, the quality of the fit improves considerably in both cases when including the absorption line. At the current stage of the EPIC-pn spectral calibration it is not clear how much of this improvement is caused by residual systematic calibration effects. In particular, the residuals of the black-body fit to the spectrum of RX J0806.4$-$4123 are very similar in shape and strength to those of RX J1856.4$-$3754 (Haberl et al. 2004). On the other hand, for RX J0420.0$-$5022 the deviations are larger and lead to a stronger absorption feature (EW = 43 eV). At the derived energy of 329 eV RX J1856.4$-$3754 does not show negative residuals which would lead to an artificial absorption feature. The reduction in the (reduced) is also larger in the case of RX J0420.0$-$5022 than in RX J1856.4$-$3754.
2.2.3 Other models
Following Haberl et al. (2003) we also tried non-magnetic neutron star atmosphere models (e.g. Gänsicke et al. 2002; Zavlin & Pavlov 2002). As in the case of RBS1223 iron and solar abundance atmospheres do not reproduce the smooth continuum observed from RX J0806.4$-$4123 and RX J0420.0$-$5022 at energies above 0.5 keV where these models predict Fe absorption features. The Hydrogen atmosphere model fits yield for both sources lower temperatures as the black-body fits (35 eV for RX J0806.4$-$4123 and 12 eV for RX J0420.0$-$5022) which leads to the well known problem of predicting too high optical fluxes (Pavlov et al. 1996). The quality of the H atmosphere model fits range between those obtained from fits using a black-body with and without line (reduced of 1.7 for 137 dof and 1.5 for 51 dof for RX J0806.4$-$4123 and RX J0420.0$-$5022, respectively).
Another model, first applied by Burwitz et al. (2003) to the spectrum of RX J1856.4$-$3754 and more recently by de Vries et al. (2004) to spectra of RX J0720.4$-$3125, consists of a black-body component attenuated by photo-electric absorption and an additional ad hoc term Eβ. This model can successfully describe the long-term spectral variations discovered in XMM-Newton RGS spectra from RX J0720.4$-$3125 with the value of increasing with time (over nearly 2.5 years) from 1.4 to 2.7. The reported value for RX J1856.4$-$3754 of 1.280.3 is at the lower end of values measured from RX J0720.4$-$3125. A fit of this model to the EPIC-pn spectrum of RX J0806.4$-$4123 results in an increased temperature of 130 eV, an increased NH of 1.9 cm-2 and = 1.76, very different to the values reported from the high resolution spectra of RX J1856.4$-$3754 and RX J0720.4$-$3125. Formally, this model (with one more free degree of freedom) allows a better representation of the continuum curvature (reduced = 1.50) but does not improve the residual pattern seen on smaller energy scales in the pure black-body fit (Fig. 1 upper left). Hence, the best fit is obtained by including both, power-law attenuation and a narrower absorption feature (reduced of 1.0 for 134 dof). However, given the systematic calibration uncertainties it is not clear if the broad-band black-body model modification is justified in the case of RX J0806.4$-$4123. For RX J0420.0$-$5022 the extremely soft spectrum covers a very narrow energy band which does not allow to constrain kT and . Formally, the best fit yields = -9.0 and kT = 550 eV. We therefore do not follow this model further for this source.
2.2.4 RGS spectra
RGS spectra of RX J0806.4$-$4123 were produced using ‘rgsproc’ of SAS 6.0. The four spectra (RGS1 and RGS2 from the two observations) were simultaneously fit (only allowing for individual normalization factors) using the black-body model with and without including a broad absorption line. Because of the lower sensitivity to photo-electric absorption in the RGS spectra NH was fixed to the values obtained from the EPIC-pn spectra. The resulting best-fit parameters are presented in Table 3 and the, for clearer representation combined, RGS spectrum is shown in Fig. 2.
Although the black-body model yields an acceptable fit to the RGS spectra, deviations are visible at low energies. The residuals are improved when the absorption line is added to the model. Different values for the line energy and the line strength are derived from RGS and EPIC-pn spectra, which most likely can be attributed to calibration problems.


2.3 X-ray pulsations
Due to the high time resolution of the EPIC-pn read-out mode only the data from this instrument were used for our temporal analysis. We extracted pattern 0-12 events from circular regions around the sources with 30″ (RX J0420.0$-$5022) and 45″ (RX J0806.4$-$4123) radius. The event arrival times were checked for time jumps which sometimes occur in the pn data and corrected to solar system barycenter using the ‘barycen’ task. For periodicity searches we followed HZ02 using the method (Buccheri et al. 1983) and the Odds-ratio approach based on the Bayesian formalism (Gregory & Loredo 1996) for a precise determination of the spin period and its error (see Zavlin et al. 2004, for details).
For both targets neutron star spin periods were reported in the past with low significance: 11.371 s at a 3.5 level for RX J0806.4$-$4123 from EPIC-pn data (HZ02) and evidence for 22.7 s in ROSAT HRI data of RX J0420.0$-$5022 (Haberl et al. 1999). A search for pulsations around 11.371 s in the data of the second XMM-Newton observation of RX J0806.4$-$4123 confirms the pulse period and the periodogram and the pulse profile are presented in Fig. 3. We summarize in Table 4 the pulse periods with errors derived from the Odds-ratio method and the values for RX J0806.4$-$4123 with the values for the first observation taken from HZ02 for comparison.
None of the four observations of RX J0420.0$-$5022 revealed a significant peak in the periodograms around the suggested ROSAT value of 22.7 s. However, in all four observations a period of 3.453 s was detected. As for RX J0806.4$-$4123, we performed tests with contributions of higher harmonics. The results are listed in Table 4 with the best pulse periods and errors. The pulse periods are consistent within the 1 errors. The pulse profiles, folded at the best period and normalized to the mean count rates are shown in Fig. 4. Folding the light curves at the same average period yields no significantly different profiles. Although for all four observations the exposure, background level and net source intensity were nearly identical, the maximum value varied from one observation to the next. However, the standard deviation for the value expected from a sine-like signal is 2 , indicating that the variations are not significant. To verify this we performed an additional test following equation (1) of Zavlin & Pavlov (1998) by comparing the observations pair by pair. Since the relative phasing is not known we stepped through a grid of phase shifts and used the minimum value to calculate the probability that the two light curves have different shapes. The values and inferred probabilities are summarized in Table 5. The highest probability (98.5% corresponding to 2.4), which was found from the comparison of the first and second observation, is still consistent with statistical fluctuations. We conclude that there is no significant change in the pulse profile of RX J0420.0$-$5022 over 0.5 years covered by the observations.


| Obs. | Period | ||||
|---|---|---|---|---|---|
| [s] | |||||
| RX J0806.4$-$4123 | |||||
| 168-pn | 11.371393.0 | 33.9 | 42.9 | 43.0 | 43.2 |
| 618-pn | 11.371034.0 | 43.6 | 57.2 | 60.4 | 60.9 |
| RX J0420.0$-$5022 | |||||
| 560-pn | 3.4530506.0 | 30.0 | 36.9 | 48.5 | 51.7 |
| 561-pn | 3.4530987.2 | 27.2 | 30.1 | 32.1 | 33.9 |
| 570-pn | 3.4530633.5 | 67.0 | 69.0 | 70.3 | 72.1 |
| 664-pn | 3.4530748.4 | 36.4 | 36.5 | 39.0 | 41.5 |
Errors on the period are given for a 68% confidence level.


The time baseline between the observations is not sufficiently long to detect significant period changes for both objects. Fitting a linear period change with time we derive spin period change rates of (-4.66.4) s s-1 and (0.58.6) s s-1 for RX J0806.4$-$4123 and RX J0420.0$-$5022, respectively. The error on the spin period of RX J0420.0$-$5022 accumulates to nearly one period over the 2 day gap between the first two observations. This is too large to be able to phase-connect the observations as it was originally one aim of the proposal where the gaps between the observations were optimized for a spin period of 22.7 s.
| Revolution | 560 | 561 | 570 | 664 | PF [%] |
|---|---|---|---|---|---|
| 560 | 21.97 | 17.57 | 10.99 | 10.2 | |
| 561 | 98.5% | 3.68 | 14.36 | 10.0 | |
| 570 | 93.7% | 3.9% | 8.61 | 17.0 | |
| 664 | 64.2% | 84.3% | 43.1% | 13.8 |
The upper right part of the table gives the values derived from the comparison of the two pulse profiles for 10 degrees of freedom, dof (12 phase bins with two parameters for the normalization). The corresponding probability that the two light curves of a pair have different shapes is given in the lower left part.
2.4 Pulse phase resolved X-ray spectra
For RX J0420.0$-$5022 no significant changes of pulse period and pulse shape were detected. Therefore, we merged the data of the four observations and performed a test to determine a medium period assuming = 0. Light curves folded with the derived period of 3.453078 s were then produced for two different energy bands and a hardness ratio computed as ratio of the two light curves (hard band / soft band). These are shown in Fig. 5 (left). For the 0.12-0.7 keV light curve we derive (by fitting a sine wave to the pulse profile) a pulsed fraction of 12.71.8%. The pulsed fractions for the individual observations are reported in the last column of Table 5. Variations in the hardness ratio (a test for a constant hardness results in for 14 dof, corresponding to a 3.2 result) are visible with the hardness ratio maximum delayed with respect to the intensity maximum, very similar to the behaviour of RX J0720.4$-$3125 (Cropper et al. 2001; Haberl et al. 2004). The EPIC observations of RX J0420.0$-$5022 cover only 0.5 years and do not provide sufficient statistics to detect changes in the relative phasing between flux and hardness ratio, as reported for RX J0720.4$-$3125 by de Vries et al. (2004).
To further investigate the spectral variations with pulse phase we accumulated spectra of RX J0420.0$-$5022 from phases around hardness maximum and minimum (phases 0.6-1.1 and 0.1-0.6 as used in Fig. 5). The two spectra were again fitted with absorbed black-body model with and without absorption line. The results are summarized in Table 3. As in the case of the phase-averaged spectrum adding the absorption line strongly improves the fit. There is an indication for an increased temperature during the phases of higher hardness ratio, but the errors are large and more statistics is required to prove the significance of this result. In Fig. 6 the spectra are presented with the best fit model including an absorption line.
In the corresponding analysis of the merged data of RX J0806.4$-$4123 the light curves, folded on the derived period of 11.371076 s are shown in Fig. 5 (right). RX J0806.4$-$4123 exhibits the smallest pulsed fraction of the known XDIN pulsars of about 6 % which renders the detection of significant hardness ratio variations difficult. The fit of constant hardness ratio results in for 11 dof which corresponds to a probability of 79.3% (). However, it should be noted that by assuming a constant pulse period one may smear out the pulse profiles somewhat if the pulsar actually exhibits a small period change over the 2.5 years from one observation to the next. Because of the marginal variations in hardness ratio we do not perform a phase resolved spectral analysis for RX J0806.4$-$4123.

3 Optical observations
Deep optical CCD images of the field containing RX J0420.0$-$5022 were obtained under photometric conditions on November 22, 2000 with FORS1 at UT1 of the ESO VLT. Three CCD images with individual exposure times of 1200 s were taken through a Bessel B filter and two images with 600 s exposure time each through a Bessel V filter. Two bright stars in the field have been masked by movable slitlets to avoid saturation of the detector and charge spilling. The mean seeing was 0.9″ FWHM.
The images were reduced and averaged using bias images and sky flats obtained during the same observing run and with the same instrument and detector setups. Cosmic ray events were removed by applying the FILTER/COSMIC command of the ESO MIDAS software package to the averaged B- and V-filter images. An astrometrical calibration was derived from the positions of 21 field stars from the USNO-B catalog in the vicinity of RX J0420.0$-$5022.
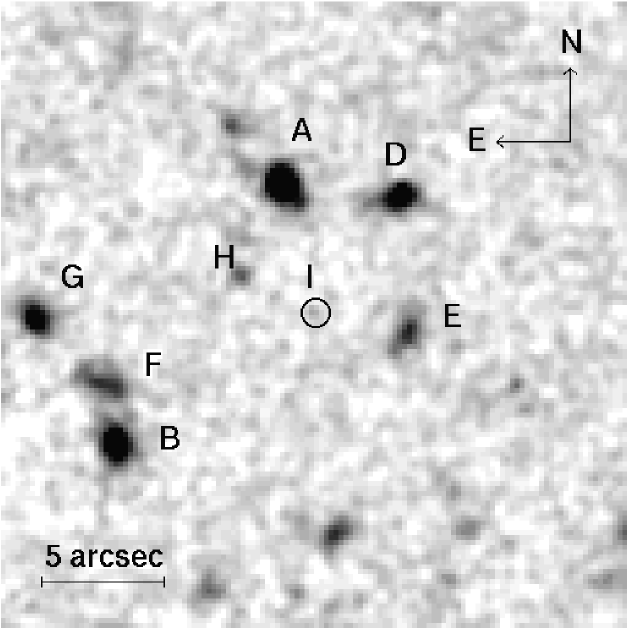
Within the error circle of the Chandra X-ray position of RX J0420.0$-$5022 a single object is marginally detected on the B-filter image (Fig. 7) with B = 26.570.30 mag. No object was found at this position on the V-filter image down to a detection limit V 25.5. Fluxes for objects A, D, E, and H from Haberl et al. (1999), the new candidate star I, and the local sky background were determined using aperture photometry. For the photometric calibration nightly zero points and extinction coefficients were used from the FORS1 quality control pages at ESO. The resulting B and V magnitudes are given in Table 6. The new B band photometry of stars A, D, E, and H is fully consistent with that given in Haberl et al. (1999). The detection and photometry of star I is adversely affected by the locally enhanced sky background due to the stray light halo of an 11 mag star at distance. The error uncertainty given for the B magnitude is the statistical error calculated from the photon statistics of the object and background fluxes. It does not include systematic uncertainties in the determination of the background flux which could be of similar order.
| Object | B [mag] | V [mag] | ||
|---|---|---|---|---|
| A | 24.40 | 0.04 | 23.46 | 0.03 |
| D | 24.88 | 0.06 | 24.38 | 0.07 |
| E | 25.33 | 0.10 | 24.74 | 0.10 |
| H | 26.11 | 0.20 | 24.95 | 0.13 |
| I | 26.57 | 0.30 | 25.5 | |
4 Discussion
XMM-Newton observations of the two isolated neutron stars RX J0420.0$-$5022 and RX J0806.4$-$4123 establish that both are X-ray pulsars with spin periods of 3.453 s and 11.371 s, respectively. RX J0420.0$-$5022 exhibits a relatively strong sinusoidal intensity modulation of 12% similar to that observed from RX J0720.4$-$3125 (Haberl et al. 1997; Paerels et al. 2001). Also, like for RX J0720.4$-$3125, the hardness ratio shows variations with pulse phase with maximum (hardest spectrum) shifted with respect to the intensity maximum (Cropper et al. 2001; Haberl et al. 2004; de Vries et al. 2004).
The light curve of RX J0806.4-4123 (Fig. 3) shows a possible deviation from a purely sinusoidal shape, with a relatively smooth rise of the pulse followed by a steeper decline. The same behaviour may also be present (although to a lower level of confidence) in the light curve of RX J0420.0-5022 (Fig. 4), and is different from what is exhibited by RX J0720.4$-$3125. The pulse profile of the latter source appears, in fact, quite symmetric with respect to the pulse maximum/minimum (Haberl et al. 2004). An asymmetric (skewed) pulse profile hints towards a surface temperature distribution more complex than the (symmetric) one implied by a simple dipolar magnetic field (Page 1995; Page & Sarmiento 1996). If what we are observing is the thermal emission from the entire star surface, the simplest explanation would be to invoke the presence of higher order multipolar components in the magnetic field of these objects.
The pulse phase averaged X-ray spectra of both pulsars investigated here are not very well fit by an absorbed Planckian model. The derived black-body temperature of 96 eV for RX J0806.4$-$4123 is among the highest observed from this group of ROSAT discovered isolated neutron stars. The temperature kT of 45 eV inferred for RX J0420.0$-$5022, which could only roughly be estimated from the ROSAT PSPC spectrum (Haberl et al. 1999), on the other hand, is the lowest value observed to date Haberl (2004). Adding a Gaussian-shaped absorption line to the continuum model improves the spectral fits for both objects, suggesting that there may be broad absorption features present in the X-ray spectra similar to RBS1223 (Haberl et al. 2003), RX J1605.3+3249 (van Kerkwijk et al. 2004) and RX J0720.4$-$3125 (Haberl et al. 2004). If interpreted as proton cyclotron absorption lines (as supported by the agreement between the magnetic field strengths independently inferred from spin-down measurement and cyclotron energy in the case of RX J0720.4$-$3125, see Cropper et al. 2004) the inferred energies of 330 eV and 460 eV would indicate magnetic field strengths of 6.6 G and 9.2 G for RX J0420.0$-$5022 and RX J0806.4$-$4123, respectively. However, because the residuals seen in the black-body fit to the EPIC spectra of RX J0806.4$-$4123 are similar in shape to those seen from RX J1856.4$-$3754 (Haberl et al. 2004) and the RGS spectra yield somewhat different line parameters it is not clear to which extent they are influenced by systematic calibration effects.
It is remarkable that probably up to five out of the six X-ray dim isolated neutron stars detected in the ROSAT all-sky survey, show broad absorption lines with central energies in the range of 200 eV (only an upper limit of 300 eV was found for RBS1223, Haberl et al. 2003) to 450 eV (RX J1605.3+3249, van Kerkwijk et al. 2004). An interpretation in terms of fundamental lines of a proton cyclotron emission implies surface magnetic fields in the relatively narrow range of B = 3-7 1013 (1+) G, with 0.3 the redshift parameter. These estimates are comparable with the QED critical value B 4.4 G, that is expected to quench pulsar activity. The upper B value could simply reflect the lower sensitivity to line detection in the Wien part of the spectrum. Were these stars active pulsars, the spin periods of the order of 10 s observed in some sources imply that any radio pencil beam should be very narrow (Biggs 1990) and the chances then high that it does not sweep over the Earth. Magnetic field strengths below the critical value would still be compatible with the presence of cyclotron lines if some of the detected features are higher order harmonics. Unfortunately, little is known about harmonics to fundamental line ratios. All opacities given so far for proton cyclotron lines have been computed neglecting the contribution of higher harmonics and the absence of such lines in model atmospheres does not mean that they should not be observable. In the illustrative but still unique case of 1E 1207.4-5209 (Bignami et al. 2003; De Luca et al. 2004), the line equivalent widths of the various components (65 - 100 eV) do not vary much with central energy (690 to 2800 eV). Harmonic lines with similar equivalent widths could be missed in the very soft spectrum of RX J0420.0$-$5022, or maybe in the case of RX J1605.3+3249, with the highest line energy, but would have been detected in RBS1223 and RX J0720.4$-$3125.
In the magnetic field and temperature conditions prevailing in XDINs, hydrogen atmospheres could be partly ionized as a result of the much increased ionization potential at large B (see, e.g., Zavlin & Pavlov 2002, and references therein). Bound-free and bound-bound transitions occur at energies which can be made comparable to those of the lines observed in XDINs. Since atomic line energies vary more slowly with magnetic field than cyclotron lines do, a larger range of surface magnetic fields could in principle be allowed. The main constraint of this interpretation is that the proton cyclotron line should be located outside of the observable energy range, i.e., at E 100 eV, implying surface magnetic fields below 21013G. Model atmospheres by Ho et al. (2003) show that at B = 1013G, the s0-s2 transition at E 180 eV and the H ionization edge at E 250 eV could both contribute to some of the observed lines. At higher energies, heavier elements could play a role (Hailey & Mori 2002). On the other hand, at such strong magnetic fields (3 G) and rather low surface temperatures ( K) the neutron star surface may be in a solid or condensed state. At present, only a first step has been undertaken in studying radiative properties of such surfaces (Zane et al. 2004; Turolla et al. 2004).
The precise X-ray position of RX J0420.0$-$5022 obtained with Chandra allowed us to identify a possible optical counterpart on a deep VLT B band image. The shorter V band exposure is not sensitive enough to provide colour information which could be used to support the identification. However, the extrapolation of the X-ray spectrum into the optical results in a factor of 12.3 (or smaller if our identification is wrong) lower flux than actually is observed in the B band. Similar optical ‘excess’ in the spectral energy distribution is seen from all optical counterparts (and candidates) identified so far (factor 14 for RX J1605.3+3249 (Kaplan et al. 2003a), 4.9 for RBS1223 (Kaplan et al. 2002), 2.4 with an additional component increasing with wavelength for RX J0720.4$-$3125 (Kaplan et al. 2003b) and 7 for RX J1856.4$-$3754 (Burwitz et al. 2003, based on the spectral parameters derived from the LETGS X-ray spectrum). Understanding the overall spectral energy distribution of XDINs from radio to X-ray wavelength will be crucial to derive a comprehensive model of the emission properties if this group of neutron stars.
Acknowledgements.
The XMM-Newton project is supported by the Bundesministerium für Bildung und Forschung / Deutsches Zentrum für Luft- und Raumfahrt (BMBF / DLR), the Max-Planck-Gesellschaft and the Heidenhain-Stiftung.References
- Aldcroft et al. (2000) Aldcroft, T. L., Karovska, M., Cresitello-Dittmar, M. L., Cameron, R. A., & Markevitch, M. L. 2000, in Proc. SPIE, X-Ray Optics, Instruments, and Missions III, Joachim E. Trümper; Bernd Aschenbach; Eds., Vol. 4012, 650
- Aschenbach et al. (2000) Aschenbach, B., Briel, U. G., Haberl, F., et al. 2000, in Proc. SPIE, X-Ray Optics, Instruments, and Missions III, Joachim E. Trümper; Bernd Aschenbach; Eds., Vol. 4012, 731
- Biggs (1990) Biggs, J. D. 1990, MNRAS, 245, 514
- Bignami et al. (2003) Bignami, G. F., Caraveo, P. A., Luca, A. D., & Mereghetti, S. 2003, Nature, 423, 725
- Buccheri et al. (1983) Buccheri, R., Bennett, K., Bignami, G. F., et al. 1983, A&A, 128, 245
- Burwitz et al. (2003) Burwitz, V., Haberl, F., Neuhäuser, R., Predehl, P., Trümper, J., & Zavlin, V. E. 2003, A&A, 399, 1109
- Cropper et al. (2004) Cropper, M., Haberl, F., Zane, S., & Zavlin, V. E. 2004, MNRAS, in press (astro-ph/0403380)
- Cropper et al. (2001) Cropper, M., Zane, S., Ramsay, G., Haberl, F., & Motch, C. 2001, A&A, 365, L302
- De Luca et al. (2004) De Luca, A., Mereghetti, S., Caraveo, P. A., et al. 2004, A&A, 418, 625
- de Vries et al. (2004) de Vries, C. P., Vink, J., Méndez, M., & Verbunt, F. 2004, A&A, 415, L31
- den Herder et al. (2001) den Herder, J. W., Brinkman, A. C., Kahn, S. M., et al. 2001, A&A, 365, L7
- Gänsicke et al. (2002) Gänsicke, B. T., Braje, T. M., & Romani, R. W. 2002, A&A, 386, 1001
- Gregory & Loredo (1996) Gregory, P. C. & Loredo, T. J. 1996, ApJ, 473, 1059
- Haberl (2004) Haberl, F. 2004, Adv. Space Res., 33, 638
- Haberl et al. (1997) Haberl, F., Motch, C., Buckley, D. A. H., Zickgraf, F. J., & Pietsch, W. 1997, A&A, 326, 662
- Haberl et al. (1998) Haberl, F., Motch, C., & Pietsch, W. 1998, Astronomische Nachrichten, 319, 97
- Haberl et al. (1999) Haberl, F., Pietsch, W., & Motch, C. 1999, A&A, 351, L53
- Haberl et al. (2003) Haberl, F., Schwope, A. D., Hambaryan, V., Hasinger, G., & Motch, C. 2003, A&A, 403, L19
- Haberl & Zavlin (2002) Haberl, F. & Zavlin, V. E. 2002, A&A, 391, 571
- Haberl et al. (2004) Haberl, F., Zavlin, V. E., Trümper, J., & Burwitz, V. 2004, A&A, 419, 1077
- Hailey & Mori (2002) Hailey, C. J. & Mori, K. 2002, ApJ, 578, L133
- Ho et al. (2003) Ho, W. C. G., Lai, D., Potekhin, A. Y., & Chabrier, G. 2003, ApJ, 599, 1293
- Jansen et al. (2001) Jansen, F., Lumb, D., Altieri, B., et al. 2001, A&A, 365, L1
- Kaplan et al. (2002) Kaplan, D. L., Kulkarni, S. R., & van Kerkwijk, M. H. 2002, ApJ, 579, L29
- Kaplan et al. (2003a) —. 2003a, ApJ, 588, L33
- Kaplan et al. (2003b) Kaplan, D. L., van Kerkwijk, M. H., Marshall, H. L., et al. 2003b, ApJ, 590, 1008
- Motch (2001) Motch, C. 2001, in X-ray Astronomy, Stellar Endpoints, AGN, and the Diffuse X-ray Background, AIP Conference Proceedings, 244
- Paerels et al. (2001) Paerels, F., Mori, K., Motch, C., et al. 2001, A&A, 365, L298
- Page (1995) Page, D. 1995, ApJ, 442, 273
- Page & Sarmiento (1996) Page, D. & Sarmiento, A. 1996, ApJ, 473, 1067
- Pavlov et al. (1996) Pavlov, G. G., Zavlin, V. E., Trümper, J., & Neuhäuser, R. 1996, ApJ, 472, L33
- Strüder et al. (2001) Strüder, L., Briel, U., Dennerl, K., et al. 2001, A&A, 365, L18
- Treves et al. (2000) Treves, A., Turolla, R., Zane, S., & Colpi, M. 2000, PASP, 112, 297
- Turner et al. (2001) Turner, M. J. L., Abbey, A., Arnaud, M., et al. 2001, A&A, 365, L27
- Turolla et al. (2004) Turolla, R., Zane, S., & Drake, J. J. 2004, ApJ, 603, 265
- van Kerkwijk et al. (2004) van Kerkwijk, M. H., Kaplan, D. L., Durant, M., Kulkarni, S., & Paerels, F. 2004, ApJ, in press (astro-ph/0402418)
- Walter & Matthews (1997) Walter, F. M. & Matthews, L. D. 1997, Nature, 389, 358
- Zane et al. (2004) Zane, S., Turolla, R., & Drake, J. J. 2004, Advances in Space Research, 33, 531
- Zavlin & Pavlov (1998) Zavlin, V. E. & Pavlov, G. G. 1998, A&A, 329, 583
- Zavlin & Pavlov (2002) Zavlin, V. E. & Pavlov, G. G. 2002, in Neutron Stars, Pulsars, and Supernova Remnants, Eds. W. Becker, H. Lesch and J. Trümper, MPE-Report 278, 263
- Zavlin et al. (2004) Zavlin, V. E., Pavlov, G. G., & Sanwal, D. 2004, ApJ, 606, 444