Exploring the Nucleus of the Gigamaser Galaxy TXS 2226-184
Abstract
We present Very Long Baseline Array (VLBA) observations of the Gigamaser galaxy TXS2226-184 at 1.3 and 5 GHz. These observations reveal the parsec-scale radio structure of this Seyfert galaxy with exceptionally luminous water maser emission. The source is found to be extended on scales of 10-100 pc with some embedded compact sources, but has no readily identifiable flat-spectrum active nucleus. This morphology resembles that of the nearby compact starburst galaxy Mrk 273, although no significant FIR emission has been detected to support the starburst scenario. The narrow (125 km s-1) Hi absorption in TXS2226-184 discovered with the VLA is also detected with the VLBA. This Hi absorption is distributed across the extended emission, probably co-spatial with the water masers. The broad (420 km s-1) line seen by the VLA is not detected, suggesting that it arises from more extended gas which is absorbing the emission beyond the central tens of parsecs.
1 Introduction
Galaxies with luminous water masers in their nuclear regions have been keenly sought after in recent years (e.g., Braatz, Wilson & Henkel 1997) following the discovery of the masers in close orbit around the nucleus of NGC 4258 (Miyoshi et al. 1995, Greenhill et al. 1995). This system provided some of the earliest and strongest evidence for the presence of a supermassive black hole in the nucleus and led to a direct distance measurement to NGC 4258 which has helped to refine the extragalactic distance scale (Herrnstein et al. 1999).
The water maser emission in TXS 2226-184 was discovered by Koekemoer et al. (1995) using the Effelsberg telescope. This system hosts the most luminous known extragalactic H2O maser source, a so-called “gigamaser”, with an isotropic luminosity in the 22 GHz line of 6100 L⊙ (Koekemoer et al. 1995). The water maser emission from TXS 2226-184 is fairly broad, with a FWHM of 88 km s-1, in contrast to most known extragalactic water masers with linewidths of only a few km s-1. VLBI observations by Ball et al. (2004, in preparation) reveal that the masers are distributed in clumps that trace a disk oriented in position angle 65∘, about 30 degrees tilt away from the major axis of the galaxy. One blueshifted maser appears significantly offset from this disk, which may indicate that it is associated with the jet.
Recent HST observations by Falcke et al. (2000) classify the galaxy as a highly inclined spiral and reveal a dust lane cutting across the nucleus. Falcke et al. (2000) also present VLA observations at 8.4 GHz showing that the radio emission is compact ( 1″), symmetric, and has an axis perpendicular to the dust lane. No larger-scale diffuse emission is present to the sensitivity limits of the NRAO VLA Sky Survey (NVSS) at about 2 mJy beam-1 (Fig. 2; Condon et al. 1998).
There is a fair amount of overlap in the occurance (40%) between extragalactic H2O maser systems and Hi found in absorption (Taylor et al. 2002). The Hi can be used to study the dynamics near the central engine of active galaxies, illuminating the process of accretion and jet propagation near a massive black hole. For this reason Taylor et al. (2002) undertook a study of the Hi gas in TXS 2226-184 with the VLA and discovered that it consists of two components – one with a width of 125 km s-1, and another broader feature of width 420 km s-1. Both velocity components are found toward the compact radio source in the nucleus of the galaxy, co-spatial within the uncertainties with the water masers. Taylor et al. suggested that the narrow line might be indicative of an interaction between the radio jet and the surrounding material.
In this study we make use of VLBI observations that resolve the radio continuum in the central 0.5 kpc, and also spatially resolve the Hi absorption. We use this information to better characterize the nature of this system and to determine the powering mechanism for the exceptionally luminous maser emission.
Throughout this discussion, we assume H0=71 km s-1 Mpc-1, = 0.27, and = 0.73, resulting in a linear to angular scale ratio of 0.496 kpc arcsecond-1 111Derived using E.L. Wright’s cosmology calculator at http://www.astro.ucla.edu/ wright/CosmoCalc.html..
2 The VLBA Observations
The observations were made with the National Radio Astronomy Observatory222The National Radio Astronomy Observatory is operated by Associated Universities, Inc., under cooperative agreement with the National Science Foundation. Very Long Baseline Array (VLBA) and Robert C. Byrd Green Bank Telescope (GBT) at a center frequency of 1386 MHz on 2002 December 14 and 15. A total of 8.4 hours were obtained on source using 256 channels across a 16 MHz band to provide a resolution of 14 km s-1. Both right and left circular polarizations were observed. Phase calibration was obtained by short (1 min) observations of the nearby (1.98 degrees distant), moderately strong (0.25 Jy) calibrator J2236-1706 every 3 minutes. Bandpass calibration was provided by observations of J2253+1608.
Observations at 4982 MHz were carried out with the VLBA alone on 2002 December 16. A total of 2.2 hours were obtained on source with a 32 MHz bandwidth observing in right circular polarization only. Phase referencing was once again performed by switching to J2236-1706 every 3 minutes for 1 minute. We also checked the atmospheric coherence by observing J22361433 once every 38 minutes.
3 Results
3.1 MERLIN Continuum Images
Data at 5 GHz from observations of the TXS 2226-184 field were obtained from the Multi-Element Radio-Linked Interferometer Network (MERLIN) archive. These data consisted of two observing sessions, one on 1999 February 3, and another on 1999 March 3. In each session 6 antennas participated for a total of 4.2 and 4.9 hours on source in February and March respectively. Calibration of these data was performed in the standard fashion in AIPS using the nearby calibrator J2232-1659 observed every 7 minutes. Data from the two days were combined and then imaged using Difmap. The rms noise in the total intensity image is 0.085 mJy beam-1.
At the MERLIN resolution of 40 179 mas TXS 2226-184 is dominated by a compact core, but shows jet-like extensions to the northwest and southeast (Fig. 1). The compact core has a peak flux density at 5 GHz of 13.6 mJy. The orientation of the jets at 144∘ is in excellent agreement with the the elongation angle of 145∘ seen in the 22 GHz VLA observations (Taylor et al. 2002) with resolution 390 210 mas. In the MERLIN image we find a total of 31.1 0.93 mJy compared to 32.2 0.98 detected by the VLA (Taylor et al. 2002). A little less than half of this emission, 13.6 mJy, is in the compact core with a size of 45 mas.
3.2 VLBA Continuum Images
Starting with the phase referenced VLBA+GBT image at 1.4 GHz from the standard calibration in AIPS, we performed phase self-calibration in Difmap. In Fig. 2 we show the 1.4 GHz continuum emission from TXS 2226-184 at resolutions of 20 12 mas and 45 mas. Both images were made using natural weighting and applying a taper to downweight the longest spacings. Only 35 mJy, about half the flux density of the 73.3 mJy compact VLA core, is successfully recovered in these images. Besides a bright and resolved region of diameter 0.1 arcseconds, there is diffuse emission to the northwest along a position angle of 36∘. This agrees well with the VLA and MERLIN orientations on somewhat larger scales (see Fig. 1). The milliarcsecond-scale emission is broken up into clumps, most likely as a result of difficulties of the clean algorithm in recovering the extended emission. A multi-resolution clean was attempted in AIPS, but did not recover more flux density or produce a better image. The MERLIN image at 5 GHz shows diffuse emission on scales of 0.3 arcseconds that we do not resolve with the VLA, but probably over-resolve with the VLBA. The rms noise in the VLBA continuum image is 50 microJy/beam in the high resolution image and 100 microJy/beam in the 45 mas image owing to the heavier taper applied.
The rms noise at 5 GHz is 100 microJy/beam, and the peak in the map is 500 microJy. While there is a suggestion of some flux density on the shortest baselines, no sources are reliably detected. From our phase referencing check source, J22361433, we estimate the coherence to be greater than 50%. We place an upper limit of 1 mJy beam-1 as the strongest unresolved source that could go undetected at 5 GHz. An attempt to combine the VLBA and MERLIN data was made, but owing to the lack of signal on the VLBA baselines, this was unsuccessful.
3.3 The Hi Absorption
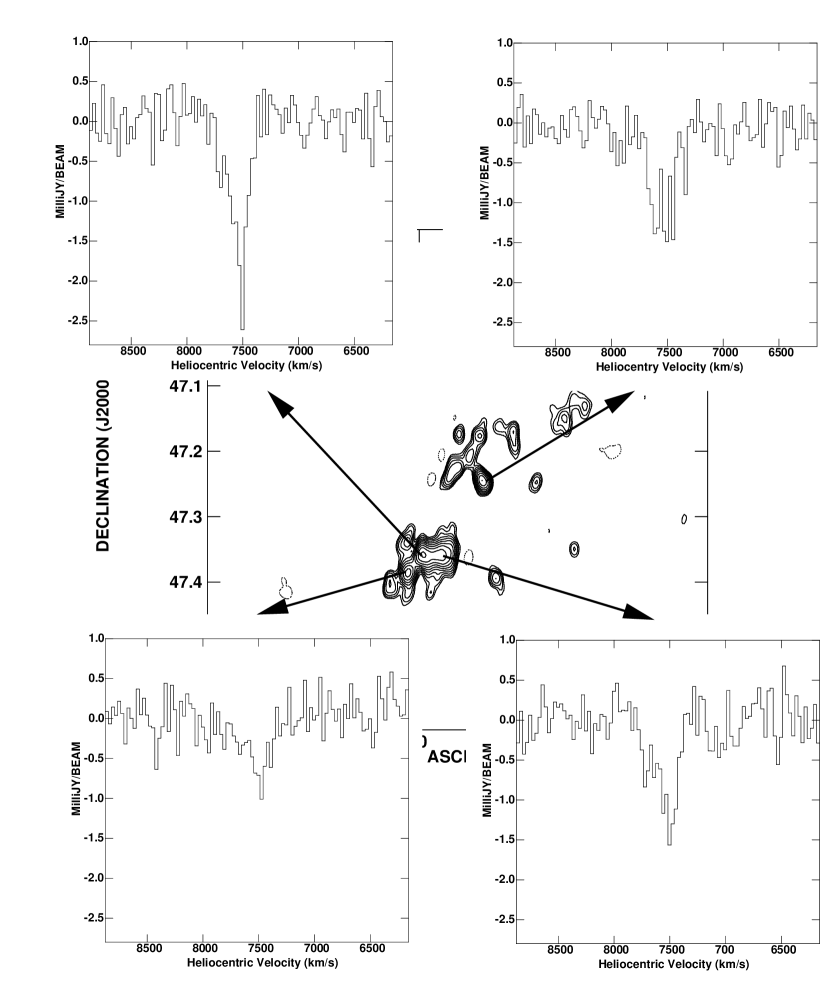
In Fig. 3 we show Hi spectra for four of the brightest regions in the high resolution image. The continuum level has been subtracted from the spectral line cube. The spectra have been Hanning smoothed and averaged to a velocity resolution of 23.98 km s-1. The absorption peaks in all spectra at 7500 km s-1 in the heliocentric frame. In the region of highest SNR the absorption has a depth of 2.6 mJy, and a FWHM of 125 km s-1. There is a hint of an additional component around 7700 km s-1 in all but the weakest profile.
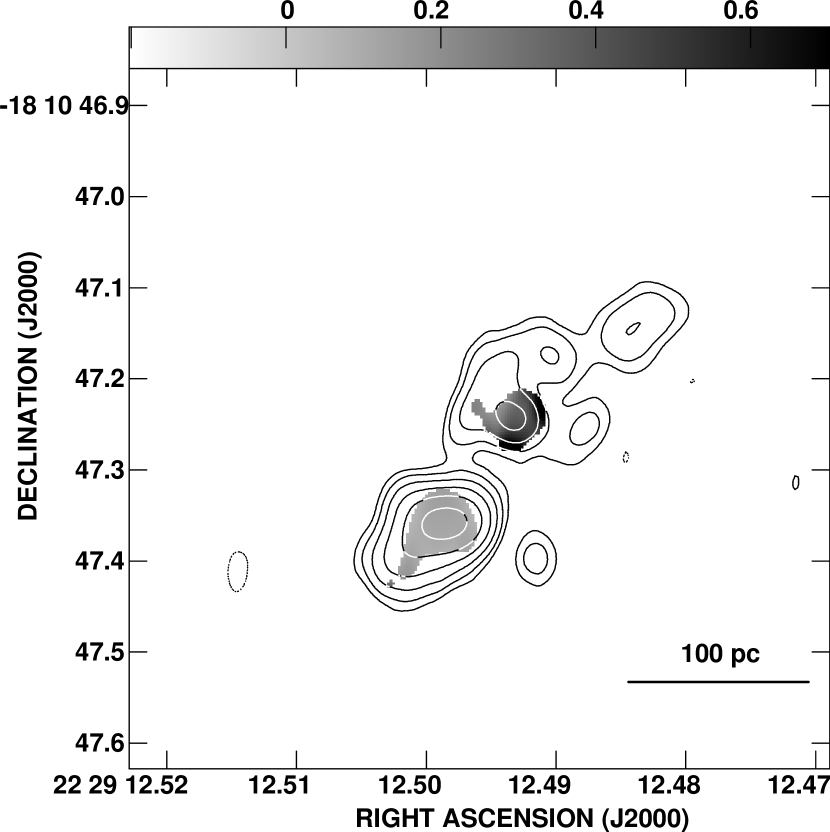
We have created an image of the integrated optical depth over the line by averaging 24 channels centered on the peak absorption using the cube with 45 mas spatial resolution (Fig. 4). We find a marginally significant increase in the optical depth from 0.15 0.04 to 0.34 0.08.
Finally, we have searched for gradients in velocity by averaging in the direction perpendicular to the major axis of the source. To do this we rotated the cube spatially by 55∘ and then averaged over the source in declination. A position-velocity plot from this averaged cube is shown in Fig. 5. No significant gradient in velocity is seen.
3.4 Location of the Neutral Hydrogen Gas
Based on the VLA observations, Taylor et al. concluded that the 420 km s-1 wide absorption feature with a depth of 5.6 mJy probably results from neutral material associated with the atomic and molecular torus thought to feed the active nucleus, and that the deeper 125 km s-1 wide line in TXS 2226-184 could be indicative of an interaction between the radio jet and surrounding material. If the supposition about the nature of the broad line were correct, then a compact nucleus with at least 5.6 mJy should have been visible in the 1.4 GHz continuum image. The peak in the full resolution image (not shown) is only 2.4 mJy. From the absence of any broad-line absorption in our VLBI spectra we conclude that the broad line originates from emission on spatial scales of 0.3 arsec that are not probed by our VLBA observations. Similarly, a 1000 km s-1 wide blue-shifted line seen in the WSRT spectrum towards 3C 293 (Morganti et al. 2003) was not detected on the parsec-scale by Beswick et al. (2004). Another example of broad lines resolving out on the parsec-scale can be found in 4C12.50 (Morganti et al. 2004). Morganti et al. (2003) speculate that the broad line arises from outflow of gas on kiloparsec-scales, and the same situation could be responsible for the broad line in TXS 2226-184.
The narrow (125 km s-1) and deeper (12.3 mJy for the VLA) Hi line in TXS 2226-184 has a similar width and velocity dispersion to the water masers and could originate from the same region. The lack of any significant velocity gradient in the Hi observations is consistent with this interpretation.
Another possibility is that we are seeing multiple Hi clouds from throughout the spiral host galaxy along the line-of-sight toward the nucleus. In this case the Hi gas would not be associated with the nucleus or the water masers. The marginally significant change in Hi opacity across the source (see Fig. 4) argues against this possibility since the average Hi absorption from the host galaxy is unlikely to change on scales as small as 100 pc.
4 Nature of the Continuum Emission and Water Masers
Observationally, extragalactic water masers can be separated into three categories based on their line widths, luminosities and distribution of masing regions. One class, with narrow linewidths of a few km s-1, and isotropic luminosities 100 L⊙, is most frequently associated with the accretion disk around an AGN (e.g., NGC 4258 , Miyoshi et al. 1995). The second, possibly less common, class of masers is characterized by broader linewidths of 100 km s-1, and luminosities in the range 100-3000 L⊙ (e.g., Mrk 348, Peck et al. 2003; NGC 1052, Claussen et al. 1998). The third, recently identified class are weaker, 10 L⊙, masers with narrow linewidths (e.g., NGC 2146, Tarchi et al. 2002). The criteria for characterizing the different classes of masers are outlined in Peck et al (2004).
Assuming that the masing region completely covers the radio emitting core at 22 GHz, Koekemoer et al. (1995) found that the required maser amplification in TXS 2226-184 is a factor of 20. If the maser covers less of the continuum source then the amplification must be even greater. In this section we consider three scenarios to explain the nature of the radio emission and the extragalactic water masers in TXS 2226-184.
4.1 Case 1: A Compact Starburst
The clumpy, steep-spectrum radio morphology of TXS 2226-184 on the parsec scale (Fig. 2) is reminiscent of the starburst galaxies Mrk 231 and Mrk 273 (Carilli, Wrobel, & Ulvestad 1998, Carilli & Taylor 2000), which also contain active galactic nuclei. Given the steep spectrum of the overall emission in TXS 2226-184, the individual components could be radio supernovae, or clusters of SNe. The H2O emission and Hi absorption likewise are found to occur on similar spatial scales in these prominent starburst systems.
A significant problem with the starburst scenario is the low infrared luminosity. As listed in the NASA/IPAC Extragalactic Database (NED), TXS 2226-184 is not detected by IRAS at 12, 25 and 100 microns, and is only 309 59 mJy at 60 microns. Given the distance to the source this corresponds to a power at 60 microns of 4.15 1023 W/Hz. Scaling the starburst emission models of Rice et al. (1988) we get . This corresponds to a star formation rate of just 0.178 M⊙/yr (Heckman et al. 1990), far below what is found in even the weakest starburst galaxies. One can also ask the question of how well this system obeys the well established radio-far IR correlation (Condon 1992). The integrated radio power at 1.4 GHz is W/Hz. We find a logarithmic ratio of FIR to radio power, Q=2.3, compared to the average value of 2.3 0.2 (Condon 1992). At present, given the anomalous nature of these findings, we cannot rule out the possibility that there is some error in the IRAS measurement, so we plan to undertake new IR observations to confirm the value.
That we could be seeing individual supernovae in TXS 2226-184 is unlikely since Cas A would have a flux density of only 1 Jy at the distance of TXS 2226-184, although young radio supernovae might have powers 100 – 1000 times that of Cas A (Weiler et al. 2002; Neff et al. 2004). However, we would expect them to have some reasonable flux at 5 GHz if they are young enough to have such high brightness temperature, so the lack of any detection at 5 GHz argues against the supernova hypothesis. The distribution of the radio emission perpendicular to the major axis is also not readily explained by SNe.
It is possible that this source could be a “post-starburst” object in which the diffuse radio emission was created by a starburst. Koekemoer et al. (1995) refer to unpublished observations that suggest an optical continuum dominated by a “post-starburst” stellar population. Assuming minimum energy conditions apply, the fairly high field derived, = 630 G, together with the observed spectral index of 0.66 between 1.4 and 5 GHz, implies an age of the radio source of only 14,000 years (Myers & Spangler 1985). If the radio source is considerably older then some reacceleration process must be at work. Over the 108 years since the starburst one might expect the radio source to have become much less collimated than we currently observe. We conclude that the small amount of star formation taking place in TXS 2226-184 is unlikely to produce the majority of the radio continuum emission. It is also difficult to see how this low amount of star formation could provide the shocks necessary to create the conditions for masing.
4.2 Case 2: Amplification of a Background AGN
The parsec-scale radio emission is elongated in the same direction as the kiloparsec-scale emission, and is perpendicular to the major axis of the host galaxy and the inner dust disk (Falcke et al. 2000). The symmetric structure and tight collimation of the outflow in TXS 2226-184 suggests that the radio continuum is produced by jets oriented at a large angle to the line-of-sight propagating perpendicular to the accretion disk. Falcke et al. also find that the radio emission is aligned with H + [N II] emission and suggest that this Narrow Line Region (NLR) is produced by the interaction between the radio jet and the interstellar medium (Falcke, Wilson & Simpson 1998). Koekemoer et al (1995) note that the optical spectrum of the nucleus has line ratios typical of a low-ionization nuclear emission region (LINER) spectrum. The optical spectrum and the presence of jets suggest the presence of an active nucleus.
An examination of the radio continuum emission reveals no obvious compact, flat spectrum source readily identifiable with the nucleus. At 5 GHz we can use the limiting flux density of 1 mJy to put an upper limit on the core radio power at 5 GHz of 1.4 1021 W/Hz. This core power is lower than all but a few low luminosity radio sources in the Complete Bologna Sky Survey (Giovannini et al. 2004) despite the fact that the radio power of W/Hz at 365 MHz is only about an order of magnitude below the average total power in a complete sample of radio galaxies. From this we can conclude that the core is extremely underluminous. This could imply subrelativistic ejection and/or an angle very close to the plane of the sky. Alternatively, the core could be heavily obscured by free-free absorption. Since the free-free absorption from an external screen decreases exponentially with frequency, further sensitive, high-frequency VLBI observations might detect an obscured, flat-spectrum nucleus. Such a heavily absorbed nucleus might also make a significant contribution to the total flux density at high frequencies. There is no indication of any flattening in the spectrum up to 22 GHz (Taylor et al. 2002), from which we place a limit on the contribution of any flat spectrum component of 10% or mJy. Ball et al. (2004, in preparation) place a limit of 2 mJy on any compact continuum emission at 22 GHz. If the masers are limited to the central few parsecs around a low-power core then the amplification needed will be 600. Alternatively, the X-ray illumination provided by the AGN may create a disassociation region and power the maser directly (Neufeld, Maloney, & Conger 1994). Koekemoer et al. (1995) find that this model can account for the maser luminosity of TXS 2226-184 if the illuminated disk is 2.5 – 7.5 pc in radius. Ball et al. (2004, in preparation) find a disk of radius 5 pc, but do not rule out the possibility that some of the components are associated with the radio jet.
4.3 Case 3: Shocks Driven by a Jet
As already established in the previous section, it is likely that there are bidirectional jets in TXS 2226-184. The peak radio flux density at 1.4 GHz in TXS 2226-184 is 3.6 mJy. The brightness temperature of this emission is 1.4 K. This, and the steep spectrum of the integrated emission ( from Taylor et al. 2002, where ) clearly indicates non-thermal emission.
A possible explanation for the luminous water masers in TXS 2226-184 is from shocks produced by a jet driving into a molecular cloud, though if this is to explain all the masers then the jet needs to bend through 60 degrees in order to line up with the jet seen on scales of 10-1000 pc (Ball et al. 2004, in preparation). The situation may be comparable to that in Mrk 348, a Seyfert galaxy at a distance of 62.5 Mpc which hosts an H2O megamaser (Peck et al. 2003). In Mrk 348, the maser appears to be caused by the radio jet impacting a molecular cloud within the central few parsecs of the galaxy. This interaction gives rise to an expanding bow-shock driven into the cloud which has a velocity between 135 km s-1 and 0.5c in the direction of jet propagation, and between 35 km s-1 and 300 km s-1 at various points along the oblique edges (Peck et al. 2003). This shock generates a region of very high temperature, (105 K), which dissociates the molecular gas and to some extent shatters the dust grains expected to be present and/or evaporates their icy mantles. Immediately following this shock, H2 begins forming on the surviving dust grains when the temperature has dropped to 1000 K, and this in turn provides sufficient heating to stabilize the temperature at 400 K, with gas densities of 108 cm-3 (e.g., Mauersberger, Henkel & Wilson 1987; Elitzur 1995). In Mrk 348, the pc-scale radio jet is significantly brighter than that in TXS 2226-184, but it is possible that a weaker jet could result in stronger amplification than a powerful jet, given that it is the regions of oblique shocks, with velocities lower than 300 km s-1, which provide post-shock conditions leading to a significant volume of masing gas.
This possibility has also been explored for another Seyfert galaxy, NGC 1068. A similar luminosity, linear radio emission extending over 1” is seen in NGC 1068 (Gallimore, Baum, & O’Dea 1996). In this well-studied source Gallimore et al. find a bending jet and local flattening of the spectral index which lends support to this model.
One of the chief diagnostics of this type of maser is the shape and width of the emission line (Peck et al 2004), given that jet and accretion disk geometry can be very difficult to decipher at large distances using the distribution of H2O spots and Hi absorption, even with extremely high angular resolution. The FWHM of the maser emission in TXS 2226-184 is 88 km s-1, much closer to the 130 km s-1 FWHM measured in Mrk 348 than to the narrower lines associated with masers known to arise in accretion disks. Nonetheless, we look forward to higher dynamic range VLBA and Expanded VLA images to assist in testing this model in TXS 2226-184.
5 Conclusions
Our observations show that on parsec scales the continuum emission from an active nucleus in TXS 2226-184 is extremely weak. Most of the emission originates from a jet which extends over 100 pc. Hi absorption is detected against this jet with a marginal change in opacity, but no sign of rotation or outflow. The water masers may amplify either a weak nucleus, or extended jet emission. In either case, high amplification factors () are needed.
Given the extreme luminosity of the water masers in TXS 2226-184 and their broad line widths, it is tempting to ascribe this and similar systems (e.g., Mrk 348, NGC 1052) with jets that drive shocks into molecular clouds. Our high-resolution radio continuum observations are consistent with this picture. Identifications of more systems, and detailed studies of time-variability in the masers and continuum emission are needed.
VLBI observations of the water masers will help to understanding the nature of this system, though the preliminary analysis indicates that the situation is complicated with both disk and jet masers present (Ball et al. 2004, in preparation). Single dish observations could also yield important clues by looking for rapid variations in the flux density of the maser line, and correlating them with changes in the continuum flux density to test the idea that the masers amplify the background continuum.
References
- (1)
- (2) Ball, G. H., Greenhill, L. J., Moran, J. M., Henkel, C., & Zaw, I. 2004, in preparation
- (3)
- (4) Beswick, R. J., Peck, A. B., Taylor, G. B., & Giovannini, G. 2004, MNRAS, in press
- (5)
- (6) Braatz, J. A., Wilson, A. S. & Henkel, C. 1996, ApJS, 106, 51
- (7)
- (8) Braatz, J. A., Wilson, A. S. & Henkel, C. 1997, ApJS, 110, 321
- (9)
- (10) Carilli, C. L., Wrobel, J. M., & Ulvestad, J. S. 1998, AJ, 115, 928
- (11)
- (12) Carilli, C.L., & Taylor, G.B. 2000, ApJ, 532, L95
- (13)
- (14) Claussen, M. J., Diamond, P. J., Braatz, J. A., Wilson, A. S. and Henkel, C. 1998, ApJL, 500, 129
- (15)
- (16) Condon, J. J. 1992, ARA&A, 30, 575
- (17)
- (18) Condon, J.J., Cotton, W.D., Greisen, E.W., Yin, Q.F., Perley, R.A., Taylor, G.B., & Broderick, J.J. 1998, AJ, 115, 1693
- (19)
- (20) Elitzur, M. 1995, RMxAC, 1, 85
- (21)
- (22) Falcke, H., Wilson, A. S., & Simpson, C. 1998, ApJ, 502, 199
- (23)
- (24) Falcke, H., Wilson, A.S., Henkel, C., Brunthaler, A., & Braatz, J.A. 2000, ApJ, 530, L13
- (25)
- (26) Gallimore, J. F., Baum, S. A. and O’Dea, C. P. 1996 ApJ, 464, 198
- (27)
- (28) Giovannini, G., Taylor, G.B., Cotton, W.D., Feretti, L., Lara, L., & Venturi, T. 2004, in preparation
- (29)
- (30) Greenhill, L. J., Henkel, C., Becker, R., Wilson, T. L. & Wouterloot, J. G. A. 1995, A&A, 304, 21
- (31)
- (32) Heckman, T. M., Armus, L., & Miley, G. K. 1990, ApJS, 74, 833
- (33)
- (34) Herrnstein, J. R., et al. 1999, Nature, 400, 539
- (35)
- (36) Koekemoer, A. M., Henkel, C., Greenhill, L.J., Dey, A., van Breugel, W., Codella, C., & Antonucci, R. 1995, Nature, 378, 697
- (37)
- (38) Mauersberger, R., Henkel, C. & Wilson, T. L. 1987, A&A, 173, 352
- (39)
- (40) Morganti, R., Osterloo, T. A., Emonts, B. H. C., van der Hulst, J. M., & Tadhunter, C. M. 2003, ApJ, 593, L69
- (41)
- (42) Morganti, R., et al. 2004, A&A, in press
- (43)
- (44) Miyoshi, M., Moran, J., Herrnstein, J., Greenhill, L., Nakai, N., Diamond, P. & Inoue, M. 1995, Nature, 373, 127
- (45)
- (46) Myers, S.T., & Spangler, S.R. 1985, ApJ, 291, 52
- (47)
- (48) Neff, S.G., Ulvestad, J.S., & Jeno, S. H. 2004, ApJ, in press
- (49)
- (50) Neufeld, D. A. & Maloney, P. R., & Conger, S. 1994, ApJ, 436, 127
- (51) 1994, ApJ, 436, 669
- (52)
- (53) Peck, A. B., Tarchi, A., Henkel, C, et al. 2004, in preparation
- (54)
- (55) Peck, A. B., Henkel, C., Ulvestad, J. S. et al. 2003, ApJ, 590, 149
- (56)
- (57) Rice, W., Lonsdale, C.J., Soifer, B.T., Neugebauer, G., Kopan, E.L., Lloyd, L.A., de Jong, T., & Habing, H.J. 1988, ApJS, 68, 91
- (58)
- (59) Tarchi, A., Henkel, C., Peck, A.B., Nagar, N., Moscadelli, L., & Menten, K. M. 2003, in “The Neutral ISM in Starburst Galaxies”, eds. S. Alto et al., astro-ph/0309446
- (60)
- (61) Taylor et al. 2002, ApJ, 574, 88
- (62)
- (63) Weiler, K. W., Panagia, N., Montes, M. J., & Sramek, R. A. 2002, ARA&A, 40, 387
- (64)