Shocked molecular hydrogen towards the Tornado nebula
Abstract
We present near-infrared and millimetre-line observations of the Tornado nebula (G357.7–0.1). We detected 2.12 m H2 1–0 S(1) line emission towards the suspected site of interaction with a molecular cloud revealed by the presence of an OH(1720 MHz) maser. The distribution of the H2 emission is well correlated with the nonthermal radio continuum emission from the Tornado, and the velocity of the H2 emission spans over 100 km s-1, which both imply that the H2 emission is shock excited. We also detected millimetre-lines from 12CO and 13CO transitions at the velocity of the maser, and mapped the distribution of the molecular cloud in a arcmin2 region around the maser. The peak of the molecular cloud aligns well with an indentation in the nebula’s radio continuum distribution, suggesting that the nebula’s shock is being decelerated at this location, which is consistent with the presence of the OH(1720 MHz) maser and shocked H2 emission at that location.
keywords:
masers – shock waves – ISM: clouds –ISM: individual: Tornado nebula, G357.7–0.1 - supernova remnants.1 Introduction
The inner region of our Galaxy is rich in unusual and unique sources. One such object is the Tornado nebula (G357.7–0.1, MSH 17–39), a peculiar nonthermal source with an axially symmetric morphology. Because of its filamentary structure, steep nonthermal radio spectrum and presence of significant linear polarisation, the Tornado has been classified as a supernova remnant (SNR) (Milne, 1979; Clark & Caswell, 1976; Shaver et al., 1985a; Stewart et al., 1994). Its elongated and loop-like structure was suggested to be a result of biconical flows from the progenitor star (Manchester, 1987) or an accreting binary system (Helfand & Becker, 1985; Becker & Helfand, 1985), but no associated pulsar or neutron star has been found. X-ray emission has been detected from the nebula with the Advanced Satellite for Cosmology and Astrophysics (ASCA) (Yusef-Zadeh et al., 2003) and Chandra X-ray Observatory (Gaensler et al., 2003). Although the emission from the nebula is most probably thermal, deeper observations are needed to unambiguously establish the nature of X-ray emission.
A compact source, called the ‘Eye’ of the Tornado, located about 30 arcsec west from the Tornado, has been linked to the nebula and suggested to be a high proper-motion pulsar associated with the nebula (Shull, Fesen, & Saken, 1989). However, the source was found to have a flat radio spectrum suggestive of an H ii region (Shaver et al., 1985b). Most recently, Burton et al. (2004) found 2.16 m Br emission towards the Eye which peaks at a velocity of around km s-1. These observations imply that the Eye is an isolated core where an embedded massive star is in the process of formation, and it is a foreground object to the Tornado. Hydrogen recombination lines were also detected towards the Eye at radio wavelengths (Brogan & Goss, 2003).
OH(1720 MHz) masers have been found at the northwestern tip of the Tornado (Frail et al., 1996; Yusef-Zadeh et al., 1999). When not accompanied by detectable maser emission from the other three OH ground-state transitions at 1612, 1665 and 1667 MHz, the 1720 MHz OH transition is believed to be an indicator of an interaction between SNRs and molecular clouds (e.g. Frail et al., 1996; Green et al., 1997; Lockett, Gauthier & Elitzur, 1999; Wardle, 1999; Wardle & Yusef-Zadeh, 2002). The maser in the Tornado has a velocity of km s-1, and if its distance is assumed to be more than a few hundred parsec (avoiding the distance ambiguity), a distance of 11.8 kpc is derived from the Galactic rotation curve (Fich, Blitz, & Stark, 1989). This is consistent with 21-cm H i absorption against the Tornado, which places the nebula at a distance greater than 5 kpc (Radhakrishnan et al., 1972). The magnetic field strength towards the OH(1720 MHz) maser, determined from measurements of OH-line Zeeman splitting, is 0.7 mG (Brogan et al., 2000).
We obtained near-infrared (NIR) and millimetre-line observations towards the northwestern part of the Tornado to investigate the implied interaction of the nebula and the surrounding molecular gas. We also obtained archival radio continuum data at 20 cm for a comparison. The observations are described in Section 2 and the results are given in Section 3. The results are discussed in Section 4 and summarized in Section 5.
2 Data
2.1 UNSWIRF observations
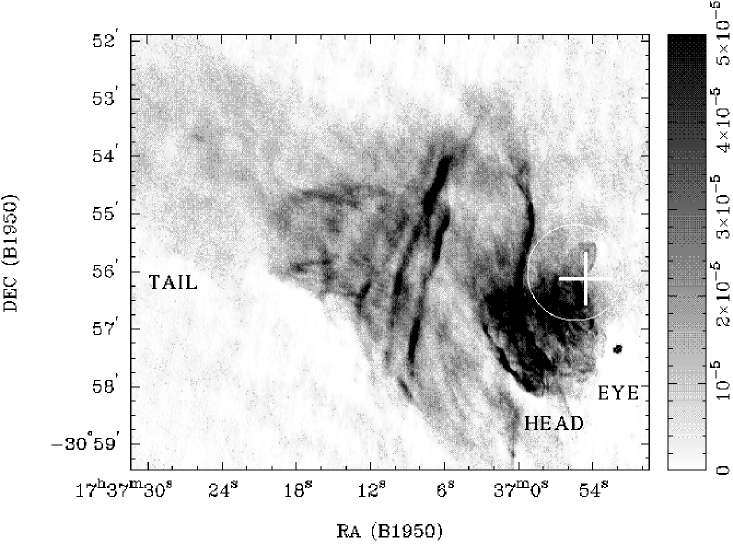
For NIR observations of the Tornado we used the University of New South Wales Fabry-Perot narrow-band tunable filter (UNSWIRF; Ryder et al., 1998) mounted on the 3.9-m Anglo-Australian Telescope during June 1999. The observations were centred near the location of the OH(1720 MHz) maser in the nebula at , . Only a small part of the Tornado was covered because the UNSWIRF aperture had a circular image of 100 arcsec in diameter with a pixel size of 0.77 arcsec. The UNSWIRF field of view is marked with a circle in Figure 1. Five frames at different Fabry-Perot settings were obtained in the 2.12 m H2 1–0 S(1) line, equally spaced by 40 km s-1 and centred on the maser velocity. The velocity resolution of the instrument was km s-1. The integration time was 180 seconds per frame. For the continuum subtraction, an additional frame was taken at a velocity setting of km s-1 from the first frame. A velocity cube, constructed from the five frames, is fitted with the instrumental Lorentzian profile to determine the H2 line parameters across the field. The H2 line flux density and line centre velocity are determined to within per cent and km s-1, respectively. The intensity was calibrated using additional observations of the standard star BS 8658. To establish the coordinate scale for the UNSWIRF image, we used the -band (2.15 m) stellar positions listed in the Two Micron All Sky Survey (2MASS) point source catalogue111see http://spider.ipac.caltech.edu/staff/hlm/2mass/calvsuc/calvsuc.html (Cutri, 1997), which are accurate to 0.1 arcsec.
2.2 SEST observations
We used the 15-m Swedish-ESO Submillimeter Telescope (SEST) during June 2000 to observe the region towards the OH(1720 MHz) maser in 12CO, 13CO, CS, HCO+, HCN and H2CO transitions between 1.3 and 3 mm. Table 1 lists the observed molecular transitions, frequencies and corresponding telescope beam widths. The spectral resolution ranged between km s-1 at 1.3 mm and km s-1 at 3 mm. The observations were performed in position-switching mode with reference position at , . The two 12CO transitions were obtained over a arcmin2 region centred at , , with a 20 arcsec grid and 30 second integration per position. For the other molecular transitions, observations were taken in a five point-cross grid centred at , , plus 20 arcsec offset. The integration times were 60 seconds for the 12CO and 13CO transitions and 180 seconds for all the other transitions.
Telescope pointing accuracy to better than 5 arcsec was maintained using periodic observations of the SiO masers associated with AH Sco and W Hyd. The data have been corrected on-line for atmospheric absorption by periodic observations of a blackbody calibration source. After baseline subtraction and Hanning smoothing, the data were scaled to main-beam brightness temperature () using the main-beam efficiencies (0.74, 0.70, 0.67 and 0.45 at 85–100 GHz, 100–115 GHz, 130–150 GHz and 220–265 GHz respectively).
2.3 VLA data
The radio continuum data were obtained from archives of the Very Large Array (VLA) of the National Radio Astronomy Observatory (NRAO). The observations of the Tornado nebula were carried out on 28 April 1991 and 13 December 1985 at 20 cm in its A and D-array configurations, respectively. Standard calibration of both data sets used 1748–253 and 3C286 as the phase and amplitude calibrators, respectively. Standard self-calibration was also applied to both data sets before the final image was constructed using the Maximum Entropy method (MEM in aips).
3 Results and analysis
The 20 cm radio image of Tornado, shown in Figure 1, has a resolution of (PA=). The image illustrates nebula’s filamentary structure and we indicate the main features – the bright western region is called the ‘Head’, which is followed by a prominent arc in the centre of the nebula and faint filaments comprising the ‘Tail’ of the nebula. The compact source near the nebula, the Eye of the Tornado, is also indicated.
3.1 H2 emission
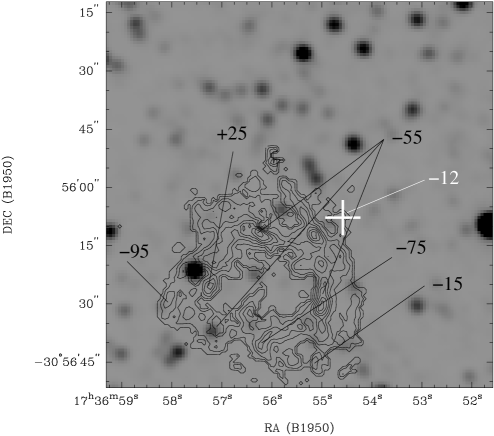
We have detected for the first time H2 line emission towards the Tornado. Figure 2 shows contours of the velocity-integrated 2.12 m H2 1–0 S(1) line emission overlaid on a greyscale image of the 2MASS -band (). The emission is ring-shaped with a diameter of arcsec, and contains a number of peaks. The emission peaks are 5–10 arcsec in size. The peak flux density of the 2.12 m H2 1–0 S(1) line emission is 1.4 erg s-1 cm-2 sr-1 and the 3 rms noise is 8 erg s-1 cm-2 sr-1; the integrated flux density of the whole source is 2.4 erg s-1 cm-2. After correcting for an assumed extinction in -band of at least (since the object is behind the Galactic centre), the peak flux density of the 2.12 m H2 1–0 S(1) line emission is 2.2 erg s-1 cm-2 sr-1, the integrated flux density is 3.8 erg s-1 cm-2, and the 2.12m H2 luminosity is 167 for distance of 11.8 kpc.
The H2 line centre velocities, marked in Figure 2 span over km s-1 across the emission region. There are 7 identifiable clumps, with velocities ranging from to +25 km s-1, with the mean velocity around km s-1. They range from 40 km s-1 blue of the mean to 70 km s-1 red of the mean. Apart from the clump at +26 km s-1, however, they are all blue-shifted from the velocity of the cloud, as determined by the CO and OH maser emission. The emission at positive velocities appears as a knot located at the south-eastern region. Unfortunately, this component was not observed with sufficient Fabry-Perot spacings to infer the red-shifted extent of its emission.
3.2 CO emission
Several 12CO and 13CO emission components at different velocities were detected along the line of sight to the Tornado nebula. Some of the features can be seen in Figure 3, which shows the 12CO 1–0 spectrum towards the position of the OH(1720 MHz) maser in the range to +15 km s-1. In Figure 4 we show the individual 12CO 2–1 spectra across a arcmin2 region of the Tornado’s Head. The (0,+20) position corresponds to the location of the OH(1720 MHz) maser. Similarly, Figure 5 shows the five 13CO 2–1 spectra, where the (0,0) position corresponds to the location of the OH(1720 MHz) maser. We have assumed that the molecular cloud associated with the Tornado nebula has a velocity close to the maser velocity ( km s-1), and the spectrum shows a CO feature near km s-1 with a linewidth of km s-1. The spectral features were fitted with Gaussian profiles and the resulting line parameters for the cloud associated with the nebula are summarised in Table 1. In contrast to the 12CO and 13CO transitions, the other molecular transitions were found to be very weak, providing only upper limits (Table 1). We found no significant line broadening ( km s-1) in the present data which would provide a clear kinematic evidence of shock interaction.
The measured line ratio was for the 1–0 transitions, and for the 2–1 transitions, which implies that the 12CO emission is optically thick. Adopting an overall isotope ratio (e.g., Langer & Penzias, 1990), we estimate an upper limit on the 12CO optical depth of for the 1–0 line. Since 12CO is optically thick, the actual 12CO 1–0/2–1 line ratio should be close to unity. Thus, by equating the two brightness temperature of the two 12CO lines, we derived a beam-deconvolved source size of arcsec. We can then calculate the actual brightness temperatures corrected for the source size from , where and are the beam and source solid angles, respectively (e.g., Jansen, van Dishoeck & Black, 1994; Rohlfs & Wilson, 1996). For the two 12CO transitions we then have K and K. To determine the temperature of the molecular gas towards the 12CO peak, we used the molecular-line excitation code with the mean escape probability (MEP) (for details see e.g., Jansen et al., 1994). Our excitation modeling of the two 12CO lines implies a kinetic temperature of K for a gas density of – cm-3. This is consistent with the fact that for an optically thick 12CO the gas temperature should be similar to the brightness temperature of the 12CO lower-energy transitions. We also estimate 12CO column density of (12CO) cm-2 from our modeling. Using the standard fractional abundance [12CO]/[H2] of (e.g., Irvine, Goldsmith, & Hjalmarson, 1987; van Dishoeck, Jansen, & Phillips, 1993) we derive (H cm-2. The upper limit of the 13CO optical depth is , and column density is 2.7 cm-2. Because of the non-detection of molecules with larger dipole moments (e.g., CS), we do not have a more reliable method to constrain the density of the molecular gas.
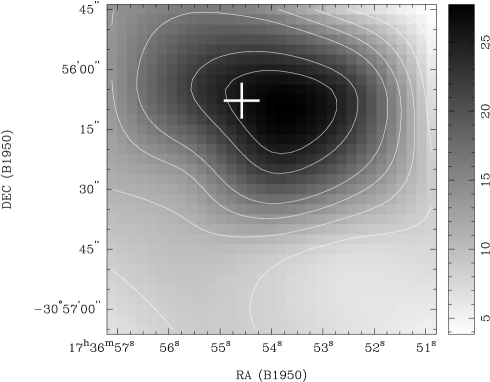
A velocity-integrated map of 12CO 2–1 emission between and km s-1 is shown in Figure 6. Since the optical depths are large, the observed 12CO distribution traces the temperature distribution rather than the column density distribution.
4 Discussion
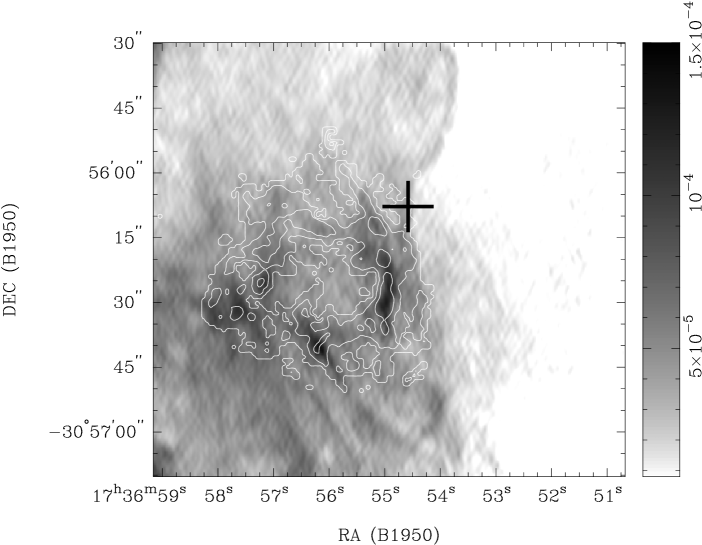
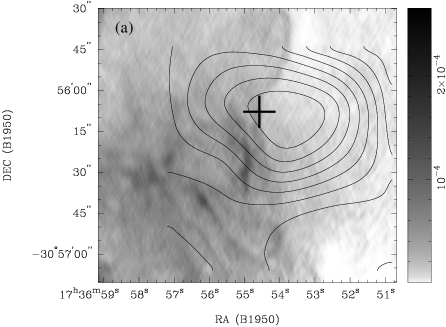
H2 emission has been studied in only a few of the known SNR masers, such as IC 443 (Burton et al., 1988), Sgr A East (Yusef-Zadeh et al., 2001) and G359.1–0.5 (Lazendic et al., 2002). The line ratio of the H2 1–0 and 2–1 S(1) transitions may be used to establish the excitation mechanism for H2 emission. Unfortunately, we were unable to obtain 2–1 S(1) observations towards the Tornado, but we argue on the basis of morphology and kinematics that the H2 emission detected towards the OH(1720 MHz) maser in the Tornado nebula is shock excited, as found in other SNR associated with OH(1720 MHz) emission (e.g., Burton et al., 1988; Lazendic et al., 2002, 2004). In Figure 7 we compare the integrated 2.12 m H2 1–0 S(1) line emission with the 20 cm radio continuum emission. In the region where the SNR encounters a dense molecular cloud the SNR shock will be decelerated, producing enhanced radio emission due to strong shock compression and enhanced particle acceleration. Both the H2 and radio continuum emission features have filamentary morphology, and there is a good correlation between the H2 and radio continuum maxima; we interpret this agreement as an indication of physical association. The bright clumps in the H2 emission represent small-scale structures in the inhomogeneous ambient medium, illuminated by the SNR shock (see e.g., Burton et al., 1988). Another argument for shock excitation is the significant velocity motion in the H2 emitting gas across the region, which is opposite to that found in fluorescent sources where velocities are essentially at the ambient velocity of the molecular cloud (Burton, Hollenbach, & Tielens, 1990). The H2 emission is also spatially coincident with extended OH(1720 MHz) emission found towards the nebula (Yusef-Zadeh et al., 1999), which is believed to be evidence of large-scale interactions between a SNR and an adjacent molecular cloud.
The molecular cloud associated with the nebula and the OH(1720 MHz) maser is optically thick, with a kinetic temperature of K, assuming a gas density of – cm-3. This temperature and density are in agreement with properties expected for the molecular cloud interacting with SNRs associated with OH(1720 MHz) masers (Lockett et al., 1999), which suggests that we are detecting mostly the pre-shock molecular gas. We did not detect the broad line profiles from the warm post-shock region, like those seen in IC 443 (van Dishoeck et al., 1993). The 50 arcsec diameter of the H2 ring is comparable to the 45 arcsec beam size at the 12CO 1–0 frequency, and we might expect to detect the warm shocked gas. Indeed, the location of the OH(1720 MHz) maser within the CO peak contour in Figure 6 indicates that we might detect contribution from both the pre-shock and post-shock gas. However, the molecular gas is optically thick and we might be probing only the cool envelope of the cloud with the observations of the 12CO transitions. Furthermore, weaker broad wings from the warm gas might be confused with neighbouring molecular features. Similar observations of shocked molecular gas towards other SNRs imply that the broad emission component is usually stronger in higher 12CO transitions (e.g., Seta et al., 1998), or restricted to a small molecular clumps (e.g., Reach et al., 2002). Thus, observations of higher energy transitions (which would also result in higher spatial resolution) might be needed to detected the shocked molecular gas in the millimetre band. Indeed, preliminary results from observations of CO 4–3 line show broad line emission centered at km s-1 (Yusef-Zadeh et al. 2004, in preparation).
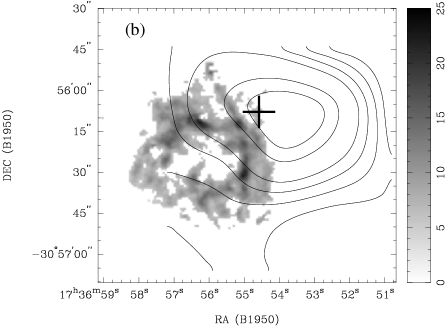
Figure 8a shows the integrated 12CO 2–1 line emission superimposed on the 20 cm radio continuum emission. The blast wave delineated by the radio emission is indented at the location of the OH(1720 MHz) maser and the 12CO peak, suggesting that the molecular cloud is large and dense enough to cause a significant impediment to the shock front. This resembles the well known case of SNR-cloud interaction seen in the Cygnus Loop (e.g., Danforth, Blair, & Raymond, 2001). Also, the western side of the H2 emission appears more flattened compared to the other parts, which is suggestive of a compression resulting from the interaction between the nebula and the surrounding molecular gas. Thus, the OH(1720 MHz) maser, the H2 emission and the radio continuum indentation is the indication that the blast wave has just begun to interact with the tip of the molecular cloud. The distribution of molecular gas components is consistent with the OH(1720 MHz) maser being located in a post-shock layer just behind a shock front, oriented transverse to the line of sight, as predicted by the theory for OH(1720 MHz) maser formation (Elitzur, 1976; Lockett et al., 1999). Furthermore, the X-ray flux observed from the Tornado (Gaensler et al., 2003) is consistent with that required to produce the necessary OH (Wardle, 1999).
The OH(1720 MHz) maser is located at the western edge of the H2 emission and its velocity ( km s-1) differs significantly from the mean velocity of H2 emission. This is not too surprising because we see masers only at the location where the shock is propagating perpendicular to our line of sight (Lockett et al., 1999), whereas we see H2 emission from any location in the shocked gas. The extended maser emission spans over a larger velocity gradient between and km s-1 (Yusef-Zadeh et al., 1999). It is expected that the shock associated with extended maser emission is not exactly perpendicular to the line of sight, although these velocities are still much lower than the mean velocity of H2 emission. The large velocity span of H2 emission features is probably the result of seeing a shock under different angles. Although H2 emission appears ring-like, the distribution of H2 line-velocities, when compared to 12 km s-1 as a reference, is clearly incompatible with any expansion of a ring. In fact, it may be simply a chance line of sight projection that is causing the apparent ring structure. Presumably the north-west structure of the H2 ring is marking the shock front as it runs into the CO cloud, given the position offset between the CO and H2 in Figure 8b. The rest of the H2 ring is probably not a continuous structure but foreground or background structure being shocked with a different shock velocity vector. This is supported by the fact that there is no coherence between two adjacent clumps at different velocities when we examine the H2 cube, and velocities jump from one clump to the other, supporting the notion that clumps are distinct features. If we suppose the greatest shock speed is , running in to the lowest density molecular gas, , then the line of sight velocity we measure is , where the velocity is with respect to the km s-1 ambient cloud value, with being the plane of the sky, and is the density at that point. In general the velocities get more negative towards the rear of the ring, which implies that is small here so the shock is moving nearly directly towards us to the rear of the H2 ring.
5 Summary
We have detected 2.12 m H2 1–0 S(1) emission towards the northwestern edge of the Tornado nebula. The emission has a ring-like morphology and encompasses the location of the OH(1720 MHz) maser. The correlation between the radio continuum and H2 emission, and significant velocity motions suggest that the H2 emission originates from an expansion of the shock wave and is most probably shock excited. The OH(1720 MHz) maser is located at the western edge of the H2 emission, which probably delineates the leading edge of shock front.
Molecular transitions of 12CO and 13CO were also detected at the maser velocity of km s-1; emission from CS, HCO+, HCN and H2CO was not detected. The millimetre-line observations were found to probe only the ambient molecular gas associated with the nebula, which is optically thick and warm ( K, for assumed gas density of – cm-3). The location of the molecular gas coincides with an indentation in the radio continuum distribution and the OH(1720 MHz) maser position, suggesting that the molecular cloud is large enough to cause significant deceleration of the blast wave shock. Observations of optically thinner higher transitions of 12CO are needed to examine the properties of shocked part of the molecular gas.
6 Acknowledgments
We thank John Black for kindly providing us with his MEP code. JSL was supported by an Australian Government International Postgraduate Research Scholarship, a Sydney University Postgraduate Scholarship, and an ATNF Postgraduate Scholarship. JSL also acknowledges travel support from the Australian Government’s Access to Major Research Facilities Program.
The NIR observations would not have been possible without the efforts of Michael Ashley and the UNSWIRF crew from UNSW, as well as the staff of the Anglo Australian Observatory. The Swedish-ESO Submillimetre Telescope (SEST) is operated by the Swedish National Facility for Radio Astronomy, Onsala Space Observatory and by the European Southern Observatory (ESO). The National Radio Astronomy Observatory (NRAO) is a facility of the National Science Foundation, operated under a cooperative agreement by Associated Universities, Inc. This publication makes use of data products from the Two Micron All Sky Survey (2MASS), which is a joint project of the University of Massachusetts and the Infrared Processing and Analysis Center/California Institute of Technology, funded by the National Aeronautics and Space Administration and the National Science Foundation.
References
- Brogan & Goss (2003) Brogan, C. L. & Goss, W. M. 2003, AJ, 125, 272
- Becker & Helfand (1985) Becker, R. H. & Helfand, D. J. 1985, Nature, 313, 115
- Brogan et al. (2000) Brogan, C. L., Frail, D. A., Goss, W. M., & Troland, T. H. 2000, ApJ, 537, 875
- Burton et al. (1988) Burton, M. G., Geballe, T. R., Brand, P. W. J. L., & Webster, A. S. 1988, MNRAS, 231, 617
- Burton, Hollenbach, & Tielens (1990) Burton, M. G., Hollenbach, D. J., & Tielens, A. G. G. M. 1990, ApJ, 365, 620
- Burton et al. (2004) Burton, M. G., Lazendic, J. S., Yusef-Zadeh, F., & Wardle, M. 2004, MNRAS, 348, 638
- Caswell et al. (1980) Caswell, J. L., Haynes, R. F., Milne, D. K., & Wellington, K. J. 1980, MNRAS, 190, 881
- Clark & Caswell (1976) Clark, D. H. & Caswell, J. L. 1976, MNRAS, 174, 267
- Cutri (1997) Cutri, R. M. 1997, in The Impact of Large Scale Near-IR Sky Surveys, ed. F. Garzón et al. (Dordrecht: Kluwer), 187
- Danforth, Blair, & Raymond (2001) Danforth, C. W., Blair, W. P., & Raymond, J. C. 2001, AJ, 122, 938
- Elitzur (1976) Elitzur, M. 1976, ApJ, 203, 124
- Gaensler et al. (2003) Gaensler, B. M., Fogel, J. K. J., Slane, P. O., Miller, J. M., Wijnands, R., Eikenberry, S. S., & Lewin, W. H. G. 2003, ApJL, 594, L35
- Fich, Blitz, & Stark (1989) Fich, M., Blitz, L., & Stark, A. A. 1989, ApJ, 342, 272
- Frail et al. (1996) Frail, D. A., Goss, W. M., Reynoso, E. M., Giacani, E. B., Green, A. J., & Otrupcek, R. 1996, AJ, 111, 1651
- Green et al. (1997) Green, A. J., Frail, D. A., Goss, W. M., & Otrupcek, R. 1997, AJ, 114, 2058
- Helfand & Becker (1985) Helfand, D. J. & Becker, R. H. 1985, Nature, 313, 118
- Irvine, Goldsmith, & Hjalmarson (1987) Irvine, W. M., Goldsmith, P. F., & Hjalmarson, A. 1987, ASSL Vol. 134: Interstellar Processes, 561
- Jansen et al. (1994) Jansen, D. J., van Dishoeck, E. F. & Black, J. H. 1994, A&A, 282, 605
- Langer & Penzias (1990) Langer, W. D. & Penzias, A. A. 1990, ApJ, 357, 477
- Lazendic et al. (2002) Lazendic, J. S., Wardle, M., Burton, M. G., Yusef-Zadeh, F., Whiteoak, J. B., Green, A. J., & Ashley, M. C. B. 2002, MNRAS, 331, 537
- Lazendic et al. (2004) Lazendic, J. S., Wardle, M., Whiteoak, J. B., Burton, M. G. & Green, A. J., 2004, to be submitted to MNRAS
- Lockett et al. (1999) Lockett, P., Gauthier, E. & Elitzur, M. 1999, ApJ, 511, 235
- Manchester (1987) Manchester, R. N. 1987, A&A, 171, 205
- Milne (1979) Milne, D. K. 1979, Australian Journal of Physics, 32, 83
- Radhakrishnan et al. (1972) Radhakrishnan, V., Goss, W. M., Murray, J. D., & Brooks, J. W. 1972, ApJS, 24, 49
- Reach et al. (2002) Reach, W. T., Rho, J., Jarrett, T. H., & Lagage, P. 2002, ApJ, 564, 302
- Rohlfs & Wilson (1996) Rohlfs, K. & Wilson, T. L. 1996, Tools of Radio Astronomy, Springer-Verlag, Berlin
- Ryder et al. (1998) Ryder, S. D., Sun, Y.-S. Ashley, M. C. B., Burton, M. G., Allen, L. E. & Storey, J. W. V. 1998, Publications of the Astronomical Society of Australia, 15, 228
- Seta et al. (1998) Seta, M. et al. 1998, ApJ, 505, 286
- Shaver et al. (1985a) Shaver, P. A., Salter, C. J., Patnaik, A. R., van Gorkom, J. H., & Hunt, G. C. 1985, Nature, 313, 113
- Shaver et al. (1985b) Shaver, P. A., Pottasch, S. R., Salter, C. J., Patnaik, A. R., van Gorkom, J. H., & Hunt, G. C. 1985, A&A, 147, L23
- Shull, Fesen, & Saken (1989) Shull, J. M., Fesen, R. A., & Saken, J. M. 1989, ApJ, 346, 860
- Stewart et al. (1994) Stewart, R. T., Haynes, R. F., Gray, A. D., & Reich, W. 1994, ApJL, 432, L39
- van Dishoeck et al. (1993) van Dishoeck, E. F., Jansen, D. J., & Phillips, T. G. 1993, A&A, 279, 541
- Wardle (1999) Wardle, M. 1999, ApJL, 525, L101
- Wardle & Yusef-Zadeh (2002) Wardle, M. & Yusef-Zadeh, F. 2002, Science, 296, 2350
- Yusef-Zadeh et al. (1999) Yusef-Zadeh, F., Goss, W. M., Roberts, D. A., Robinson, B., & Frail, D. A. 1999, ApJ, 527, 172
- Yusef-Zadeh et al. (2001) Yusef-Zadeh, F., Stolovy, S. R., Burton, M., Wardle, M., & Ashley, M. C. B. 2001, ApJ, 560, 749
- Yusef-Zadeh et al. (2003) Yusef-Zadeh, F., Wardle, M., Rho, J., & Sakano, M. 2003, ApJ, 585, 319
| Molecule | Transition | Beam Size | ||||
|---|---|---|---|---|---|---|
| (GHz) | (arcsec) | (K) | ( km s-1) | ( km s-1) | ||
| 12CO | 2–1 | 230.538 | 23 | 10.50.3 | 11.0 | 4.0 |
| 1–0 | 115.271 | 45 | 8.60.4 | 11.2 | 5.1 | |
| 13CO | 2–1 | 220.399 | 23 | 3.50.2 | 11.0 | 3.7 |
| 1–0 | 110.201 | 45 | 2.50.1 | 11.1 | 3.7 | |
| CS | 3–2 | 146.969 | 34 | 0.1 | – | – |
| 2–1 | 97.981 | 52 | 0.2 | – | – | |
| HCO+ | 1–0 | 89.188 | 54 | 0.2 | – | – |
| HCN | 1–0 | 88.632 | 55 | 0.1 | – | – |
| H2CO | 3(2,2)–2(2,1) | 218.475 | 23 | 0.1 | – | – |
| 3(0,3)–2(0,2) | 218.222 | 24 | 0.1 | – | – |