GRB 990123 revisited: Further Evidence for a Reverse Shock
Abstract
Recently we have presented a new theoretical analysis of the reverse shock emission. We use this analysis here to revisit GRB 990123. We find new and compelling evidences that the optical flash and the radio flare of GRB 990123 resulted from a reverse shock. This suggests that a significant fraction of the energy of the relativistic ejecta must have been carried by baryons. It also suggests that the external medium is an ISM and that in this burst the reverse shock emission dominated at early time over other possible processes. We use the early optical emission to constrain the physical parameters of the original ejecta and the microscopic parameters in the emitting reverse shocked region.
1 Introduction
The 9th magnitude optical flash of GRB 990123 was one of the most exciting discoveries associated with Gamma-Ray Bursts (GRBs). This was followed by a detection of a strong unusual radio flare from the same source (Kulkarni et al. 1999, Galama et al. 1999). One of the most impressive facts concerning the strong optical flash of GRB 990123 was that such a strong prompt optical emission was predicted, just a few months earlier to arise from the reverse shock during the early afterglow (Sari, & Piran 1999a). Later this interpretation was questioned and other models for prompt optical emission were proposed (e.g. Beloborodov, 2002). We return to this issue here.
In the popular fireball model (Piran 1999) for Gamma-Ray Bursts (GRBs), the afterglow results from a blast-wave that propagates into the circum-burst medium. This blast-wave is originated by the energy dissipation of the relativistic ejecta to the circum-burst medium. In this model the early afterglow is produced during this dissipation, and thus can be used to study the nature of the ejecta. In case that the ejecta is Baryonic, a reverse shock is produced during this dissipation. This reverse shock is predicted to produce strong optical flash and radio flare (Sari & Piran 1999b,c).
Recently we have presented new theoretical analysis of the reverse shock emission (Nakar & Piran 2004; hereafter NP04). This analysis includes a new test of reverse shock emission and diagnostic tools for the physical parameters of the original ejecta. We use these new tools, here, to re-investigate the early afterglow of GRB 990123. Note that numerous authors analyzed the early afterglow of GRB 990123 (Sari & Piran 1999b; Mészáros & Rees 1999; Kulkarni et al. 1999; Galama et al. 1999; Wang, Dai & Lu 2000; Panaitescu & Kumar 2001; Fan et al. 2002; Soderberg & Ramirez-Ruiz 2002). We don’t attempt to review here these results and compare them as the scope of such a review is too long for a short letter.
The reverse shock optical emission has a typical and characteristic decay that was observed in the light curve of GRB 990123 (Fenimore et al. 1999; Sari & Piran 1999b,c). We find additional conclusive evidence that the optical flash and the radio flare of GRB 990123 indeed resulted from the emission of a reverse shock produced by an interaction of the ejecta with and ISM. These results suggest first that at least in this burst the reverse shock emission, and not another mechanism such as a pair enriched forward shock (due to interaction of the prompt -rays with the circum burst medium; Thompson & Madau 2000, Beloborodov, 2002), dominated the early afterglow. As the reverse shock requires, a baryonic component in the ejecta it also implies that a significant fraction of the energy of the relativistic ejecta was carried by baryons.
The sparse observations before the peak of the optical flash (only one measurement before the peak at each wavelength) poses difficulties in analyzing the properties of the ejecta, since this analysis depends on the rising power-law index of the optical light curve111Since there is only a single observation before the peak, the rising phase may also be very irregular with no power-law behavior. In this case the analysis of the ejecta properties presented in NP04 does not apply, as it imply that the relativistic ejecta hydrodynamical profile is highly irregular. However, having no detailed observations of this phase we use here the simplest light curve that fits the observations - a broken power-law. Note that the tests, which show that the emission is a reverse shock emission, are independent of the shape of the rising light curve, and can be carried also if it is irregular.. Still, we are able to determine that the reverse shock was mildly relativistic and that the initial Lorentz factor is most likely smaller than , where is the (isotropic equivalent) kinetic energy in the ejecta after the prompt emission phase in units of ergs and is the protons density of the circum-burst interstellar medium in c.g.s. The width of the ejecta is found to be, as expected, roughly equal to the burst duration (multiplied by the light speed). Because of the sparse data available we obtain only upper limits to the initial Lorentz factor and the shell’s width and only lower limits to the microscopic equipartition parameters and the external density. We expect that in the future detailed optical light curves, provided by Swift and rapid follow up observations, would enable an accurate determination of the initial physical parameters of the relativistic wind by using the method we apply here.
For completeness we begin (§2) with a short summary of the theoretical model of the reverse shock emission presented in NP04. We summarize, in §3, the early afterglow observations of GRB 990123. The analysis of the optical light curve and the resulting constraints on the physical parameters of the relativistic wind is presented in §4. In §5 we test whether the observations fit with a reverse shock emission. The results, their implications to GRB modelling and future prospects are summarized in §6.
2 The reverse shock emission - Theory
We begin with a brief summary of the main results of NP04. These results give the theoretical predictions of the optical and the radio emission of a baryonic reverse shock in an ISM environment. NP04 suggest to model the early optical light curve (similarity to late afterglow parametrization; Beuermann et al. 1999) as a broken power-law with five parameters:
| (1) |
where and are the asymptotic power-law indices, is the peak flux and the parameter determines the sharpness of the peak (a large corresponds to a sharp peak). The physical parameters which determine the emission of the reverse shock are: (1) The (isotropic equivalent) energy , the width and the initial Lorentz factor of the ejected wind. (2) The circum burst density, , that we consider as a constant interstellar medium (ISM). (3) The microscopic parameters in the emitting region, namely the energy equipartition parameters and that describe the ratio of the electrons and Magnetic field energy to the total internal energy, and , the power-law index of the electrons’ energy distribution.
The strength of the reverse shock is determined by the dimensionless parameter (Sari & Piran 1995):
| (2) |
where ( is the proton rest mass energy). According to this definition:
| (3) |
The peak of the optical emission is observed at
| (4) |
when the reverse shock finishes crossing the ejecta. is the speed of light and is the redshift. The structure of the optical and the radio reverse shock light curves depend on the relative values of the three reverse shock break frequencies at : , the self-absorbtion frequency, , the synchrotron frequency and the cooling frequency. In principal numerous patterns are possible. However, over a wide range of the parameter space (and as we show below, in particularly for GRB 990123) these frequencies satisfy , where and are the observed radio and optical frequencies respectively. We consider this frequencies sequence as the generic case. In this case the peak optical flux is:
| (5) |
where throughout the paper we denote by the value of the quantity in units of (c.g.s), and is the proper distance. The function is approximated in the range of by:
| (6) |
values out of this range can be found in NP04.
The flux before depends strongly on , and thus the rising slope, can be used to determine using (in the generic case):
| (7) |
The reserve shock decay index is, however, a constant:
| (8) |
and its main use is to identify the reverse shock emission. Finally, the sharpness parameter, , depends mainly on the profile of the ejecta. A sharp break with is expected when the ejecta is rather homogenous, while a gradual break with a lower value of is expected if the spread of the initial Lorentz factor within the shell is large.
In contrast to the optical emission, the radio continues to rise at and it peaks at a later time, , when . Over a wide range of values (when the shock is not ultra relativistic) Hz. In this case the radio emission is expected to rise first as until and then as until . At it is expected to decay, similarly to the optical emission, as . This behavior provides a second and independent test for the reverse shock emission:
| (9) |
where this value can be larger or smaller by a factor of (for a given ) due to uncertainty in the hydrodynamics (see Kobayashi & Sari 2000). It provides also an independent measurement of :
| (10) |
Detailed radio observations at that identify the break during the rising phase, when , would enable determination of as well.
3 Observations
At GRB 990123 is one of the brightest -rays bursts observed so far (Briggs et al. 1999). The main event of this burst is composed of two very energetic and hard pulses which last together sec. These two pulses contain almost all the emitted energy during the burst. A much softer and less energetic emission (keV) is observed sec before and up to sec after this event. The total isotropic equivalent energy emitted in -rays during the burst is ergs. The timing of the main -rays event differ between different detectors. While BATSE triggered on the first soft emission, sec before the main event, BeppoSAX triggered sec later than BATSE on the beginning of the main event.
GRB 990123 is also the only burst where optical emission was observed during the prompt emission (Akerlof et al. 1999). The first detection of mag is recorded after BeppoSAX trigger. The optical emission peaks at the second snapshot that took place sec after BeppoSAX trigger with mag (Jy)! After the peak, a fast decay is observed with a power law slope of which becomes shallower at later times.
The early radio observations of GRB 990123 show also an unusual flare (Kulkarni et al. 1999). The first observation after days shows a 8.46GHz intensity of Jy. The flux in this band rises to a peak flux of Jy after days and then decline rapidly. Observations at other wavelengths from this epoch (day) (Galama et al. 1999) show a flux of Jy at GHz and upper limits of several hundreds Jy in , and GHz.
4 Constraining the burst parameters
Already in 1999 Fenimore et al. (1999) pointed out that the initial decay index of the optical flash agrees with the predictions of a reverse shock emission (Sari & Piran 1999a,b,c). At later times the decay becomes more moderate as expected from the forward shock contribution. Motivated by this observation, we first use the optical observations to constrain the physical parameters of the burst assuming that the flash arises from a reverse shock emission. Later, we carry the additional tests of reverse shock emission, described in NP04.
When modelling the early afterglow, it is important to find the time when the main part of the relativistic ejecta is emitted from the source. It is not necessarily the trigger time. In GRB 990123 the radiated energy, and therefore most likely the energy ejected from the source, is clearly dominated by the main two pulses. Kobayashi, Sari & Piran 1997 (see also Nakar & Piran 2002), have shown that in internal shocks the observed time of the -rays pulses reflects the emission time of the wind from the source. Therefore we estimate that the main part of the relativistic wind is beginning to be ejected by the source at the time that the first dominant pulse starts rising - the BeppoSax triggering time (sec after the BATSE trigger). This is the point where we set the observer clock to . According to this setting the duration of the burst is sec and the peak of the optical emission is observed at sec.
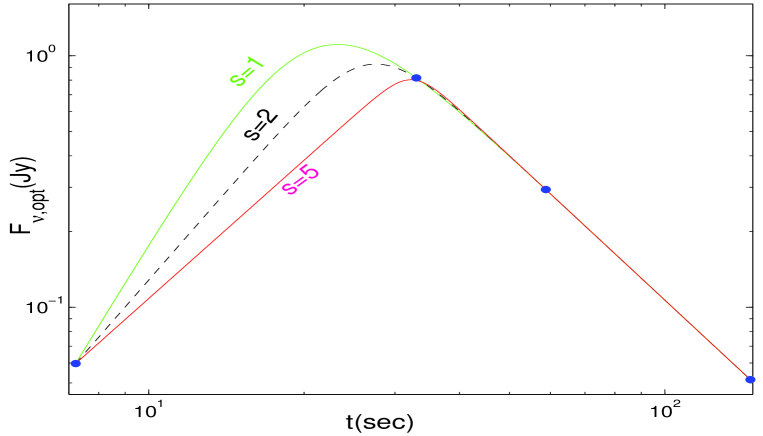
The observations of the optical flash of GRB 990123 (Akerlof et al. 1999) include only one data point before the peak. Since there are two observations after the peak which show similar decay (sec and sec), , a broken power law fit is possible only if the peak is between the first and the second observations. Thus, we have only lower limits to Jy, , an upper limit to sec and can take any value (see Fig. 1). As we have only a lower limit on , Eq. (8) yields only a lower limit on (we use thorough out.):
| (11) |
Eqs. (4 & 3) result in the upper limits:
| (12) |
and
| (13) |
It is reassuring to find that the width of the shell obtained for divided by the speed of light is similar to the duration of the GRB (sec in the burst’s frame).
Next we use Eq. (5) to constrain the microscopic equipartition parameters, and , and the external density, . We consider the total energy emitted in -rays, ergs, as a reasonable estimate of the remaining energy in the ejecta, . Therefore, we do not attempt to estimate it from the optical flash observations. Instead we express the dependance of the resulting constraints on the value of . Taking and requiring Jy leads, using Eq. (5), to:
| (14) |
Another constraint follows the requirement that (otherwise the optical light curve would not show the generic behavior of ) 222 The requirement that is satisfied for any reasonable value of the parameters and therefore cannot be used as a constraint. The values of and can be found in NP04.:
| (15) |
These two constraints (together with the trivial one, ) result in the following limits:
| (16) |
| (17) |
| (18) |
5 Was the optical flash a result of a reverse shock emission?
We have already mentioned that the optical flash of GRB 990123 passes the first test of a reverse shock emission: (Fenimore et al. 1999, Sari & Piran 1999a,b,c). NP04 have shown that in the generic case ( at ) the reverse shock emission results also in a tight relation between the radio and the optical emission, Eq. (9). For the observed frequencies of GRB 990123 (Hz and GHz) and :
| (19) |
The observations of GRB 990123 show a remarkable agreement with this prediction (taking the times and the fluxes of the flash and the flare as the times and the fluxes of the peak observation, sec, Jy, day and Jy):
| (20) |
where the result include the uncertainty in the hydrodynamics. NP04 show also that if the above test is passed, then the self absorption frequency at , , can be estimated from the the ratio between and :
| (21) |
This frequency is determined by the physical conditions at . As a consistency check we compare this result to the possible values of obtained by the limits on the physical parameters determined from the analysis of the optical emission. We consider the case of and p=2.3 for which:
| (22) |
Within the parameters space of , and which satisfy Eqs. (14 & 15) and taking we obtain ! Although the dependance of this range on the value of is not trivial, it is weak and the value is consistent with the allowed range for any reasonable value of , . This constraint on the value of is independent of the value found in Eq. (21). Once more the agreement between the two estimates is remarkable.
So far we focused on the radio observations at 8.46Ghz. The lower radio fluxes both above and below 8.46GHz, at , are consistent with reverse shock emission, which predicts that the peak frequency at is the observed (8.46Ghz in this case). Finally we note that although radio observations from can theoretically be used to farther constrain the conditions at , the large errors of the single radio observation from this epoch is insufficient to do so.
6 Conclusions
We have analyzed the early afterglow of GRB 990123 according to the theoretical predictions of the reverse shock emission presented in NP04. We find that GRB 990123 shows the clear signature of a reverse shock emission in two independent and robust tests. Apart from these two tests we carry a consistency check between the radio emission and our analysis of the optical emission which is passed successfully. This consistency check gives us further confidence both in the analysis and in the fact that the optical flash and the radio flare of GRB 990123 are a generic case of a reverse shock emission.
The consistency with the reverse shock model further suggests, but does not proof of course, that the optical flash of GRB 990123 did not arise from a pair loaded forward shock (Beloborodov, 2002). In turn this indicates that the ejecta of GRB 990123 had (at least at this stage) a significant baryonic component, as otherwise, for example in a pure Poynting flux flow, a reverse shock is not expected.
Our analysis of the optical emission shows that the reverse shock was mildly relativistic and that the initial Lorentz factor is less than . We find that the width of the initial shell is similar to the duration of the burst or smaller. We constrain also the equipartition parameters and find that while . The external density is limited by .
The determination of the initial conditions of GRB 990123 and the constraints of the microscopic parameters and the external density is very limited due to the sparse optical and radio observations. Swifts and its follow up observations would hopefully provide during the next few years detailed light curves. These would enable a more detailed analysis and a much better determination of the parameters of the burst’s relativistic outflow.
We thank Robert Mochkovitch, Frederic Daigne and Elena Rossi for helpful discussions. The research was supported by the US-Israel BSF and by EU-RTN: GRBs - Enigma and a Tool. EN is supported by the Horowitz foundation and by a Dan David Prize Scholarship 2003.
References
- (1) Akerlof, C. et al., 1999, Nature, 398, 400
- (2) Beloborodov, A. M. 2002, ApJ, 565, 808
- (3) Beuermann et al., 1999, A&A, 352, L26
- (4) Briggs, M. S. et al., 1999, ApJ, 524, 82
- (5) Fan, Y. Z., Dai, Z. G., Huang, Y. F. & Lu T., 2002, ChJAA, 2, 449
- (6) Fenimore, E. E., Ramirez-Ruiz, E. & Wu, B., 1999. ApJ, 518, L73
- (7) Galama, T, J., 1999, Nature, 398, 394
- (8) Kulkarni, S. et al, 1999, ApJ, 522, L97
- (9) Kobayashi, S., Piran, T. & Sari, R, 1997, ApJ, 490, 92
- (10) Kobayashi, S. & Sari, R., 2000, ApJ, 542, 819
- (11) Mészáros, P. & M.J. Rees, 1997,ApJ, 476, 232
- (12) Mészáros, P. & M.J. Rees, 1999, MNRAS, 306, L39
- (13) Nakar, E. & Piran, T., 2002, ApJ, 572, L139
- (14) Nakar, E. & Piran, T., 2004, astro-ph/0403461 (NP04)
- (15) Panaitescu, A. & Kumar, P., 2001, ApJ, 554, 11
- (16) Piran, T., 1999, Physics Reports, 314, 575
- (17) Sari, R. & Piran, T., 1995, ApJ, 455, L143
- (18) Sari, R. & Piran, T. 1999a, Astron. & Astrophys. Supp., 138, 537
- (19) Sari, R. & Piran, T., 1999b, ApJ, 517, L109
- (20) Sari, R. & Piran, T., 1999c, ApJ, 520, 641
- (21) Thompson, C. & Madau, P., 2000, Apj 538, 105
- (22) Soderberg, A. M. & Ramirez-Ruiz, E., 2002, MNRAS, 330, L24
- (23) Wang, X. Y., Dai, Z. G. & Lu, T. 2000, MNRAS, 319, 1159