Dust-reddening and gravitational lensing of SDSS QSOs due to foreground damped Lyman- systems
Abstract
We use Sloan Digital Sky Survey Data Release 2 QSO spectra to constrain the dust-reddening caused by intervening damped Ly systems (DLAs). Comparing the spectral index distribution of a 70 sight-line DLA sample with that of a large control sample reveals no evidence for dust-reddening at . Our limit on the shift in spectral index, (), corresponds to a limit on the colour excess due to SMC-like dust-reddening, (). This is inconsistent with the early studies of Fall, Pei and collaborators who used the small QSO and DLA samples available at the time. Comparison of the DLA and control magnitude distributions also reveals evidence for an excess of bright and/or a deficit of faint QSOs with foreground DLAs. Higher equivalent width DLAs give a stronger signal. We interpret this as the signature of gravitational magnification due to the intervening DLAs.
keywords:
dust, extinction – galaxies: high redshift – intergalactic medium – galaxies: ISM – quasars: absorption lines1 Introduction
Dust, and its relationship with the gas phase, are key ingredients in any recipe for galaxy formation and evolution. Understanding the role of dust in the damped Lyman- systems (DLAs) seen in QSO spectra is particularly important since DLAs are thought to comprise a significant fraction of the high redshift gas available for star-formation (e.g. Lanzetta et al., 1991). Information about dust in DLAs comes predominantly from the relative depletion of refractory (e.g. Fe) and non-refractory (e.g. Zn) elements onto dust grains (e.g. Pettini et al., 1997). This measures the amount of dust in DLAs but does little to constrain the dust’s composition or grain size.
DLA dust-reddening and extinction are potentially acute problems for flux-limited optical QSO surveys (e.g. Ostriker & Heisler, 1984). Fall & Pei (1989) examined this observationally by comparing the spectral indices of QSO spectra with and without foreground DLAs. They later detected (Fall, Pei & McMahon, 1989) and confirmed (Pei, Fall & Bechtold, 1991, hereafter PFB91) a significant difference between the spectral index distributions for the DLA and control samples, concluding that up to 70 per cent of bright QSOs will be missed by flux-limited surveys (Fall & Pei, 1993). A recent radio-selected QSO survey for DLAs (Ellison et al., 2001) finds that optical surveys underestimate the DLA number density per unit redshift by at most a factor of two.
The DLA and control samples of PFB91 are quite small, comprising 26 and 40 sight-lines respectively. The Sloan Digital Sky Survey (SDSS; Stoughton et al., 2002) includes a large, homogeneous QSO sample with accurate spectrophotometric calibration and spectral resolution high enough () to reliably detect DLAs (e.g. Prochaska & Herbert-Fort, 2004). The SDSS therefore provides a powerful probe of DLA dust-reddening.
Another intriguing result is the recent detection by Ménard & Péroux (2003) (hereafter MP03, ) of gravitational lensing (GL) caused by strong intervening Mg ii absorbers in the 2dF QSO redshift survey. By comparing the magnitude distributions of the Mg ii sample and a large control sample, they found an excess (deficit) of bright (faint) QSOs with absorbers and demonstrated that this was consistent with a GL interpretation. It is important to confirm and explore the GL produced by DLAs since, in principle, it provides a probe of the dark matter distribution in distant halos. Also, if the GL magnification of the DLA sample is large, DLA dust-reddened QSOs will be more detectable than those without, biasing any detection of dust-reddening.
In this paper, we select DLAs and, importantly, a large control sample of QSOs from the SDSS Data Release 2 (DR2; Abazajian et al., 2004) to constrain DLA dust-reddening (Section 3). We also tentatively confirm the GL effect and discuss the potential bias on reddening (Section 4). We present only the main observational results here, leaving most details to a later paper.
2 Selecting DLAs from the SDSS DR2
Spectra for all objects classified as QSOs in the SDSS DR2 with emission redshifts were visually inspected and the small number ( per cent) which were clearly not QSOs at the SDSS-assigned emission redshift were rejected. We included those QSOs not listed as ‘primary’ targets in the SDSS, i.e. those which were not selected using the colour-space techniques of Richards et al. (2002). Other SDSS sources were selected from the FIRST and ROSAT surveys or could have been initially identified as stars or galaxies before spectroscopic follow-up. Our sample is therefore largely, though not strictly, homogeneously selected. The results are robust against this small inhomogeneity (Sections 3.2 & 4.2).
We search for DLAs between the Ly and Ly emission lines and, to avoid DLAs intrinsic to the QSOs and moderately broad absorption lines (BALs), we ignore the regions below Ly and above Ly. A continuum is formed by iteratively fitting a third-order polynomial to overlapping - spectral chunks, rejecting pixels below and above the fit at each iteration until no more points are rejected ( is the SDSS error array). The continuum chunks are combined by weighting each from zero at the edges to unity at the centre. Finally, the continuum is smoothed over 25 pixels (). This procedure yields reliable continua in most cases. However, 3 likely DLAs were not selected due to poor fits near the continuum edges.
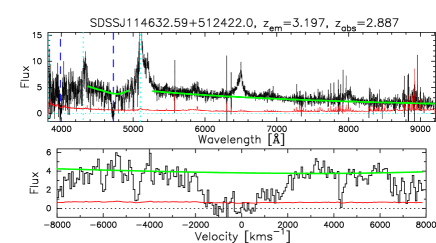
Candidate DLAs are identified as absorption features with rest-frame equivalent width over a rest-frame window. Visual inspection of each DLA candidate is used to reject cases where no clear DLA profile is observed. This was the case for per cent of candidates and was more prominent at where the Ly forest is thicker. Prochaska & Herbert-Fort (2004, hereafter PHF04) advocate a DLA search strategy where no continuum is required and this may prove to be a more efficient future method. Nevertheless, our strategy will select the strongest DLAs which are arguably (see below) ideal for our study of dust-reddening and GL. Fig. 1 shows an example DLA.
We reject spectra where the median signal-to-noise per pixel – (continuum)i/( error)i for pixel over the window – drops below a threshold value of anywhere along the fitted continuum. Below this the algorithmic and visual assessment is unreliable. This is an important selection criteria for the GL study in Section 4 and we discuss it further there. We also reject QSOs with such severe BALs that DLA detection is unreliable, particularly those similar to LoBAL and FeLoBALs (e.g. , Reichard et al.2003). However, we kept QSOs with moderate BALs (e.g. HiBALs) since one can detect, and confidently not detect, DLAs in these cases. This is discussed further in Sections 3.2 & 4.2.
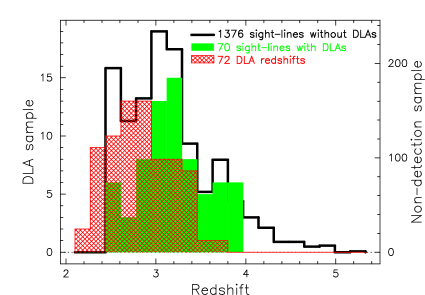
Fig. 2 shows the and distributions for QSOs where a DLA is and is not detected. We find 72 DLAs along 70 distinct QSO sight-lines. Although the DLA and non-detection distributions are similar for , there is a high- tail where no DLAs are detected. This is primarily because our DLA search is insensitive at high- where the Ly forest is very thick. The total redshift path available for DLA detection is so, using an incidence of DLAs per unit redshift of 0.25 for a mean (e.g. PHF04, ), we should have found DLAs. As expected, comparison with the DR1 DLA catalogue of PHF04 shows this 50 per cent incompleteness to be confined to DLAs with low neutral hydrogen column densities, H i. We discuss the influence this has on our results in Sections 3.2 & 4.2. Table 1 lists the relevant properties of the DLA and control samples.
| SDSSJ | ||||||
|---|---|---|---|---|---|---|
| 001240135236 | 3.187 | 19.47 | 3.02 | – | – | |
| 001255091425 | 3.004 | 19.62 | 3.98 | – | – | |
| 001328135828 | 3.576 | 18.83 | 6.68 | 3.277 | 14.79 | |
| 001502001212 | 2.852 | 18.79 | 5.55 | – | – |
3 DLA dust-reddening
3.1 Spectral index distributions
The spectral index, , defined as , was determined for each QSO by iteratively fitting a power-law to the flux (corrected for Galactic extinction) red-wards of the Ly emission line. Pixels below or above the fit were rejected at each iteration and iterations continued until no more points were rejected. Fig. 1 shows an example fit. This procedure effectively ignores intervening absorbers, intrinsic QSO emission/absorption lines and the poorly sky-subtracted regions at commonly seen in SDSS spectra. The statistical errors in range from to with per cent of errors between and .
Abazajian et al. (2004) discussed the DR2 spectrophotometric accuracy. There is a dispersion in the difference between the fibre colours and those derived by convolving the calibrated spectra with the filter transmission profiles. Thus, the error on the mean colour difference between a sample of 70 sight-lines and a large control sample is . Hence, uncertainty in the spectrophotometry induces a mean spectral index difference of just (Vanden Berk et al., 2001).
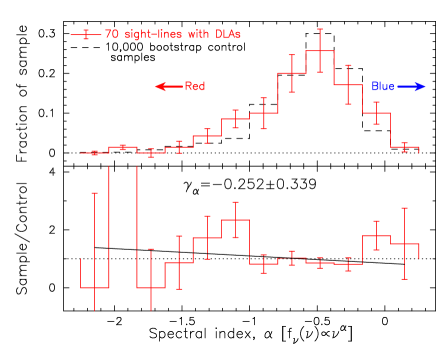
To form a representative control sample to which the DLA sample may be reliably compared, we drew 10000 bootstrap samples, each comprising 70 sight-lines, from the non-detection sample with the same redshift distribution as the DLA sample. In practice, this was acheived by dividing the DLA sample’s range in into 12 bins and randomly selecting from the non-detection sample according to the relative populations in these 12 bins. There were 1160 non-detections over the range of the DLA sample. Fig. 3 compares the distributions of the DLA and combined bootstrap sample. Both are very similar to the ‘photometric spectral index’ distribution for SDSS QSOs derived by Richards et al. (2003). The error-bars represent the rms deviation in the number of non-detections in each bin over the 10000 bootstrap samples.
To assess any differential reddening between the DLA and control samples, the number of DLA sight-lines per bin is divided by the number in the combined control sample for that bin, normalized by the total sample sizes. The lower panel of Fig. 3 shows this fraction fitted by a straight line with slope which varies by with different binning. The expected dispersion in can be compared with the statistical error quoted here by treating each bootstrap sample in the same way as the DLA sample, deriving a slope for each. The distribution of has rms centred on and is well-fitted by a Gaussian. That is, the significance of any reddening is , which has a Gaussian probability of . This compares well with the probability that the DLA and combined control samples are drawn from the same parent distribution, and , using the Kolmogorov-Smirnov test and Mann-Whitney U-test respectively. All three of the above statistical tests are most sensitive to differential reddening in the bulk of the distribution rather than at where the DLA and control samples contain fewer sight-lines.
Fig. 3 shows no evidence for dust-reddening of DR2 QSOs due to foreground DLAs. By artificially altering the measured spectral indices for the DLA sample by the same amount, , we derived a simple linear mapping, . Using this mapping, we derive a limit for the mean allowed by the data, . This is inconsistent with the claimed detection of dust-reddening by PFB91, . Assuming a Small Magellanic Cloud (SMC) extinction law for the DLAs and using the fitting formula of Pei (1992), our limit on corresponds to a limit on the mean . This does not exclude severe dust-reddening in some small fraction of DLAs. Indeed, the control sample suggests that the DLA with may be dust-reddened.
Another method for detecting DLA dust-reddening is to analyse the distributions with a similar technique to that above. Using the point spread function (PSF) magnitudes, we see no differential colour: . Our results also seem inconsistent with the detection of dust-reddening found from the colour distributions of 2dF QSOs with and without strong foreground Mg ii absorbers (Outram et al., 2001). For 120 systems they find a mean colour excess in the observed frame. However, direct comparison with our results is difficult since the Mg ii selection means the absorbers have lower redshift and may have significantly higher metallicities than our DLA sample.
The SDSS is a colour-selected QSO survey and so is biased against intrinsically very red and heavily dust-reddened spectra. Therefore, our results do not rule out a population of extremely dust-reddened QSOs (e.g. Gregg et al., 2002). Applying a SMC extinction law with (i.e. ) to simulated QSO spectra, Richards et al. (2003) find the SDSS QSO survey completeness to be largely unchanged. That is, the distributions in Fig. 3 are sensitive to without large biases due to colour-selection. Richards et al. also find that only 6 per cent of QSOs have spectra consistent with SMC-like dust-reddening with and they interpret the reddening to be internal to the QSO host-galaxy. This is consistent with our results.
3.2 Robustness, potential biases and selection effects
To test the robustness of the above null result to possible biases and/or selection effects, the data were subjected to the following tests, the numerical results of which are summarized in Table 2.
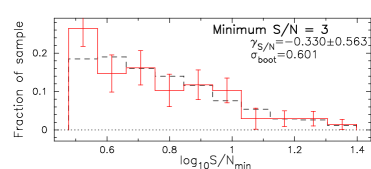
Test 1: . The threshold is a free parameter in our DLA selection process. If dust-reddening is significant and some low-S/N DLAs are missed, the DLA sample may be biased against dust-reddened QSOs. Fig. 4 shows the distribution of for the DLA and control samples analysed in a similar way to the spectral indices. There is no evidence for a deficiency of low-S/N DLA detections, indicating that a threshold of is adequate. Table 2 shows the lack of dust-reddening to be robust against lower and higher thresholds, despite the former resulting in some relative incompleteness at low .
| Test | |||||
|---|---|---|---|---|---|
| 1a | 81 | 0.01(0.30) | 0.65(0.17) | 0.62(0.17) | 0.65(0.17) |
| 1b | 70 | 0.25(0.36) | 0.48(0.20) | 0.44(0.20) | 0.51(0.19) |
| 1c | 50 | 0.03(0.45) | 0.69(0.26) | 0.62(0.25) | 0.67(0.25) |
| 2 | 50 | 0.21(0.44) | 0.04(0.24) | 0.05(0.24) | 0.00(0.23) |
| 3 | 66 | 0.22(0.37) | 0.45(0.21) | 0.40(0.21) | 0.46(0.20) |
| 4 | 64 | 0.43(0.44) | 0.42(0.21) | 0.41(0.21) | 0.50(0.21) |
| 5 | 29 | 0.06(0.50) | 0.51(0.31) | 0.42(0.30) | 0.43(0.29) |
| 6a | 37 | 0.34(0.50) | 0.43(0.30) | 0.34(0.28) | 0.39(0.28) |
| 6b | 33 | 0.62(0.52) | 0.43(0.28) | 0.46(0.28) | 0.55(0.28) |
| 7a | 41 | 0.48(0.49) | 0.31(0.26) | 0.28(0.25) | 0.36(0.25) |
| 7b | 29 | 0.22(0.52) | 0.76(0.31) | 0.72(0.31) | 0.77(0.31) |
Test 2: GL. In Section 4 we assess the magnification of QSOs due to foreground DLAs. If both the GL effect and DLA reddening are significant then reddened QSOs will be preferentially brightened above our threshold. We test this by artificially dimming the DLA sample with a representative value for the GL magnification from Section 4, : is added to , and and is reduced accordingly for each DLA sight-line. Table 2 shows only a marginal increase in for this test.
Test 3: Primary targets. All SDSS QSOs were included in our sample, rather than just those targeted by SDSS as QSOs based on their photometric colours. This represents a slight inhomogeneity in our sample selection. We have tested this by removing all ‘secondary’ QSO targets from the sample and repeating the analysis. The lack of DLA reddening is robust to this test (Table 2).
Test 4: BALs. Only the most severe BAL QSOs were removed from the sample in Section 2 since DLAs could still be easily detected towards moderate BAL QSOs. However, it is possible (though improbable) that heavily saturated Fe iii 1122 BALs may mimic DLAs. It is also well known that BALs are somewhat redder than ‘normal’ QSOs (e.g. , Reichard et al.2003), though any differential colour between DLA and control samples should not be effected. To test these possibilities we removed those QSOs which, by visual inspection, have some BAL features, particularly near the C iv emission line. A similar proportion ( per cent) of such BALs was found in the DLA and control samples. Once again, Table 2 shows robust results.
Test 5: DR1. Schneider et al. (2003) formed a homogeneous QSO catalogue from the SDSS DR1 (Abazajian et al., 2003). We applied our analysis to this DR1 QSO sample using the DR2 spectra since Abazajian et al. (2004) note the spectrophotometry of the DR2 is much improved. Although the DLA sample is small, we find consistent results using the Schneider et al. selection (Table 2).
Test 6: -split. The rest-frame composite SDSS QSO spectrum of Vanden Berk et al. (2001) shows an increased continuum level between Å and Å due to many Fe ii emission lines. The SDSS spectra extend to Å so our fitting method will recover systematically redder spectral indices at . Again, there should be no differential shift between DLA and control sample. Nevertheless, we split the samples at as a general consistency test. Table 2 shows the DLA sample to be somewhat bluer (redder) than the control sample for the low- (high-) portions. Though only marginally significant, we note this shift here and will test it with larger data-sets in future work.
Test 7: -split. The rest equivalent width of the DLA line should be a measure of the H i column density, (H i). was determined over a rest-frame window and so, for heavily damped systems, some absorption may be missed. Continuum errors and Ly forest blending also contribute significantly to errors in . Nevertheless, if high-(H i) DLAs cause more dust-reddening, splitting the sample into low- and high- ( Å) sub-samples may reveal this. Table 2 shows no significant difference between the distributions for these sub-samples.
To test the robustness of the result against the incompleteness at low-H i mentioned in Section 2, we have also analysed the distributions for the DLA detections and non-detections found by PHF04. Just 35 out of the 64 detected DLA sight-lines pass our (more restrictive) selection criteria. The measured slope, , corresponding to , may indicate some evidence for dust-reddening and, therefore, some evidence for high dust-to-gas ratios in low-H i DLAs. This result is dominated by just two quite red () DLA sightlines: removing these two QSOs from the analysis gives (). Interestingly, these two DLAs have quite low H i according to PHF04, H i–. Thus, a potentially important caveat to the above non-detection of DLA dust-reddening is that, due to incompleteness of the DLA selection at low-H i, our method is somewhat insensitive to an anti-correlation between dust-to-gas ratio and H i in DLAs.
4 DLA Gravitational lensing
4.1 Magnitude distributions
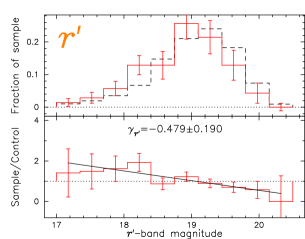
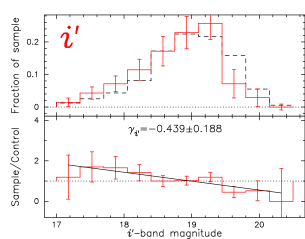
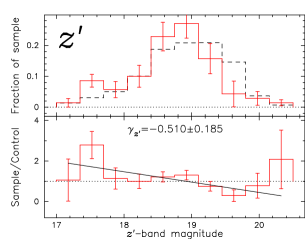
Following the analysis of MP03, Fig. 5 compares the DLA and control PSF magnitude distributions, corrected for Galactic extinction. Fig. 5 shows an excess of bright and/or a deficit of faint QSOs with DLAs relative to the control sample. The best-fitting slopes, , to the DLA/control ratio and the rms of for the bootstrap samples are given in Table 2 (test 1b) for each band , and . All slopes are significant at .
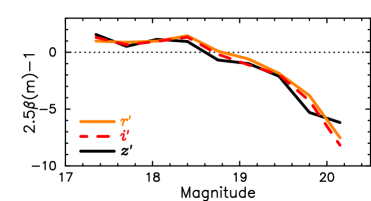
Is the effect in Fig. 5 the signature expected from GL? MP03 note two main competing effects: (i) the flux density from the QSO is increased by the magnification factor , and (ii) the solid angle in which lensed QSOs appear is increased, reducing the probability of observing them. MP03 show that a relative excess or deficit of lensed QSOs is expected depending on and the gradient, , of the control sample source counts as a function of magnitude, : , where is the number ratio of lensed to unlensed QSOs and . Fig. 6 shows for the , and bands: given the control samples in Fig. 5, GL should produce a relative excess of lensed QSOs for and a relative deficit for in all bands. Note that the SDSS magnitude limit for QSOs is whereas that for is (Richards et al., 2002). Effectively, this implies that the derived faint-end slopes in Fig. 6 are too negative. However, using only QSOs we see no appreciable change in Fig. 6. The results in Fig. 5 are therefore qualitatively consistent with a GL interpretation.
As in MP03, a simple illustrative example demonstrates plausible quantitative agreement: consider a DLA at an impact parameter of from a lens with an isothermal matter distribution and velocity dispersion . For , , , and , the magnification factor is . Fig. 6 therefore implies expected gradients in Fig. 5. A more detailed comparison clearly requires precise knowledge of the DLA impact parameters and host-galaxy halo-masses.
4.2 Robustness and potential systematic effects
Despite the above result’s low statistical significance (), Table 2 shows it is quite robust. Test 1 is particularly important since, by setting the threshold too low, DLAs towards fainter QSOs may be preferentially missed and the effect observed in Fig. 5 may be artificially produced. Ellison et al. (2004) note that such an effect may have produced a GL-like signature in their sample of 47 strong Mg ii absorbers at . Indeed, with a threshold of 2 per pixel, where we do find a deficit of low-S/N DLA-bearing sight-lines, Table 2 shows more negative slopes, . However, we see similar results even with a more conservative threshold of 4 per pixel where DLA detection is much more reliable.
MP03 explored some alternative explanations for the putative GL effect. One important potential systematic error was DLA dust obscuration producing a relative excess of faint QSOs in the DLA sample. In Section 3 we derived a limit on the colour excess induced by SMC-like dust in the DLAs, . This corresponds to a total extinction of just in the rest-frame -band of the DLAs. Therefore, the GL magnification dominates the dust obscuration in the SDSS DLA sample.
5 Discussion and conclusions
The SDSS provides a homogeneous QSO database which is ideal for studying DLA properties with respect to large, carefully selected control samples. We have utilised the SDSS DR2 to search for two important effects DLAs may have on background QSO light: dust-reddening and gravitational lensing (GL).
We find no evidence for dust-reddening of QSOs by foreground DLAs. The 70 sight-line DLA sample has a spectral index distribution consistent with that of our combined control sample (Fig. 3), ruling out overall shifts of at . This corresponds to a limit on the colour excess due to SMC-like dust of (). Note that this is broadly consistent with the reddening expected from the level of Fe depletion with respect to Zn found in most DLAs. For a typical DLA with metallicity and dust-depletion factor , the dust-to-gas ratio is times that found in the local ISM. For H i, this implies a shift in of just (PFB91) or for a SMC extinction law. The concept of a ‘typical’ for DLAs is, however, a poor one since [Zn/H] and [Zn/Fe] vary from DLA to DLA by more than 1.5 and 0.8 dex respectively. For example, is found for DLAs containing H2 (Ledoux et al., 2003). Nevertheless, future comparison of dust-reddening and depletion in a large sample of DLAs may lead to constraints on DLA dust grain size and/or composition.
Our results are inconsistent with the those of PFB91 who found a mean . The metallicities and dust-depletion factors for PFB91’s DLAs are not especially different to those of the overall DLA population. We suggest that small-number statistics may have affected their results. Two notable differences between the SDSS and PFB91 QSO samples are that the SDSS contains much fainter QSOs and extends to slightly higher and . Though an increase in between the median of the two samples ( and ) may contribute to this difference, evolution strong enough to entirely explain the discrepancy is unlikely given the results of various abundance studies (e.g. Prochaska et al., 2003; Murphy et al., 2004; Curran et al., 2004). Since SDSS is a colour-selected survey, a population of DLAs with high H i and high cannot be ruled out, leaving open concerns about biases in current estimates of the cosmological neutral gas mass density, (e.g. Boisse et al., 1998). However, our results provide direct evidence that dust-extinction is quite low in the known DLA sample, consistent with indirect estimates from abundance studies which have been used to argue that any heavily reddened population of DLAs is small (Prochaska & Wolfe, 2002). Finally, we note that our DLA selection is incomplete at low-H i and so our result is relatively insensitive to a possible (though seemingly unlikely) anti-correlation between and H i in DLAs.
We have also identified a possible signature of gravitational magnification of QSOs by foreground DLAs in a similar vein as MP03. We expect an excess of bright QSOs with DLAs and a deficit of faint QSOs with DLAs relative to our control sample, where the dividing line should fall at th magnitude in , and . This is indeed what is observed (Fig. 5). The amplitude of gravitational magnification, measured from the slope of the DLA/control ratio versus magnitude, also broadly agrees with that expected in a simple model of the QSO-DLA lensing system. The putative lensing signal, though significant only at , is robust against a variety of systematic error and bias checks. Furthermore, a higher equivalent width sub-sample of DLAs gives a stronger signal, as would be expected if these DLAs had lower impact parameters. Refining the above results with future SDSS samples is clearly important for future constraints on the dark matter halos of DLA host-galaxies.
Acknowledgments
We thank Bob Carswell, Michael Fall, Paul Hewett and Max Pettini for discussions and the referee, Jason Prochaska, for a speedy and helpful review. MTM thanks PPARC for support at the IoA under the observational rolling grant. Funding for the creation and distribution of the SDSS Archive has been provided by the Alfred P. Sloan Foundation, the Participating Institutions, the National Aeronautics and Space Administration, the National Science Foundation, the U.S. Department of Energy, the Japanese Monbukagakusho, and the Max Planck Society.
References
- Abazajian et al. (2003) Abazajian K. et al., 2003, AJ, 126, 2081
- Abazajian et al. (2004) Abazajian K. et al., 2004, AJ, 128, 502
- Boisse et al. (1998) Boisse P., Le Brun V., Bergeron J., Deharveng J., 1998, A&A, 333, 841
- Curran et al. (2004) Curran S. J., Webb J. K., Murphy M. T., Carswell R. F., 2004, MNRAS, 351, L24
- Ellison et al. (2004) Ellison S. L., Churchill C. W., Rix S. A., Pettini M., 2004, ApJ, accepted, preprint (astro-ph/0407237)
- Ellison et al. (2001) Ellison S. L., Yan L., Hook I. M., Pettini M., Wall J. V., Shaver P., 2001, A&A, 379, 393
- Fall & Pei (1989) Fall S. M., Pei Y. C., 1989, ApJ, 337, 7
- Fall & Pei (1993) Fall S. M., Pei Y. C., 1993, ApJ, 402, 479
- Fall et al. (1989) Fall S. M., Pei Y. C., McMahon R. G., 1989, ApJ, 341, L5
- Gregg et al. (2002) Gregg M. D., Lacy M., White R. L., Glikman E., Helfand D., Becker R. H., Brotherton M. S., 2002, ApJ, 564, 133
- Lanzetta et al. (1991) Lanzetta K. M., McMahon R. G., Wolfe A. M., Turnshek D. A., Hazard C., Lu L., 1991, ApJS, 77, 1
- Ledoux et al. (2003) Ledoux C., Petitjean P., Srianand R., 2003, MNRAS, 346, 209
- Ménard & Péroux (2003) Ménard B., Péroux C., 2003, A&A, 410, 33
- Murphy et al. (2004) Murphy M. T., Curran S. J., Webb J. K., 2004, in Duc P.-A., Braine J., Brinks E., eds, IAU Symp. Ser. Vol. 217, Recycling intergalactic and interstellar matter. Astron. Soc. Pac., San Francisco, CA, U.S.A, p. 252
- Ostriker & Heisler (1984) Ostriker J. P., Heisler J., 1984, ApJ, 278, 1
- Outram et al. (2001) Outram P. J., Smith R. J., Shanks T., Boyle B. J., Croom S. M., Loaring N. S., Miller L., 2001, MNRAS, 328, 805
- Pei (1992) Pei Y. C., 1992, ApJ, 395, 130
- Pei et al. (1991) Pei Y. C., Fall S. M., Bechtold J., 1991, ApJ, 378, 6
- Pettini et al. (1997) Pettini M., King D. L., Smith L. J., Hunstead R. W., 1997, ApJ, 478, 536
- Prochaska et al. (2003) Prochaska J. X., Gawiser E., Wolfe A. M., Castro S., Djorgovski S. G., 2003, ApJ, 595, L9
- Prochaska & Herbert-Fort (2004) Prochaska J. X., Herbert-Fort S., 2004, PASP, 116, 622
- Prochaska & Wolfe (2002) Prochaska J. X., Wolfe A. M., 2002, ApJ, 566, 68
- (23) Reichard T. A. et al., 2003, AJ, 125, 1711
- Richards et al. (2002) Richards G. T. et al., 2002, AJ, 123, 2945
- Richards et al. (2003) Richards G. T. et al., 2003, AJ, 126, 1131
- Schneider et al. (2003) Schneider D. P. et al., 2003, AJ, 126, 2579
- Stoughton et al. (2002) Stoughton C. et al., 2002, AJ, 123, 485
- Vanden Berk et al. (2001) Vanden Berk D. E. et al., 2001, AJ, 122, 549
This paper has been typeset from a TeX/LaTeX file prepared by the author.