New Perspectives on the X-ray Emission of HD 104237 and Other
Nearby Herbig Ae/Be Stars from XMM-Newton and Chandra
Abstract
The origin of the X-ray emission from Herbig Ae/Be stars is not yet known. These intermediate mass pre-main sequence stars lie on radiative tracks and are not expected to emit X-rays via solar-like magnetic processes, nor are their winds powerful enough to produce X-rays by radiative wind shocks as in more massive O-type stars. The emission could originate in unseen low-mass companions, or it may be intrinsic to the Herbig stars themselves if they still have primordial magnetic fields or can sustain magnetic activity via a nonsolar dynamo.
We present new X-ray observations of the nearby Herbig Ae star HD 104237 (= DX Cha) with XMM-Newton, whose objective is to clarify the origin of the emission. Several X-ray emission lines are clearly visible in the CCD spectra, including the high-temperature Fe K complex. The emission can be accurately modeled as a multi-temperature thermal plasma with cool (kT 1 keV) and hot (kT 3 keV) components. The presence of a hot component is compelling evidence that the X-rays originate in magnetically confined plasma, either in the Herbig star itself or in the corona of an as yet unseen late-type companion. The X-ray temperatures and luminosity (log LX = 30.5 ergs s-1) are within the range expected for a T Tauri companion, but high resolution Chandra and HST images constrain the separation of a putative companion to 1′′. We place these new results into broader context by comparing the X-ray and bolometric luminosities of a sample of nearby Herbig stars with those of T Tauri stars and classical main-sequence Be stars. We also test the predictions of a model that attributes the X-ray emission of Herbig stars to magnetic activity that is sustained by a shear-powered dynamo.
1 Introduction
The nearest star-forming regions are dominated by populations of young low-mass pre-main-sequence (PMS) stars, or T Tauri stars. Hundreds of T Tauri stars have now been identified in the Taurus-Auriga, Chamaeleon, and Rho Ophiuchus molecular clouds at distances of 160 pc. Their masses are less than 2 M⊙ and they are the progenitors of late-type main sequence stars such as the Sun. In contrast, more massive PMS stars are rare in nearby star-forming regions. These elusive objects evolve rapidly onto the main sequence and can remain optically obscured during much of their PMS phase. However, a few nearby optically-bright PMS stars of intermediate mass (2 - 10 M⊙) are known. They are generally categorized as Herbig Ae/Be stars (Herbig 1960; Herbig & Bell 1988), which are thought to be more massive analogs of classical T Tauri stars (CTTS). They are often located in or near molecular clouds in the vicinity of T Tauri stars and have properties similar to CTTS including H emission, infrared excesses indicative of circumstellar material (disks, envelopes, or both), and poorly-understood photometric and spectroscopic variability (Appenzeller 1994; Finkenzeller & Mundt 1984, hereafter FM84; Herbig 1994; Hillenbrand et al. 1992). In addition, mass outflows are often detected (FM84; Garrison & Anderson 1977; Garrison 1978; Skinner, Brown, & Stewart 1993).
One of the nearest known Herbig Ae stars is HD 104237 (= DX Cha), lying in the recently discovered Cha group at a Hipparcos distance of 116 pc (Perryman et al. 1997; van den Ancker, de Winter, & Tjin A Djie 1988, hereafter AWD98). This star has attracted considerable observational attention because of its proximity, optical brightness (V = 6.6 mag), and relatively low visual extinction AV 1 mag. Its properties are summarized in Table 1. It does not lie in a molecular cloud but molecular gas has been detected in its vicinity (Knee & Prusti 1996) and age estimates range from 2 - 5 My (AWD98; Feigelson, Lawson, & Garmire 2003, hereafter FLG03; Grady et al. 2004, hereafter G04). A spectral type of A4IVe was assigned in the early study of Hu et al. (1991), but more recent observations with the Hubble Space Telescope (HST) suggest a later spectral type of A7IVe (Brown et al. 1997) or A7.5Ve - A8Ve (G04).
Observations with the Infrared Space Observatory (ISO) reveal a clear IR excess and a strong 10 m silicate feature (Meeus et al. 2001). The IR excess can be modeled in terms of a passive irradiated disk with a small but uncertain outer radius of 10 - 20 AU (Dominik et al. 2003). The HST has traced a bipolar jet-like outflow (HH 669) with at least three emission knots down to angular separations of 0.125′′ from the star (Woodgate et al. 2002; G04). There has also been a report of the detection of a close companion in HST and infrared images at a separation of 1.365′′ 0.019′′, possibly a M3-4 T Tauri star (Danks et al. 2001; G04).
ASCA detected HD 104237 as a moderately bright X-ray source, as reported by Skinner & Yamauchi (1996; hereafter SY96). The X-ray detection of HD 104237 has recently been confirmed in two higher angular resolution Chandra observations that were obtained as part of a limited snaphsot survey of Herbig stars (FLG03). This snapshot survey also detected the Herbig stars HD 100546 (B9Vne), HD 141569 (B9.5Ve), and HD 150193 (A1Ve). These high angular resolution Chandra detections substantiate earlier reports of X-ray emission from Herbig stars, including eleven X-ray detections obtained with the Einstein observatory (Damiani et al. 1994) and a surprisingly high detection rate of nearly 50% in a sample of 30 Herbig Ae/Be stars observed by ROSAT (Zinnecker & Preibisch 1994, hereafter ZP94; Preibisch & Zinnecker 1996).
The apparent presence of X-ray emission from Herbig stars is difficult to explain in the context of current theories of stellar X-ray emission. Herbig Be stars and earlier Ae stars are on radiative tracks and are not expected to have the outer convection zones needed to sustain internally-generated magnetic fields. Consequently, X-ray emission from magnetically-trapped coronal plasma such as occurs in the Sun and other cool stars is not expected. However, some recent evolutionary models such as those of Siess, Dufour, & Forestini (2000) suggest that later Herbig Ae stars of spectral types A6e - A8e could have very thin convection zones (Giardino et al. 2004), thus raising the interesting possibility of incipient solar-like magnetic activity in later Ae stars (see also Sec. 7.3). Finally, it is very unlikely that the X-ray emission of Herbig Ae stars arises in radiative wind shocks, as may be the case for much more massive O-type stars. The instabilities that are thought to produce X-ray emitting shocks in the supersonic winds of O stars are not predicted to occur in the more benign winds of Ae stars, which typically have velocities v∞ 200 - 600 km s-1 and ionized mass loss rates 10-7 M⊙ yr-1 (FM84; Skinner, Brown, & Stewart 1993). Furthermore, X-ray temperatures of several keV have now been detected in Herbig Ae stars (including HD 104237), and such temperatures are inconsistent with the soft emission predicted by radiative wind shock models (SY96).
A possible explanation of the X-ray emission from Herbig stars is that it arises from faint late-type companions. However, Chandra’s arcsecond angular resolution is now placing tight upper limits on the separation of such putative X-ray companions from the Herbig star. As discussed in more detail below, Chandra observations of HD 104237 show that the X-ray peak is offset by 1′′ from the stellar optical position, thus ruling out the faint star seen 1.365′′ away by HST as the X-ray source. Although Chandra’s angular resolution is not sufficient to exclude the presence of a cool secondary at separations of 1′′, the recent HST observations fail to find any evidence for a T Tauri companion at separations 0.05′′ 1.0′′ (G04). This still does not rule out an unseen companion at 0.05′′, but it is worth keeping in mind that other factors could lead to intrinsic X-ray emission from Herbig stars themselves. Of potential importance is their extreme youth and rapid rotation. Their ages are usually less than a few million years (Strom et al. 1972; Hillenbrand et al. 1992) and typical rotational velocities are sin 80 - 150 km s-1 (Finkenzeller 1985; Böhm & Catala 1995). Interestingly, a much lower value sin = 12 2 km s-1 has been measured for HD 104237 by Donati et al. (1997). HST observations indicate that this low sin is probably a result of the system being viewed nearly pole-on at an inclination angle = 18∘ (G04).
Because of their youth, primordial magnetic fields inherited from the parent molecular cloud may still be present, and a marginal detection of a magnetic field in HD 104237 has been reported by Donati et al. (1997). It has also been suggested that the shear energy in a young rapidly-rotating star might give rise to a nonsolar dynamo, allowing an internally-generated field to be sustained in the youngest Herbig stars that decays rapidly over a few million years (Tout & Pringle 1995; Vigneron et al. 1990). If magnetic fields are indeed present, they could lead to magnetic plasma confinement and X-ray emission.
We present here new X-ray observations of HD 104237 obtained with XMM-Newton that were motivated by the unanswered question of the origin of X-ray emission from Herbig stars. The new data provide higher signal-to-noise CCD spectra and X-ray light curves than were previously available. Based on the inferred plasma properties, we argue for a magnetic origin for the X-ray emission. We use previously published and archived X-ray data for a distance-limited sample of Herbig stars to make comparisons with lower mass T Tauri stars and classical Be stars. We show that if Herbig stars are the evolutionary precursors of classical Be stars then a substantial falloff in the X-ray luminosities of Herbig stars is expected after they reach the main sequence, and a possible link with the similar behavior predicted by shear-dynamo theory is noted.
2 Observations
2.1 XMM-Newton Observations
Table 2 summarizes the XMM-Newton observations. Further information on the X-ray telescope is given by Jansen et al. (2001). Our analysis is based on CCD images, spectra, and light curves from the European Photon Imaging Camera (EPIC). Data were acquired simultaneously with the EPIC-PN camera (Strüder et al. 2001) and two nearly identical EPIC-MOS cameras (MOS-1 and MOS-2; Turner et al. 2001). The PN and MOS cameras provide a 30′ diameter field-of-view and energy coverage from 0.2 - 15 keV, moderate energy resolution (E/E 20 - 50), and 6′′ FWHM angular resolution on-axis.
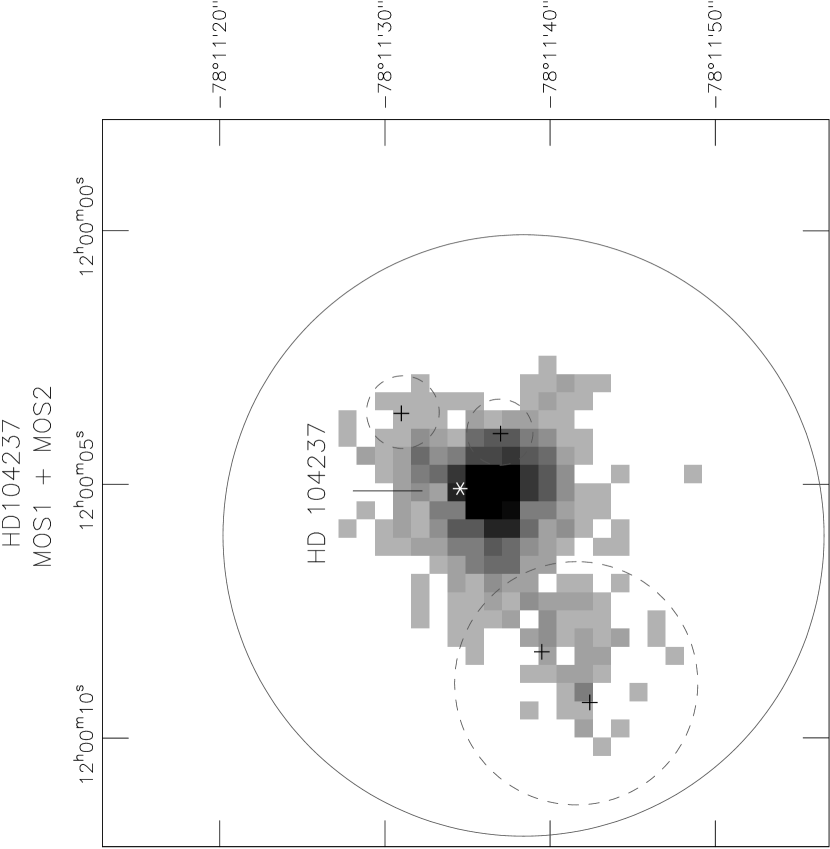
Data reduction followed standard procedures using the XMM-Newton Science Analysis System software (SAS vers. 5.4.1). Pipeline-processed events files generated using the most current calibration data were filtered with evselect to select good event patterns. Spectra and light curves were extracted from the filtered events lists within a circular region of radius Re 18′′ centered on HD 104237 (Fig. 1). This radius corresponds to 75% of the encircled energy at 1.5 keV. Response matrix files (RMFs) and auxiliary response files (ARFs) tailored to the specific observational parameters were generated using the SAS tasks and . The ARF file corrects the measured source flux for energy that falls outside of the Re 18′′ extraction region.
As discussed below (Sec. 3.0.1), four faint X-ray sources lie at separations of 4.1′′ - 15′′ from HD 104237. We attempted to remove some of the contamination these nearby sources by excluding events within small circular regions centered on their positions, which are accurately known from higher resolution Chandra images (Fig. 2). These smaller exclusion regions are shown as dashed circles in Figure 1. This strategy can remove some - but not all - of the contamination from these nearby sources. Specifically, sources B and C (Fig. 2) lie in the wings of the XMM-Newton point-spread function (PSF) at separations of 4.1′′ - 5.8′′ from HD 104237, and cannot be spatially resolved from the Herbig star at XMM-Newton’s spatial resolution.
Background was extracted from source-free regions on the detector near HD 104237. Spectra were analyzed using XSPEC v. 11.1 and light curve analysis was undertaken with XRONOS v. 5.18 111Further information on XSPEC and XRONOS can be found at http://heasarc.gsfc.nasa.gov/lheasoft/xanadu. They are part of the XANADU software package maintained by the High Energy Astrophysics Science Archive Research Center (HEASARC) at NASA’s Goddard Space Flight Center.. Spectra were rebinned to a minimum of 15 counts per bin for analysis and all spectral models included an absorption component based on Morrison & McCammon (1983) cross sections.
2.2 Chandra Archive Observations of HD 104237
We have made use of two short 3 ks exposures of HD 104237 available in the Chandra public archive. Each of these exposures provides only 400 counts for HD 104237 and they are thus of limited use for spectral analysis. However, the images obtained with Chandra’s higher angular resolution (90% encircled energy radius 2′′ at 1.5 keV) and well-calibrated boresight provide crucial information on the position of the bright X-ray source relative to the optical position of HD 104237 as well as precise locations of fainter sources within 15′′ of HD 104237. The positions of these fainter sources cannot be accurately measured in the lower resolution XMM images.
The Chandra observations were obtained with the ACIS-I detector in Faint/Timed mode on 5 June 2001 (ObsId 2404, 2.96 ks) and 4 Feb 2002 (ObsId 3428, 2.83 ks) with HD 104237 positioned 1.7′ off-axis. Level 2 data products generated during Chandra X-ray Center standard processing were further processed using CIAO software vers. 2.2.1 222Further information on Chandra Interactive Analysis of Observations (CIAO) software can be found at http://asc.harvard.edu/ciao in order to incorporate observation-specific bad pixel files and apply standard aspect corrections and energy filters. A more complete description of the Chandra observations can be found in FLG03, and Chandra instrumentation is described in the Chandra Proposer’s Observatory Guide (POG) 333http://asc.harvard.edu/proposer/POG/ and in Weisskopf et al. (2002).
3 Results
3.0.1 X-ray Images and Source Identification
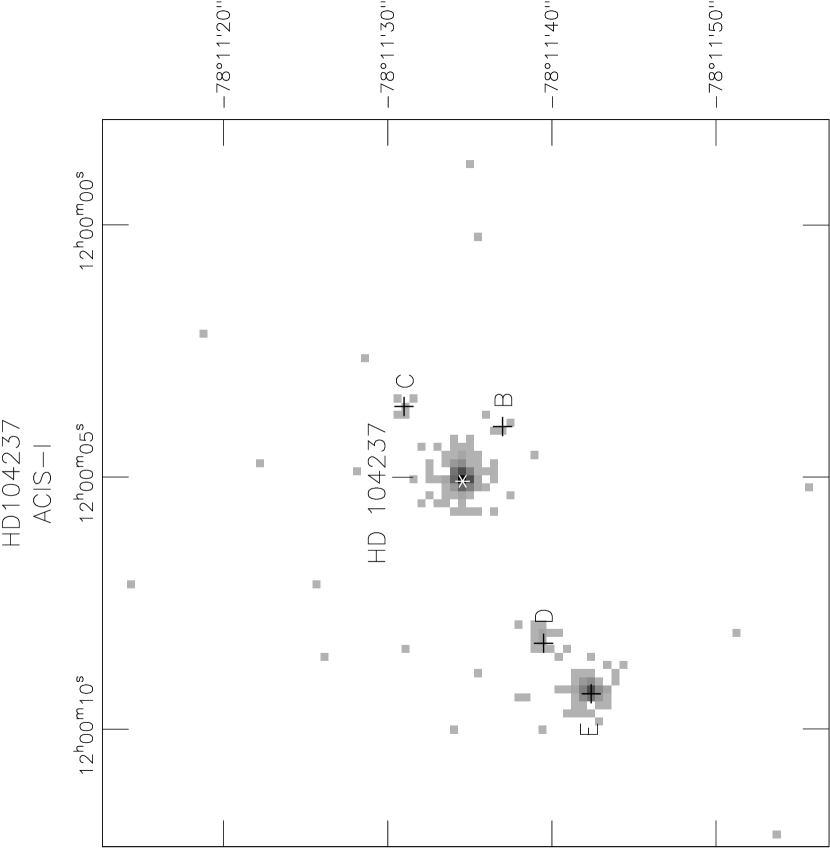
Figure 1 shows the unsmoothed full resolution XMM-Newton image in the immediate vicinity of HD 104237 using summed data from the nearly identical MOS1 and MOS2 detectors. The MOS data provide somewhat better image quality than does PN because of the smaller 1.1′′ MOS pixel size, which fully samples the telescope PSF. Figure 2 shows the same region imaged by Chandra ACIS-I on 4 Feb 2002. Both images clearly show a prominent X-ray source near the HD 104237 optical position, and the Chandra image also reveals four fainter sources within 15′′ of HD 104237. These are labeled as B,C,D, and E for consistency with the notation used in FLG03. Additional information on the optical and X-ray properties of these four faint sources is given in FLG03 and G04.
The first Chandra image obtained on 5 June 2001 is similar to the second image shown in Figure 2 except that source C was not detected in the first observation. After applying the standard aspect correction to the first Chandra image and correcting the Hipparcos position for proper motion to the epoch of the Chandra observation, the position of the pixel having maximum brightness is offset by only 0.52′′ from the Hipparcos position of HD 104237 (Perryman et al. 1997), and by 0.56′′ from its near-IR position in the 2MASS Point Source Catalog. Similarly, the offsets between the Chandra peak positions of sources D and E and their 2MASS counterparts identified below are 0.54′′ and 0.55′′, respectively. Our comparison of the Chandra and 2MASS images suggests that these offsets could very likely be reduced to 0.2′′ - 0.3′′ by cross-registration. However, an astrometric solution was not attempted because of the small number of X-ray sources detected in the short Chandra exposures. Even without cross-registration, the above comparisons indicate that the Chandra positional accuracy relative to the Hipparcos and 2MASS frames is already better than 0.6′′, in agreement with results from Chandra calibration studies 444http://asc.harvard.edu/cal/ASPECT/.
Sources B and C are separated from HD 104237 by only 4.1′′ - 5.8′′ and cannot be clearly resolved at XMM’s lower spatial resolution. Thus, our X-ray flux measurements based on XMM-Newton spectra will contain a small contribution from these two sources. Even so, their contribution to the total flux is expected to be minor since their respective Chandra count rates were 2% and 7% of the HD 104237 count rates. Sources D and E are offset from HD 104237 by 11′′ - 15′′ and are visible in the XMM-Newton image as extended structure to the southeast (Fig. 1). They were classified as T Tauri stars by FLG03 and are visible in the near-IR as 2MASS 120008297811395 and 2MASS 120009317811424. A comparison of the two Chandra observations shows that sources C and E are variable, but C is very faint (6 counts) and was only detected in the second observation.
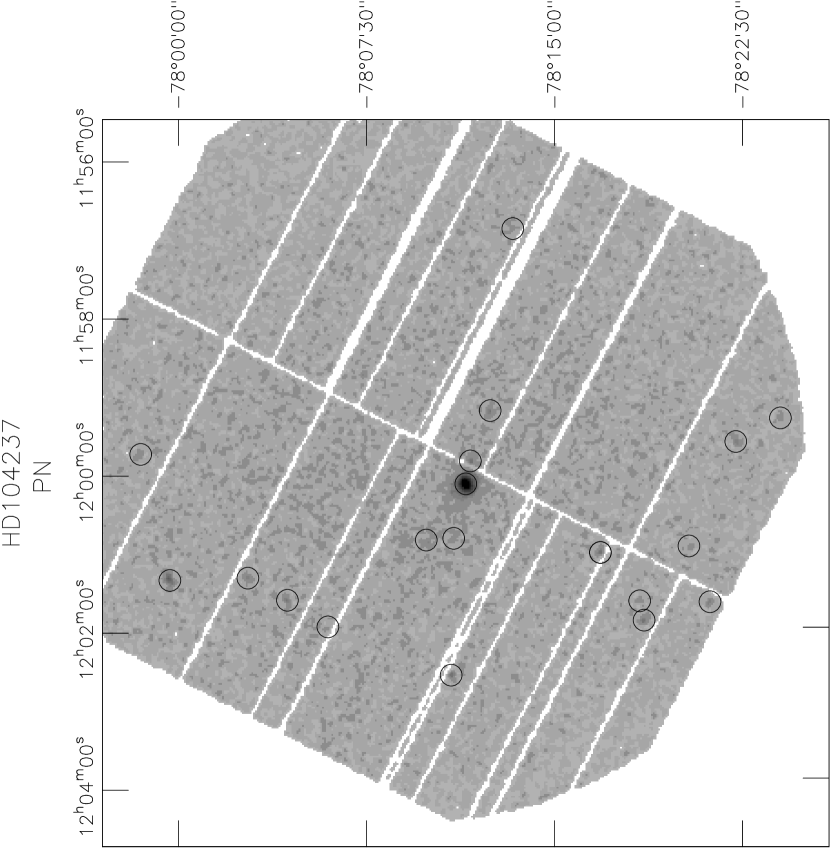
Several other X-ray sources are present in the EPIC images, as listed in Table 3 and shown in Figure 3. The source list in Table 3 is based on a visual comparison of the PN and MOS images with the list of PN sources detected in the 0.5 - 4.5 keV range as part of the standard XMM-Newton pipeline processing. This processing uses the SAS sliding box detection algorithm eboxdetect along with maximum-likelihood task emldetect for PSF fitting. Table 3 includes only those PN sources that were also confirmed to be present in one or both MOS detectors, thus minimizing spurious detections at the risk of omitting some faint sources. Candidate near-IR or optical counterparts lying within 5′′ of the X-ray positions were found for 9 of the 19 sources in Table 3, two of which are late-type stars. These identifications are based on searches of the 2MASS all-sky Point Source Catalog and the SIMBAD database.
The B9Vn star Cha lies 2.2′ southwest of HD 104237 and they form a common proper motion pair. Molecular gas has been detected around Cha and it may be a young object (Knee & Prusti 1996), but it lacks the emission lines needed to be classified as a Herbig Be star. We did not detect Cha with XMM-Newton, nor was it detected in the Chandra observations. The upper limit obtained from the EPIC PN image is log LX (0.5 - 7 keV) 27.8 ergs s-1. Here we have assumed a 1 keV thermal plasma spectrum with an absorption NH = 1.1 1021 cm-2 corresponding to AV = 0.5 mag (Knee & Prusti 1996), and a Hipparcos distance of 112 pc. The Chandra upper limit log LX 27.7 ergs s-1 (FLG03) is slightly more stringent because of Chandra’s much lower detector background.
3.0.2 X-ray Variability
Figure 4 shows the background-subtracted EPIC-PN X-ray light curve of HD 104237 in the [0.5 - 5] keV range. We have used this restricted energy range for light curve analysis in order to minimize the possibility of contamination from soft and hard background photons.
No large-amplitude variations are visible in the PN light curve but a slow falloff in the count rate is apparent. This decline is also seen in the background-subtracted MOS light curves and in PN light curves constructed with other energy filters including a soft filter in the range [0.5 - 2.0] keV and a hard filter of [2.0 - 5.0] keV. The mean count rate for the PN light curve in Figure 4 is = 0.25 0.04 c s-1 (1 ). During the first 4 ks of the observation the mean is = 0.27 0.03 c s-1 while the last 4 ks gives = 0.23 0.03 c s-1. The probability of a constant count rate from a analysis of the PN light curve binned at 200 s intervals is Pconst = 0.18 and smaller values Pconst 0.01 are obtained from the summed MOS1 MOS2 light curve.
As an additional check for variability, we have applied the Kolmogorov-Smirnov (KS) test (Press et al. 1992) to the unbinned PN event list, using events in the [0.5 - 5] keV range from a contiguous good-time interval during the last 9880 s of the observation. For the event extraction region shown in Figure 1, the KS test gives Pconst = 0.001. If we instead use a simpler extraction region consisting of all events inside a small circle of radius Re = 8′′ centered on HD 104237, then the KS test gives Pconst = 0.068.
The above results suggest that low-level variablity is quite likely present in the light curve. However, the origin of the variability remains ambiguous because of the nearby faint sources that are not clearly resolved from HD 104237 at XMM-Newton’s angular resolution. Our analysis shows that the apparent low-level variability is present using source extraction regions centered on HD 104237 with radii as small as Re = 6′′ - 7′′. Such a small extraction region excludes most of the photons from sources D and E, but contains photons from sources B and C in addition to those from HD 104237. Thus, sources D and E are not likely to be responsible for the variability. The most probable origin would then be HD 104237 itself, or sources B or C, or perhaps an as yet undetected close companion to HD 104237. We emphasize that even though the XMM-Newton observation has insufficient angular resolution to rule out variability from sources B or C, the two Chandra observations found no significant variability in source B and showed that source C is very faint (FLG03).
The two Chandra exposures were separated by eight months in time and provide an additional check for variability. Even though the exposures were short (3 ks each), there is little or no contamination of the X-ray light curves by nearby sources B,C,D, and E because of Chandra’s higher angular resolution. The light curves show count rate fluctuations at the 2 level but no statistically significant variability was found in either Chandra observation. However, the mean count rate during the second observation was somewhat higher than the first. The first observation detected 382 20 counts in 2.96 ks within a circle of radius 3.9′′ centered on HD 104237, giving a mean rate in the 0.5 - 7 keV range = 0.13 0.01 (1) c s-1. Using the same extraction region, the second observation gave 477 22 counts in 2.83 ks and = 0.17 0.01 c s-1 (0.5 - 7 keV). These count rates may slightly underestimate the true values because of moderate photon pileup in ACIS-I. The 30% higher count rate during the second observation may reflect real long-term variability, but the inferred change is of low statistical significance because of the scatter in the two light curves.
Slowly declining light curves similar to that detected by XMM-Newton have been seen in other pre-main sequence stars, such as the CTTS Haro 5-59 in Orion (Fig. 7 of Skinner, Gagné, & Belzer 2003). In some cases, the decline lasts for at least a day. The origin of such slow variability is not yet understood but possible explanations include the late decay phase of an X-ray flare that occurred prior to the observation or dynamical effects such as the rotation of an active region out of the line-of-sight. The absence of a detectable change in hardness ratio or temperature in the XMM-Newton light curve of HD 104237 suggests that the slow variability was due to a change in the emission measure, perhaps through dynamical effects. Obviously, longer term monitoring over timescales of days to weeks is needed to more accurately characterize the level of the variability and further constrain its origin.
3.0.3 XMM-Newton Spectra
Figure 5 shows the EPIC-PN spectrum, which provides a higher signal-to-noise (S/N) ratio for spectral analysis than the MOS. Three emission line features are clearly visible and are identified with transitions in the following He-like ions, where Elab is the laboratory line energy and Tmax (K) is the temperature at which the line emits maximum power: Si XIII (Elab = 1.86 keV, log Tmax = 7.0), Ca XIX (Elab = 3.90 keV, log Tmax = 7.4), and the Fe K complex which includes Fe XXV (Elab = 6.67 keV, log Tmax = 7.6). The individual components of the He-like triplets are not spectrally resolved by the PN or MOS detectors. The Fe K complex is confirmed in the lower S/N MOS spectra and provides unambiguous evidence for hot plasma.
Fluorescent Fe I K? In addition to the obvious line detections listed above, our analysis of the unbinned photon event list from the PN detector shows a weak feature at an energy slightly above 6.4 keV. A Gaussian fit of this feature gives a mean energy E = 6.46 [6.36 - 6.61; 90% conf.] keV. This feature is not present in the background spectrum. If real, this feature could be a weak detection of fluorescent emission from neutral iron (Fe I K) in cold material surrounding the star. Such fluorescent iron lines have recently been detected by Chandra in other hot stars such as the classical Be star Cas (Smith et al. 2004). However, we caution that: (i) the statistical significance of this detection is low, (ii) the feature is not seen in the lower S/N MOS data for HD 104237, and (iii) some blending of this feature with higher energy photons from the Fe K complex (6.67 keV) could be present at the spectral resolution of the PN detector (which is 0.13 keV at 6.5 keV). It is thus clear that more sensitive observations will be needed to determine if Fe I K emission is indeed present.
X-ray Temperatures and EM Distribution: Acceptable fits of the spectrum were obtained using absorbed variable-abundance multi-temperature optically thin plasma models, as summarized in Table 4. For these fits, we used the vapec model as implemented in XSPEC v. 11.1. In addition, fits of comparable quality were obtained with the differential emission measure (DEM) model c6pvmkl, which approximates the DEM using a sixth order Chebyshev polynomial.
Single-temperature (1T) vapec models were not acceptable, but satisfactory fits were obtained using both two-temperature (2T) and three-temperature (3T) models, with 3T models giving slightly better fits as shown in Figure 5 (see also Table 4). The 2T and 3T models are qualitatively similar in that they both require cooler plasma at kT 1 keV and a hotter component at kT 3 keV. However, the 3T model requires higher absorption and places a larger fraction of the total emission measure (EM) in cooler plasma below 1 keV. Acceptable fits were obtained with the 2T and 3T models using an Fe abundance that is consistent with solar, but an overabundance is inferred for Ca and perhaps Ne.
The hotter component at kT 3 keV is anticipated from high-temperature features such as the Fe K line complex and was also required to fit previous ASCA spectra (SY96). At lower temperatures, both the 2T and 3T models require a component at kT 0.6 keV and the 3T model yields a slight fit improvement to the low-energy part of the spectrum by adding a third very soft component at kT 0.15 keV whose EM is quite uncertain. This soft component is heavily absorbed and accounts for only 6% of the observed (absorbed) flux in the PN spectrum. Because of the marginal fit improvement gained by adding this very soft component, its low contribution to the observed flux, and calibration uncertainties at low energies, its physical reality is open to question. The acceptable fits obtained by both 2T and 3T models illustrate the ambiguity that is often present in physical interpretations of moderate resolution CCD spectra. The discrete-temperature 2T and 3T models are simple approximations of what is likely to be a more complex plasma temperature distribution.
DEM models also show a double-peaked structure with a cool peak below 1 keV and a hotter peak above 3 keV. The temperatures at which these peaks occur are somewhat sensitive to abundance assumptions but are typically in the range kT 0.25 - 0.6 keV for the cool component and kT 4 - 5 keV for the hot component. DEM models converge to an absorption NH (1.9 - 2.0) 1021 cm-2, which is consistent with the values derived from 3T models.
Abundances: Fits with the 2T model using solar abundances (Anders & Grevesse 1989) were not acceptable. We thus allowed the abundances of Ne, Mg, Si, S, Ca, and Fe to vary, and in doing so were able to obtain acceptable fits (Table 4). The fit improvement obtained by using variable abundances is significant in the 2T model but marginal in the 3T model. Even though improved fits were obtained with variable abundances, it should be kept in mind that CCD spectra from PN and MOS provide only moderate spectral resolution and thus cannot provide definitive abundance estimates because of blended lines.
Only in the case of Ca did we find a significant departure from solar abundances, with values of 6.6 - 9.9 solar inferred, albeit with large uncertainties (Table 4). This overabundance is required to fit the line feature near 3.9 keV, which is identified as Ca XIX. Ar XVIII Ly also emits near this energy but we are unable to fit the feature by varying the Ar abundance. Also, there is no obvious detection of the Ar XVIII Ly line near 3.3 keV, which should be several times stronger than the line near 3.9 keV in the temperature range of interest here. Thus, Ca XIX is the most likely line identification. Neon is the only other element whose abundance converges to nonsolar values at the 90% confidence level in vapec fits. The 2T and 3T vapec models yield a Ne abundance of about twice solar (Table 4).
Absorption and Visual Extinction: Using the results in Table 4 and the conversion from NH to AV of Gorenstein (1975), the 2T model implies a visual extinction AV = 0.35 [0.24 - 0.48] mag, while the 3T model gives AV = 1.01 [0.54 - 1.40] mag, where brackets enclose 90% confidence intervals. DEM models give values AV 0.9 mag that are comparable to the 3T model. Optical studies based on the Hipparcos distance have given values in the range AV = 0.3 mag (AWD98) to AV = 0.9 mag (Malfait, Bogaert, & Waelkens 1998). Thus, the X-ray derived values are within the range inferred from optical data.
Extraction Region Comparisons: The above results are based on the extraction of source events using the region shown in Figure 1. In order to determine if the spectral analysis results are sensitive to the extraction region used, we extracted a PN spectrum using a simpler region consisting of all events inside a small circular region of radius Re = 8′′ centered on HD 104237. Fits of this spectrum with a 2T model yielded nearly identical values of NH, kT1, and observed flux to those given in Table 4. The inferred value of kT2 was 23% less than that in Table 4, but its 90% confidence range overlaps that in Table 4. We thus conclude that our spectral analysis results are robust to changes in the source extraction region.
3.0.4 Chandra Spectra
We have analyzed the photon event lists for the two Chandra observations and extracted ACIS-I spectra as well as source-specific RMF and ARF files using the CIAO tool psextract. Because of the low number of counts (382 - 477 counts per spectrum), no corrections for charge transfer inefficiency were applied and we made use of a priori information on absorption and abundances from the XMM-Newton spectra to reduce the number of free parameters in spectral fits.
The photon energy distributions for HD 104237 are similar for the two Chandra observations. Using events in the 0.5 - 7 keV range, the mean photon energy in the first observation was E = 1.26 0.67 (1) keV, while the second observation gave E = 1.40 0.83 (1) keV.
We have fitted the spectrum of the second Chandra observation with a 2T vapec model, fixing the absorption NH and abundances at the values determined from model fits of the higher S/N XMM-Newton spectra (Table 4). The 2T fit yields temperatures that are very similar to those obtained with XMM, namely kT1 = 0.76 [0.64 - 0.84] keV and kT2 = 3.0 [2.1 - 5.6] keV, where brackets enclose 90% confidence intervals. The observed (absorbed) flux of the second Chandra observation determined from the 2T model is 22% less than that measured by XMM-Newton (Table 4). The 3T model gives somewhat better agreement, with the observed Chandra flux being 10% less than that of XMM-Newton (Table 4). Some (or perhaps all) of the excess flux measured by XMM-Newton relative to Chandra no doubt comes from the two faint nearby sources B and C, which cannot clearly be separated from HD 104237 at XMM-Newton’s lower spatial resolution (Fig. 1).
4 X-ray Data for Other Nearby Herbig Stars
In the discussion below (Sec. 5), we will compare the properties of several nearby Herbig stars which have been detected in X-rays. Some of these detections are based on new or unpublished results, and we summarize these before proceeding.
Elias 1 (V892 Tau): This Herbig Ae star in the Taurus dark clouds was detected in the ROSAT survey of ZP94. A companion located 4.1′′ to the NE has been detected in high-resolution VLA radio observations (Skinner, Brown, & Stewart 1993) and in the near-infrared (Leinert et al. 1997). There is no definitive evidence so far of any companion at closer separations.
Giardino et al. (2004) have analyzed Chandra and XMM-Newton observations of Elias 1. Variability was detected in the 18 ks Chandra light curve, with impulsive changes in the count rate of a factor of two, suggestive of low-level flaring. Analysis of the Chandra spectrum with a 1T thermal plasma model gave a characteristic temperature kT 2 keV and log LX (0.5 - 7.5 keV) = 30.2 ergs s-1, the latter value being comparable to earlier ROSAT results (Table 5). The XMM-Newton observation detected a large high-temperature flare that was attributed to Elias 1, to within the XMM-Newton absolute pointing accuracy of 4′′.
The detection of rapid X-ray variability and hot plasma is a signature of magnetic activity. This is an important result if the emission is intrinsic to the Herbig star Elias 1 and not due to an as yet undetetected lower mass companion. Because of the unusual X-ray properties of Elias 1, further searches for a close companion are clearly warranted.
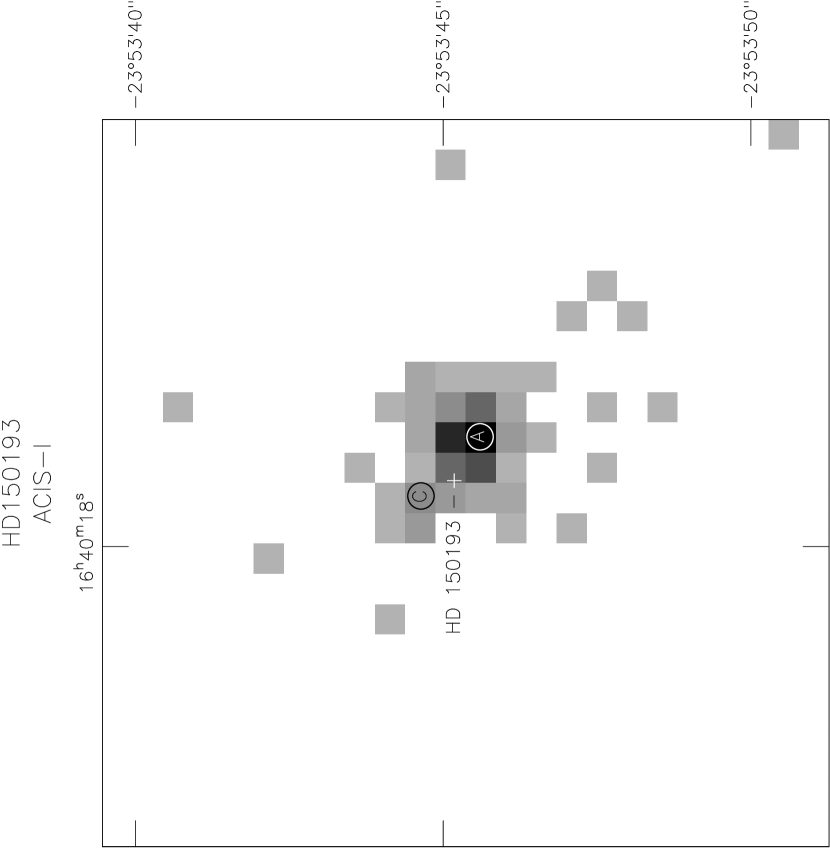
HD 150193: This Herbig Ae star was detected as a double X-ray source in the 2.92 ks Chandra snapshot observation of FLG03, shown in Figure 6. A faint source (C) is located 1.36′′ NE (PA = 50∘ 5∘) of the brighter X-ray peak (A). We use abbreviations (A) and (C) to identify bright X-ray peak and the faint source to its NE, consistent with the notation in FLG03. Near IR observations also show a double source, with the bright IR source being 2.2 mag brighter at K band and lying 1.1′′ NE (PA = 56∘) of the faint IR source (Pirzkal, Spillar, & Dyck 1997). The nearly identical separations and position angles suggest a one-to-one correspondence between the two sources seen in the X-ray and IR images. However, because of the close separation there is some ambiguity as to which source is the Herbig star.
Our measurements of the X-ray positions of the two sources in the aspect-corrected Chandra image (Fig. 6) indicate that the X-ray peak of the faint northerly source lies closer to the optical position of HD 150193, with a position offset of 0.6′′. Thus, the faint X-ray source (C) is most likely the Herbig star. To match the relative geometry seen in the IR image, we then associate the faint northern X-ray source (C) with the bright northern IR source. That is, the Herbig star is faint in X-rays but bright in the near-IR. The X-ray bright source to the south is then associated with the fainter IR companion to the south. Note that this interpretation is different than that given by FLG03, who associated the brighter southern X-ray source (A) with the brighter northern IR source. In that case, there is no Chandra X-ray counterpart to the fainter southern IR source. We estimate 17 counts for the faint northern X-ray source (C) that we associate with HD 150193. The PIMMS simulator555The Portable Interactive Multi-Mission Simulator (PIMMS) is a software tool developed and maintained by HEASARC at NASA’s GSFC. For documentation, see http://heasarc.gsfc.nasa.gov/docs/software/tools. then gives log LX (0.5 - 7 keV) = 29.2 ergs s-1 (Table 5).
HD 163296: This Herbig star of spectral type A1Ve was observed for 10.7 ks with the ROSAT High Resolution Imager (HRI) on 31 March 1995. The archived image (rh202032n00) shows a clear detection of a source within 2′′ of the optical position of HD 163296. Using PIMMS, the HRI count rate of 0.012 c s-1 gives an intrinsic luminosity log LX (0.5 - 7 keV) = 29.8 ergs s-1 (Table 5). This value of LX is very similar to that of other Herbig A0-1e stars such as AB Aur.
Close scrutiny of the apparent X-ray detection of HD 163296 is warranted because this star emits strongly in the UV (log Teff (K) = 3.97, AWD98) and the HRI is known to be sensitive to UV radiation. This UV sensitivity was apparent in HRI calibration observations of the A0V star Vega (V = 0.03 mag), which gave a count rate of 0.10 c s-1 and a soft photon pulse height channel distribution. This count rate was much larger than expected based on HRI UV leak predictions (David et al. 1999; see also Berghöfer, Schmitt, & Hünsch 1999 and Barbera et al. 2000). A previous analysis concluded that the HRI count rate of HD 163296 was compatible with that expected for UV leaks (Grady et al. 2000). However, we have reexamined the HRI data and reach a different conclusion, as discussed below.
If we make the worst-case assumption that the Vega count rate was due entirely to UV leaks, then a calculation based on the V magnitude of HD 163296 (V = 6.85; Thé et al. 1985) gives a predicted count rate due to UV contamination of 1.9 10-4 c s-1, which is 60 times less than observed. An alternative calculation using the HRI UV leak calibration derived by Berghöfer, Schmitt, & Hünsch (1999) and U = 6.99 mag for HD 163296 gives a predicted rate due to UV leaks of 1.3 10-5 c s-1, or a factor of 900 less than observed. In addition, we find that the pulse height channel distribution of photons detected from HD 163296 by HRI is significantly harder than that of Vega. Based on these UV leak count rate predictions and photon hardness considerations, we conclude that the HRI observation yielded a valid X-ray detection of HD 163296. We thus include HD 163296 in our analysis of Herbig star X-ray sources below.
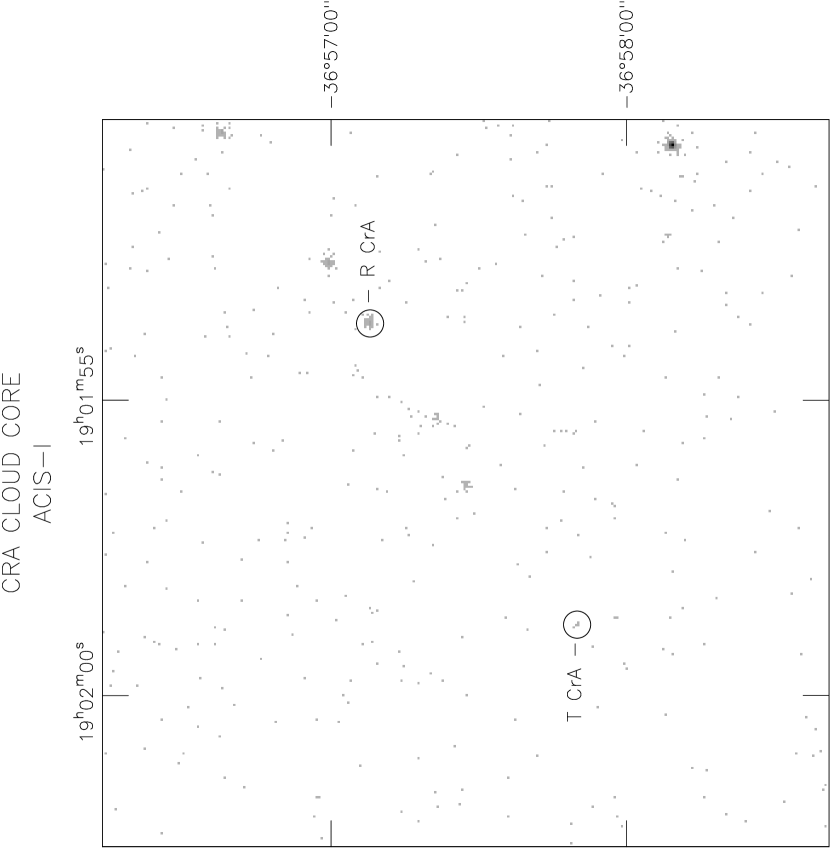
R CrA and T CrA: These two stars are of interest because of their proximity in the nearby Corona Australis dark cloud. We assume a distance of 150 pc (FM84), but values in the literature range from 130 pc (Hillenbrand et al. 1992) to 170 pc (Knude & Hg 1998). R CrA has a variable spectrum (A1e - F7e) and T CrA is classified as F0-5e (FM84; Hillenbrand et al. 1992). Because of its later Fe spectral type, T CrA is not strictly a member of the Herbig star class but is often included in Herbig star catalogs because of its similar properties. Neither of these two stars was detected in the ROSAT survey of ZP94. We have analyzed an archived 19.7 ks Chandra observation of the CrA dark cloud obtained on 7 October 2000 (ObsId = 19) which shows a clear detection of R CrA and a probable detection of T CrA (Fig. 7). We obtain 68 8 counts for R CrA and 4 2 counts for T CrA in the 0.5 - 7 keV range. The emission from T CrA is faint but very likely real because of the low ACIS-I background (1 count) and the good agreement between the stellar and X-ray positions (offset = 0.97′′ after applying the recommended aspect correction). Using the PIMMS simulator, we obtain intrinsic luminosities log LX (0.5 - 7 keV) = 29.1 for R CrA and log LX = 27.9 (ergs s-1) for T CrA (Table 5). Since T CrA is a marginal detection, its LX could be interpreted more conservatively as an upper limit.
5 X-ray Versus Bolometric Luminosities in Nearby Herbig Stars
Sensitive X-ray observations of several different star-forming regions have revealed a statistically significant correlation between the X-ray and bolometric luminosities of T Tauri stars. This correlation has been confirmed in Chandra observations of the young cluster IC 348 (Preibisch & Zinnecker 2002), the Orion Nebula Cluster (Feigelson et al. 2003), and the embedded infrared cluster in NGC 2024 (Skinner, Gagné, and Belzer 2003). These studies consistently find a ratio log (LX/Lbol) 3.75 1.0, where the large scatter is probably due in part to X-ray flaring. A correlation of LX with stellar mass was also found in IC 348 and the Orion Nebula Cluster. The physical origin of these correlations is not yet known but they are thought to be fundamentally linked to the X-ray emission process.
It would thus be of considerable interest to determine if a relation between LX and Lbol also exists in Herbig stars, since they are thought to be more massive counterparts of CTTS. However, the observational issues are more complex in the case of Herbig stars. Unlike T Tauri stars, there are no large codistant samples of Herbig stars in nearby clusters on which to base a statistical study. Instead, Herbig stars are sparsely distributed over many different star-forming regions spanning a range of uncertain distances and ages.
To make an initial comparison between LX and Lbol, we have identified ten nearby Herbig stars (d 200 pc) whose distances are relatively well-known from Hipparcos parallaxes or by association with dark clouds. Their LX and Lbol values are listed in Table 5 and plotted in Figure 8, normalized to the quoted distances. All stars in this subsample have been detected in X-rays and their LX values were determined from recent Chandra observations (FLG03), the ROSAT survey of ZP94, and our own analysis of archived Chandra and ROSAT data. Bolometric luminosities were taken from the literature (AWD98; Berrilli et al. 1992). We note that there are conflicting values of the luminosity of Elias 1 in the literature (Berrilli et al. 1992; Hillenbrand et al. 1992). This subsample consists of stars of spectral type B9e or later and does not include early B-type stars, which typically lie beyond 500 pc and have very uncertain distances.
Since the data are based on an incomplete distance-limited sample, they do not answer the question of whether LX and Lbol are correlated in the larger population of Herbig stars, of which more than 100 are presently known. However, several interesting trends can be seen in Figure 8. First, the values 6.2 log (LX/Lbol) 4.7 are clearly smaller than that observed for TTS and larger than that usually found in OB stars. This suggests that if the X-ray emission is intrinsic to the Herbig stars themselves (as opposed to a companion origin), then the efficiency of the X-ray emission process as gauged by LX/Lbol ratios is lower than in TTS. Second, the range in log LX is consistent with that found for TTS. Third, even for the restricted range in Lbol of this subsample, the scatter in LX is large (1.0 dex) but is still comparable to the scatter observed in TTS.
Figure 8 also includes two emission-line stars of later Fe spectral type for which Chandra data exist. These are the weakly-detected star T CrA (F0-5e) and the spectroscopic binary AK Sco (F5F5IVe; FLG03), which consists of two nearly identical Fe stars of masses M∗ 1.4 M⊙ in a 13.6 day orbit (Alencar et al. 2003). Even though these stars are not members of the Herbig Ae/Be class, they may be slightly lower mass analogs. Despite the nearly identical spectral types and similar Lbol values for these two stars, there is a remarkable difference in their LX, with the binary AK Sco being more than an order of magnitude brighter in X-rays. This comparison shows that the presence of a companion has by some means greatly increased the X-ray output of AK Sco. It is tempting to speculate that the much fainter X-ray emission of T CrA may be more representative of young single Fe-type stars. However, there are hints that even T CrA may be a binary. Even though no companion was detected in K-band speckle images (Ghez et al. 1997), the position spectra of Takami, Bailey, & Chrysostomou (2003) suggest that a faint companion could be present at a separation 0.14′′. Since this lower limit is larger than the limit imposed by the Ghez et al K-band speckle images, Takami et al. concluded that if a companion is present it must be fainter than K = 10.5 mag.
6 Comparison With Classical Be Stars
Classical Be stars are B-type stars on or near the main sequence that exhibit line emission above the photospheric spectrum, as recently reviewed by Porter and Rivinius (2003). The evolutionary status of classical Be stars is not well-understood. However, they are rapid rotators, as are Herbig Ae/Be stars. This has led to the suggestion that Herbig stars might be the evolutionary precursors of classical Be stars (Finkenzeller 1985; Palla 1991).
Figure 8 shows the approximate region in the (Lbol, LX) plane occupied by classical main-sequence BVe stars, based on a search of the ROSAT all-sky survey (RASS) catalog of optically bright OB stars compiled by Berghöfer, Schmitt, & Cassinelli (1996). Most BVe stars detected in the RASS had 29.5 log LX 31.0 ergs s-1, and a few undetected stars had upper limits as low as log LX 28.5 ergs s-1.
As can be seen in Figure 8, the range of LX values for classical BVe stars is very similar to that of our Herbig star sample, but the LX/Lbol ratios are clearly smaller for BVe stars. For BVe stars detected in the RASS, typical values are log (LX/Lbol) = 6.4 0.5, whereas the Herbig star sample has log (LX/Lbol) = 5.4. This comparison indicates that if the X-ray emission is intrinsic to the Herbig stars and if they do eventually evolve into classical Be stars, then their LX/Lbol ratios must decline by roughly an order of magnitude after reaching the main sequence. Since no significant increase in Lbol is expected as a Herbig star evolves onto the main sequence, the above evolutionary scenario would imply that LX must drop sharply. A dramatic decrease in LX during the early main sequence phase is predicted by the shear-induced dynamo model, as discussed in more detail below (Sec. 7.3).
7 X-ray Emission Mechanisms
7.1 General Constraints on Emission Mechanisms
An analysis of several different possible X-ray emission mechanisms for HD 104237 was given by SY96 based on ASCA spectra. They examined the feasibility of wind shock and accretion shock models as well as models involving magnetic confinement (coronae; wind-fed magnetospheres). They argued that shock models and magnetically-confined wind models could not explain the hotter plasma seen in the ASCA spectrum and concluded that the X-rays most likely originate in a magnetically confined region such as a corona. However, ASCA’s moderate angular resolution could not distinguish between X-ray emission from HD 104237 and other sources within 30′′, as can now be done (Fig. 2).
The spectral properties derived from the new XMM-Newton data are very similar to those obtained with ASCA and strengthen the previous conclusions of SY96. In particular, the existence of hot plasma at or above kT 3 keV (35 MK) is now substantiated by the detection of high-temperature features such as the Fe K shell complex in the EPIC spectra. These high temperatures are incompatible with the predicted values of kT 1 keV from wind shock and accretion shock models, assuming a wind speed 500 km s-1 and free-fall speed 560 km s-1 for a Herbig Ae star of 2 M⊙ (SY96). Shock models can account for the hotter plasma only if the actual wind speeds or infall speeds exceed the above estimates by a factor of two or more.
On the other hand, plasma temperatures of kT 3 keV are quite typical of magnetically active stars, including T Tauri stars. This value is well above the hydrogen escape temperature Tesc 13 MK (assuming M∗ = 2.3 M⊙, R∗ = 2.7 R⊙; Table 1) and it is therefore likely that the emission arises in magnetically-confined plasma. This could occur either in the corona of an as yet undetected late-type companion or perhaps in the Herbig star itself, as discussed further below.
7.2 X-ray Emission from Late-Type Companions
The companion hypothesis attributes the X-ray emission to a fainter low-mass companion star, rather than the Herbig star itself. This avoids the need to postulate magnetic fields in an intermediate mass star that is presumed to be non-convective, thus circumventing the contradiction with models based on the solar paradigm which associate magnetic fields with convection. Assuming that the companions are coeval with the Herbig star primary, they would most likely be T Tauri stars or perhaps optically-obscured class I infrared sources in the case of the youngest Herbig stars.
As already noted, fainter sources have been found in the immediate vicinity of HD 104237. These include the weak X-ray sources B and C detected by Chandra (Fig. 2) and the report of a faint star at an offset of 1.365′′ and PA = 254.6∘ 0.35∘ detected in HST STIS images (G04). However, it is obvious from the Chandra image in Figure 2 that the faint sources B and C are not the origin of the strong X-ray emission detected at or near the HD 104237 optical position since they are clearly visible as secondary peaks lying 4′′ - 6′′ to the west.
It is also unlikely that the faint star at a separation of 1.365′′ detected by HST is the origin of the X-ray emission associated with HD 104237, for three reasons. First, an offset of 1.365′′ between the X-ray and optical positions would have been discerned at the positional accuracy of the Chandra image, which is better than 0.6′′ (Sec. 3.0.1). Second, the position angle of this faint star relative to HD 104237 is inconsistent with the PA of the X-ray peak relative to the HD 104237 optical position. The centroid and peak-pixel X-ray positions lie 0.4′′ - 0.5′′ to the north of the Hipparcos optical position (Fig. 2), while the faint M-type companion lies 1.365′′ to the W/SW at PA = 254.59∘ Third, the X-ray luminosity log LX = 30.5 0.1 (ergs s-1) of the bright source detected here is at least an order of magnitude larger than typically observed for M3-4 TTS (e.g. Preibisch & Zinnecker 2002).
Since the M-type star at 1.365′′ separation is not the primary X-ray source, the X-ray emission must arise from HD 104237 itself or from an as yet undetected companion at a separation 1.365′′. Our comparison of the X-ray and optical positions (Fig. 2) indicates that the dominant X-ray source lies within 0.6′′ of the Herbig star optical position. HST results provide an additional constraint by excluding a T Tauri companion at separations 0.05′′ 1.0′′ (G04). Taken together, the X-ray and HST observations imply that if the X-ray emission is due to an as yet undetected T Tauri companion, it must lie very close to HD 104237 at a separation 0.05′′.
As Figure 7 shows, the X-ray luminosities determined for nearby Herbig stars are within the range observed for T Tauri stars. Also, the scatter in log LX for this subsample of Herbig stars is 1.0 dex, which is comparable to that of TTS. Thus, from the standpoint of X-ray luminosities alone, one cannot exclude close T Tauri companions as the origin of the X-ray emission from Herbig stars. Assuming that all of the X-ray emission attributed to HD 104237 arises in an as yet undetected T Tauri companion, then the canonical relation log (LX/Lbol) 3.75 for TTS yields a bolometric luminosity log Lbol 34.25, or Lbol 4 - 5 L⊙ for the putative companion. However, this value is highly uncertain because of the scatter in the LX versus Lbol relation for TTS.
7.3 Intrinsic X-ray Emission from Herbig Stars
The alternative to the companion hypothesis is that some, or all, of the X-ray emission is due to the Herbig star itself. Assuming that magnetic confinement is necessary to explain the observed high-temperature plasma, then the emission could very well arise in a corona. Another possibility is a magnetically-confined wind shock, as has been proposed to explain the X-ray emission of some magnetic Ap-Bp stars such as IQ Aur (Babel & Montmerle 1997). However, this model gives temperature predictions kT 1 keV that are similar to non-magnetic shock models, assuming wind speeds v∞ 400 - 600 km s-1 typical of Herbig Ae stars. Thus, this model cannot explain the high-temperature plasma at kT 3 keV.
In late-type stars, an outer convection zone is thought to be necessary to support magnetic (e.g. coronal) activity via a solar-like dynamo. The region in the HR diagram where surface convection zones first appear is somewhat uncertain, as recently reviewed by Favata & Micela (2003). However, the ROSAT detection of intrinsic X-ray emission from Altair (A7IV-V) (Schmitt 1997) provides compelling evidence that surface convection is already present in some late A-type stars. The recent classification of HD 104237 as A7.5Ve - A8Ve based on HST observations (G04) thus raises the interesting possibility that some of its X-ray emission might be associated with surface convection. However, the evolutionary tracks of Siess et al. (2000) suggest that a surface convection zone in HD 104237 would be quite thin, amounting to 0.9% of the stellar radius (assuming Teff = 7300 K, log [L∗/L⊙] = 1.42). It is not obvious why such a thin convection zone would give rise to an X-ray luminosity that is 1000 times greater than that of Altair, which has a similar A7V spectral type. It may thus be that other factors, perhaps associated with youth, lead to elevated X-ray emission levels of Herbig stars - as discussed below.
It has been suggested that coronal X-ray emission could be sustained in a young rapidly-rotating Herbig star via a magnetic field set up by non-solar dynamo action that is powered by rotational shear energy. This possibility was explored by Vigneron et al. (1990) in the theoretical framework of sheared stratified fluids. A later development of this model by Tout & Pringle (1995, hereafter TP95) provides a quantitative prediction of the X-ray luminosity versus age, LX(t), but makes no temperature predictions. In the TP95 formulation,
| (1) |
In the above, the initial X-ray luminosity LXo depends on the stellar mass M∗, radius R∗, change in the star’s angular velocity between its center and surface (), breakup velocity (), and two dimensionless parameters of the theory and according to (eq. 4.4 of TP95)
| (2) |
For computational purposes, it is assumed that / 1 (TP95). The parameters and are not well-determined empirically, with being the fraction of magnetic flux that is dissipated at the stellar surface to heat coronal plasma and the efficiency of magnetic field generation. The decay timescale t0 also depends on , M∗, and R∗. For fiducial values 10-3 and 3 10-5 (TP95), the decay timescale for Herbig Ae stars of mass M∗ 2 - 3 M⊙ of interest here is t0 1 - 2 My. Thus, this mechanism could sustain magnetic activity in a Herbig Ae star for a few million years, but drops off rapidly as t-3 thereafter.
A comparison of the predicted LX from the above model with that measured for HD 104237 by ASCA was made by SY96. They assumed an earlier A4IVe spectral type, mass M∗ = 2.1 M⊙, radius R∗ = 2.6 R⊙, and age t 2 My. For these parameters, the model underestimated the observationally-determined LX by a factor of 4. But the more recent HST data suggest a later A8Ve spectral type, Teff = 7300 K, stellar luminosity L∗ = 26.3 L⊙, and an age t 5 My (G04). Using these parameters, the evolutionary tracks of Siess et al. (2000) give M∗ = 2.14 M⊙ and R∗ = 3.0 R⊙. In that case, the decay timescale is t0 2.2 My, and the model underestimates the X-ray luminosity (Table 1) by a factor of 25. The above calculations show that uncertainties in ages, masses, and theoretical parameters such as and currently limit observational tests of the TP95 model to order-of-magnitude comparisons.
We have made additional comparisons of the predicted LX from the TP95 model with the observed values listed for the other Herbig stars in Table 5. In these comparisons we have used stellar parameters given in the literature (i.e. AWD98) as well as our own estimates from the Siess et al. tracks, along with the fiducial values of and given above. Elias 1 was excluded from this comparison since it was not included in the AWD98 Hipparcos-based study and there are significant differences in reported values for its stellar luminosity and radius in the literature (e.g. Berrilli et al. 1992; Hillenbrand et al. 1992).
The model gives very good agreement for AB Aur and HD 97048, and it may be relevant that speckle techniques have so far failed to find any evidence for close companions around these two stars (Leinert, Richichi, & Haas 1997; Ghez et al. 1997). However, the model tends to underestimate LX by as much as an order-of-magnitude in other cases, as already noted above for HD 104237. The discrepancy could be even larger for the B9Ve star HD 141569 if its age is t 10 My (AWD98). However, a younger age t 5 3 My has been inferred based on its association with two young M-type common proper motion companions (Weinberger et al. 2000). If this younger age is correct, then the model prediction is within an order of magnitude of the observed value for HD 141569.
8 Summary
The main results of this study are the following:
-
1.
New X-ray spectra of the Herbig Ae star HD 104237 obtained with XMM-Newton provide the first clear detection of emission lines in this star, including Si XIII, Ca XIX, and the Fe K complex. The X-ray emission arises in an absorbed multi-temperature thermal plasma with cool (kT 1 keV) and hot (kT 3 keV) components. The inferred X-ray absorption is equivalent to an extinction AV 0.3 - 1.0 mag, with best-fit models converging toward the high end of this range. This range is consistent with that determined from optical studies.
-
2.
The presence of hot plasma at kT 3 keV is not consistent with shock model predictions, but is typical of values observed in magnetically-active PMS stars such as T Tauri stars. We conclude that the emission arises in magnetically-confined plasma, substantiating earlier ASCA results. The XMM-Newton light curve shows signs of slow variability at the 15% level on a timescale of hours, and a comparison of two Chandra observations taken eight months apart also suggests that low-level variability may be present. More persistent time monitoring over longer timespans is needed to confirm the suspected variability and constrain the timescale(s). If short-term (hours) variability is confirmed, it would lend further support to a magnetic interpretation for the X-ray emission. The precise nature and location of the magnetically-confined region is not yet known, but a corona around the Herbig star (or an as yet unseen close companion) is a likely possibility.
-
3.
Archived Chandra images show that the X-ray emission peak is offset by 0.6′′ from the stellar optical position, which equates to a projected separation 70 AU at d = 116 pc. This small offset places stringent limits on the angular separation of a putative late-type X-ray companion, leaving open the possibility that some (or all) of the X-ray emission arises in the Herbig star itself.
-
4.
The X-ray luminosities of a sample of ten Herbig Ae/Be stars with reliable distances are in the range log LX = 29.9 1.0 (ergs s-1), which overlaps the range observed for T Tauri stars. Thus, X-ray emission from unseen T Tauri companions is not ruled out on the basis of LX considerations. For this distance-limited Herbig star sample, we obtain a mean ratio log (LX/Lbol) = 5.4, which is less than for T Tauri stars and greater than for classical BVe stars. If the hypothesis that Herbig stars evolve into classical BVe stars is true, then the LX values of Herbig stars must decrease dramatically after reaching the main sequence, and such a decrease is predicted by shear dynamo models.
-
5.
The shear dynamo model of Tout & Pringle (1995) provides an alternative to the companion hypothesis for explaining X-ray emission in Herbig stars. A comparison of the predictions of this model against known LX values for a sample of nine Herbig stars shows very good agreement in two cases (AB Aur and HD 97048). However, the model tends to underestimate LX in all other cases by as much as an order of magnitude. Several factors could account for this disagreement including uncertain ages and masses, poorly-known model parameters that characterize magnetic processes, and excess X-ray emission from unseen lower mass companions.
This study strongly suggests that the X-ray emission detected within 0.6′′ of the HD 104237 optical position is of magnetic origin. The question that remains is whether the emission is coming from the Herbig star itself, or from an as yet undetected companion. The existing Chandra images show that if the emission is due to a companion, then its separation is 1′′ from HD 104237. Recent HST images (G04) place a tighter constraint of 0.05′′ on the separation of a T Tauri companion. Such a close companion, if present, cannot be spatially resolved with existing X-ray telescopes. Even so, further progress on the companion issue may nevertheless be possible at X-ray wavelengths. For example, high-quality images and spectra comparable to those of HD 104237 could be obtained for a much larger sample of Herbig stars, selected from the more than one hundred known and candidate members of the class (Thé, de Winter, & Pérez 1994). A more extensive X-ray data base would provide more complete information on plasma properties (kT, EM distribution), the X-ray luminosity function, and positional offsets. This information could then be used in statistical comparisons to determine if the X-ray properties of T Tauri stars are significantly different from Herbig Ae/Be stars.
| Parameter | Value | NotesaaRefs. and Notes: (1) Hipparcos position from Perryman et al. (1997), corrected for proper motion to epoch J2000.0 (2) Hu et al. (1991) (3) Eggen (1995) (4) Brown et al. (1997) (5) Grady et al. (2004) (6) SIMBAD (7) van den Ancker et al. (1998) (8) Malfait et al. (1998) (9) 2MASS Point Source Catalog (10) The quoted mass and L∗ are from van den Ancker et al. (1998). The recent HST study of Grady et al. (2004) obtained log L∗ (L⊙) = 1.42 and Teff 7300 K, for which the evolutionary tracks of Siess et al. (2000) give M∗ = 2.1 M⊙. (11) this work; quoted value is the unabsorbed X-ray luminosity (0.5 - 7 keV) obtained by averaging the values obtained from 2T and 3T VAPEC models (Table 4) |
|---|---|---|
| RA (J2000) | 12h 00m 05.0846s | (1) |
| Decl. (J2000) | 78∘ 11′ 34.564′′ | (1) |
| Sp. Type | A4IVe; A7IVe; A7.5Ve - A8Ve | (2),(3),(4),(5) |
| d (pc) | 116 | (1) |
| V (mag.) | 6.6 | (6) |
| AV (mag) | 0.3 - 0.9 | (7),(8) |
| J, H, K (mag) | 5.8, 5.2, 4.6 | (9) |
| Mass (M⊙) | 2.3 | (7),(10) |
| log L∗ (L⊙) | 1.55 | (7),(10) |
| log LX (ergs s-1) | 30.5 0.1 | (11) |
| Parameter | Value |
|---|---|
| Start (UT) | 17 Feb 2002 15:50 |
| Stop (UT) | 17 Feb 2002 19:52 |
| Usable Exposure (ks) | 12.2 (PN), 14.4 (per MOS) |
| ObsId / Revolution | 0059760101 / 402 |
| EPIC Mode | Imaging - Full Window |
| Optical Filter | Thick |
NOTES:
6. The K0 star CPD77∘ 773 is offset by 2.4′′ from the X-ray position. Source lies near CCD gap; net counts may be underestimated.
7. Counts include nearby sources B,C,D, E (Fig. 2).
8. Not detected by pipeline processing, but visible in PN and MOS. Position is from MOS.
9. The multiple star CPD77∘ 775 is offset by 4.7′′ from the X-ray position.
12. Visible in PN but only weakly detected in MOS2.
13. Possible double or extended X-ray source. Peak position is from MOS.
19. Source lies near CCD gap; net counts uncertain.
| No. | Name | R.A. | Decl. | Net Counts | Identification |
|---|---|---|---|---|---|
| (J2000) | (J2000) | ||||
| 1 | J115646.4781325 | 11 56 46.47 | -78 13 25.0 | 42 12 | … |
| 2 | J115908.7781234 | 11 59 08.76 | -78 12 34.6 | 72 14 | 2M 11590798-7812322 |
| 3 | J115913.6782409 | 11 59 13.62 | -78 24 09.7 | 54 13 | … |
| 4 | J115932.3782223 | 11 59 32.37 | -78 22 23.1 | 90 14 | … |
| 5 | J115943.4775838 | 11 59 43.41 | -77 58 38.4 | 66 14 | … |
| 6* | J115948.0781147 | 11 59 48.06 | -78 11 47.4 | 46 12 | 2M 11594807-7811450; CPD77∘ 773 |
| 7* | J120005.9781136 | 12 00 05.93 | -78 11 36.6 | 7167 81 | 2M 12000511-7811346; HD 104237 |
| 8* | J120048.3781107 | 12 00 48.33 | -78 11 07.6 | 47 12 | … |
| 9* | J120049.6781001 | 12 00 49.63 | -78 10 01.9 | 57 18 | 2M 12004942-7809574; CPD77∘ 775 |
| 10 | J120054.9782030 | 12 00 54.92 | -78 20 30.7 | 38 11 | 2M 12005517-7820296 |
| 11 | J120059.8781658 | 12 00 59.85 | -78 16 58.8 | 122 32 | … |
| 12* | J120118.6780254 | 12 01 18.60 | -78 02 54.3 | 56 17 | 2M 12011809-7802522 |
| 13* | J120119.9775947 | 12 01 19.97 | -77 59 47.5 | 217 33 | 2M 12012042-7759478 |
| 14 | J120135.7780428 | 12 01 35.75 | -78 04 28.9 | 89 21 | … |
| 15 | J120137.9781832 | 12 01 37.95 | -78 18 32.2 | 38 11 | 2M 12013691-7818345 |
| 16 | J120139.0782120 | 12 01 39.04 | -78 21 20.2 | 67 20 | … |
| 17 | J120153.2781842 | 12 01 53.25 | -78 18 42.2 | 94 14 | 2M 12015251-7818413 |
| 18 | J120156.5780605 | 12 01 56.57 | -78 06 05.3 | 38 11 | … |
| 19* | J120235.0781059 | 12 02 34.96 | -78 10 59.3 | 92 21 | … |
| Parameter | 2T VAPEC | 3T VAPEC |
|---|---|---|
| NH (1021 cm-2) | 0.78 [0.53 - 1.06] | 2.25 [1.20 - 3.10] |
| kT1 (keV) | 0.58 [0.38 - 0.62] | 0.58 [0.46 - 0.63] |
| EM1 (1052 cm-3) | 4.46 [3.14 - 6.84] | 6.71 [2.91 - 9.06] |
| kT2 (keV) | 3.18 [2.78 - 3.47] | 2.92 [2.54 - 3.34] |
| EM2 (1052 cm-3) | 8.58 [7.34 - 10.1] | 9.26 [7.02 - 10.5] |
| kT3 (keV) | 0.15 [0.11 - 0.20] | |
| EM3 (1052 cm-3) | 8.95 [1.79 - 12.0] | |
| Abundances | variedaaBest-fit abundances relative to the solar values of Anders & Grevesse (1989) and 90% confidence intervals were: Ne = 2.3 [1.3 - 4.3], Mg = 2.0 [1.4 - 2.7], Si = 2.0 [1.2 - 3.2], S = 0.7 [0.0 - 2.3], Ca = 9.9 [4.5 - 14.7], Fe = 0.8 [0.5 - 1.1]. | variedbbBest-fit abundances relative to the solar values of Anders & Grevesse (1989) and 90% confidence intervals were: Ne = 2.2 [1.3 - 4.9], Mg = 1.7 [1.0 - 4.0], Si = 1.6 [1.0 - 3.7], S = 0.6 [0.0 - 2.1], Ca = 6.6 [1.5 - 13.1], Fe = 1.0 [0.7 - 1.8]. |
| /dof | 221.0/217 | 208.8/215 |
| 1.02 | 0.96 | |
| FX (10-12 ergs cm-2 s-1) | 1.30 (1.53) | 1.32 (2.41) |
| LX (1030 ergs s-1) | 2.46 | 3.88 |
Note. — Based on fits of the EPIC PN spectrum binned to a minimum of 15 photons per bin (Fig. 5) with the VAPEC optically thin plasma model. The tabulated parameters are absorption column density (NH), plasma temperature (kT), and emission measure (EM). Brackets enclose 90% confidence intervals. X-ray flux (FX) is the observed (absorbed) value followed in parentheses by the unabsorbed value in the 0.5 - 7.0 keV range. X-ray luminosity (LX) is the unabsorbed value in the 0.5 - 7.0 keV range. The flux excludes counts in the proximity of faint nearby sources detected in higher spatial resolution Chandra observations (Figs. 1 and 2). A distance of 116 pc is assumed.
| No. | Name | Sp. Type | d | log Lbol | log LX | X-ray |
|---|---|---|---|---|---|---|
| (pc) | (ergs s-1) | (ergs s-1) | refs. | |||
| 1* | HR 5999 | A5-7III/IVe | 210 | 35.51 | 30.78 | (1) |
| 2 | HD 104237 | A4IVe | 116 | 35.13 | 30.50 | (2,3,4) |
| 3* | Elias 1 | A0-6e | 140 | 35.16 | 30.28 | (1,5) |
| 4 | HD 141569 | B9.5Ve | 99 | 34.93 | 30.10 | (2) |
| 5* | HD 163296 | A1Ve | 122 | 35.06 | 29.80 | (6) |
| 6* | AB Aur | A0Ve | 144 | 35.26 | 29.50 | (1) |
| 7 | HD 100546 | B9Vne | 103 | 35.09 | 29.40 | (2) |
| 8* | HD 150193 | A1Ve | 150 | 35.05 | 29.25 | (7) |
| 9* | R CrA | A1e-F7e (var) | 150 | 35.74 | 29.09 | (7) |
| 10* | HD 97048 | B9-A0e | 180 | 35.19 | 28.96 | (1) |
| 11* | AK Sco | F5F5IVe | 150 | 34.46 | 29.10 | (2) |
| 12* | T CrA | F0-5e | 150 | 34.58 | 27.88 | (7) |
Note. —
1. LX is from ZP94, adjusted to 210 pc.
3. Spectral type has been listed as A0 (FM84) or A6e (HB88).
5. LX is from PIMMS, using ROSAT HRI rate 0.012 c s-1, NH = 5.5 1020 cm-2 (AV = 0.25 mag), and 1 keV Raymond-Smith (RS) plasma model. See text.
6. LX is from PIMMS, using ROSAT PSPC rate 8.85 10-3 c s-1 (ZP94), NH = 1.1 1021 cm-2 (AV = 0.5 mag), and 1 keV RS plasma model.
8. LX is from PIMMS, using Chandra ACIS-I rate 5.82 10-3 c s-1, NH = 3.5 1021 cm-2 (AV = 1.6 mag), and 1 keV RS plasma model. See text.
9. LX is from PIMMS, using Chandra ACIS-I rate 3.45 10-3 c s-1, NH = 4.4 1021 cm-2 (AV = 2 mag), and 1 keV RS plasma model. See text.
10. LX is from PIMMS, using ROSAT PSPC rate 1.14 10-3 c s-1 (ZP94), NH = 2.7 1021 cm-2 (AV = 1.2 mag), and 1 keV RS plasma model.
11. SB2 with 13.6 d orbital period (Alencar et al. 2003).
12. LX is from PIMMS, using Chandra ACIS-I rate 2.02 10-4 c s-1, NH = (3.8 - 4.7) 1021 cm-2 (AV = 1.7 - 2.1 mag), and 1 keV RS plasma model. See text.
References
- (1) Alencar, S.H.P. et al. 2003, A&A, 409, 1037
- (2) Anders, E., & Grevesse, N. 1989, Geochim. Cosmochim. Acta, 53, 197 (AG89)
- (3) Appenzeller, I. 1994, in The Nature and Evolutionary Status of Herbig Ae/Be Stars, A.S.P. Conf. Series v. 62, ed. P.S. Thé, M.R. Pérez, and E.P.J. van den Heuvel (San Francisco: ASP), 12
- (4) Babel, J. & Montmerle, T. 1997, A&A, 323, 121
- (5) Barbera, M., Micela, G., Collura, A., Murray, S.S., & Zombeck, M.V. 2000, ApJ, 545, 449
- (6) Berghöfer, T.W., Schmitt, J.H.M.M., & Cassinelli, J.P. 1996, A&AS, 118, 481
- (7) Berghöfer, T.W., Schmitt, J.H.M.M., & Hünsch, M. 1999, A&A, 342, L17
- (8) Berrilli, F., Corciulo, G., Ingrosso, G., Lorenzetti, D., Nisini, B., & Strafella, F. 1992, ApJ, 398, 254
- (9) Böhm, T. & Catala, C. 1995, A&A, 301, 155
- (10) Brown, A., Tjin A Djie, H.R.E, Blondel, P.F.C., Harper, G.M., Bennett, P.D., & Skinner, S.L. 1997, in Accretion Phenomena and Related Outflows, IAU Colloq. 163, ASP Conf. Ser. v. 121, ed. D.T. Wickramasinghe, G.V. Bicknell, & L. Ferrario (San Francisco: ASP), 448
- (11) Danks, A. et al., 2001, BAAS (AAS Meeting 199), 33, Abstract 60.14
- (12) Damiani, F., Micela, G., Sciortino, S., & Harnden, F.R. 1994, ApJ, 436, 807
- (13) David, L.P. et al. 1999, The ROSAT High Resolution Imager (HRI) Calibration Report, http://hea-www.harvard.edu/rosat/
- (14) Dominik, C., Dullemond, C.P., Waters, L.B.F.M., & Walch, S. 2003, A&A, 398, 607
- (15) Eggen, O.J. 1995, AJ, 110, 1749
- (16) Elias, J.H. 1978, ApJ, 224, 857
- (17) Favata, F. & Micela, G. 2003, Sp. Sci. Rev., 108, 577
- (18) Feigelson, E.D., Gaffney, J.A., Garmire, G., Hillenbrand, L.A., & Townsley, L. 2003, ApJ, 584, 911
- (19) Feigelson, E.D., Lawson, W.A., & Garmire, G.P. 2003, ApJ, in press (FLG03)
- (20) Finkenzeller, U. 1985, A&A, 151, 340
- (21) Finkenzeller, U. & Mundt, R. 1984, A&AS, 55, 109 (FM84)
- (22) Garrison, L.M. 1978, ApJ, 224, 535
- (23) Garrison, L.M. & Anderson, C.M. 1977, ApJ, 218, 438
- (24) Giardino, G., Favata, F., Micela, G., & Reale, F. 2004, A&A, 413, 669
- (25) Ghez, A.M.,McCarthy, D.W., Patience, J.L., & Beck, T.L. 1997, ApJ, 481, 378
- (26) Gorenstein, P. 1975, ApJ, 198, 95
- (27) Grady, C.A. et al. 2000, ApJ, 544, 895
- (28) Grady, C.A. et al. 2004, ApJ, in press, ApJ preprint doi:10.1086/420763 (G04)
- (29) Herbig, G.H. 1960, ApJS, 4, 337
- (30) Herbig, G.H. 1994, in The Nature and Evolutionary Status of Herbig Ae/Be Stars, A.S.P. Conf. Series v. 62, ed. P.S. Thé, M.R. Pérez, and E.P.J. van den Heuvel (San Francisco: ASP), 3
- (31) Herbig, G.H. & Bell, K.R. 1988, Third Catalog of Emission-Line Stars of the Orion Population, Lick Observatory Bull. 1111, Univ. California, Santa Cruz (HB88)
- (32) Hillenbrand, L.A., Strom, S.E., Vrba, F.J., & Keene, J. 1992, ApJ, 397, 613
- (33) Hu, J.Y. et al. 1991, A&A, 248, 150
- (34) Jansen, F. et al., 2001, A&A, 365, L1
- (35) Knee, L.B.G. & Prusti, T. 1996, A&A, 312, 455
- (36) Knude, J. & Hg, E. 1998, A&A, 338, 897
- (37) Leinert, C., Richichi, A., & Haas, M. 1997, A&A, 318, 472
- (38) Malfait, K., Bogaert, E., & Waelkens, C. 1998, A&A, 331, 211
- (39) Meeus, G., Waters, L.B.F.M., Bouwman, J., van den Ancker, M.E., Waelkens, C., & Malfait, K. 2001, A&A, 365, 476
- (40) Morrison, R. & McCammon, D. 1983, ApJ, 270, 119
- (41) Palla, F. 1991, in Angular Momentum Evolution of Young Stars, ed. S. Catalano & J.R. Stauffer (Dordrecht: Kluwer), 21
- (42) Perryman, M.A.C. et al. 1997, A&A, 323, 49
- (43) Pirzkal, N., Spillar, E.J., & Dyck, H.M. 1997, ApJ, 481, 392
- (44) Porter, J.M. & Rivinius, T. 2003, PASP, 115, 1153
- (45) Preibisch, T. & Zinnecker, H. 1996, in Röntgenstrahlung from the Universe, ed. H. Zimmerman & J. Trümper (Garching: MPE), 17 (PZ96)
- (46) Preibisch, T. & Zinnecker, H. 2002, AJ, 123, 1613
- (47) Press, W.H., Teukolsky, S.A., Vetterling, W.T., & Flannery, B.P. 1992, Numerical Recipes in Fortran (New York: Cambridge U. Press), 617
- (48) Siess, L., Dufour, E., & Forestini, M. 2000, A&A, 358, 593
- (49) Schmitt, J.H.M.M. 1997, A&A, 318, 215
- (50) Skinner, S.L., Brown, A., & Stewart, R.T. 1993, ApJS, 87, 217
- (51) Skinner, S.L., Gagné, M., & Belzer, E. 2003, ApJ, 598, in press
- (52) Skinner, S.L. & Yamauchi, S. 1996, ApJ, 471, 987 (SY96)
- (53) Smith, M.A., Cohen, D.H., Gu, M.F., Robinson, R.D, Evans, N.R., & Schran, P.G. 2004, ApJ, 600, 972
- (54) Strom, S.E., Strom, K.M., Yost, J., Carrasco, L., & Grasdalen, G. 1972, ApJ, 173, 353
- (55) Takami, M., Bailey, J., & Chrysostomou, A. 2003, A&A, 397, 675
- (56) Thé, P.S., de Winter, D., & Pérez, M.R. 1994, A&AS, 104, 315
- (57) Thé, P.S., Felenbok, P., Cuypers, H., & Tjin A Djie, H.R.E. 1985, A&A, 149, 429
- (58) Tout, C.A. & Pringle, J.E. 1995, MNRAS, 272, 528 (TP95)
- (59) Turner, M.J.L. et al. 2001, A&A, 365, L27
- (60) van den Ancker, M.E., de Winter, D., & Tjin A Djie, H.R.E. 1998, A&A, 330, 145 (AWD98)
- (61) Vigneron, C., Mangeney, A., Catala, C., & Schatzman, E. 1990, Sol. Phys., 128, 287
- (62) Weinberger, A.J., Rich, R.M., Becklin, E.E., Zuckerman, B., & Matthews, K. 2000, ApJ, 544, 937
- (63) Weisskopf, M.C., Brinkman, B., Canizares, C., Garmire, G., Murray, S., & Van Speybroeck, L.P. 2002, PASP, 114, 1
- (64) Woodgate, B. et al., 2002, BAAS, 34(4), 1136
- (65) Zinnecker, H. & Preibisch, T., 1994, A&A, 292, 152 (ZP94)
Unsmoothed linearly-scaled XMM-Newton image of the region near HD 104237 obtained by combining photons from the MOS1 and MOS2 detectors in the 0.3 - 7 keV range. The pixel size is 1.1′′ and the coordinate overlay is J2000. Spectra and light curves of HD 104237 were extracted using photons inside the solid circle of radius 18′′ centered on the star, excluding those photons that fell inside the dashed circles surrounding the faint sources B,C,D, and E detected in higher-resolution Chandra images (Fig. 2). Chandra positions of the four faint sources are marked with crosses.
Unsmoothed aspect-corrected Chandra ACIS-I image of the region near HD 104237 obtained in a 2.86 ks observation on 4 Feb. 2002 with HD 104237 located 1.7′ off-axis. The pixel size is 0.49′′ and the energy range is 0.3 - 7 keV, with a J2000 coordinate overlay and linear scaling. The asterisk at center marks the Hipparcos position of HD 104237 (Table 1). The Hipparcos position is offset by 0.52′′ from the X-ray peak position, which is (J2000.) RA = 12h 00m 05.062s, decl. = 78∘ 11′ 34.06′′. The Hipparcos position is offset by 0.4′′ from the X-ray centroid position, which is RA = 12h 00m 05.089s, decl. = 78∘ 11′ 34.16′′. Crosses mark the positions of four fainter X-ray sources B,C,D, and E whose properties are summarized in Tables 3 and 5 of FLG03.
Wavelet-smoothed XMM-Newton EPIC-PN image of the region surrounding HD 104237. The intensity scale is logarithmic and the energy range is 0.3 - 7 keV, with a J2000 coordinate overlay. The circled sources correspond to objects detected in PN and MOS, as listed in Table 3.
Background-subtracted XMM-Newton X-ray light curve of HD 104237 using photons from the EPIC PN detector in the 0.5 - 5 keV energy range and a bin size of 200 s (filled squares). The light curve was extracted using the region shown in Figure 1, which excludes some photons in the vicinity of faint sources B,C,D, and E. The background light curve at bottom was extracted from a source-free region on the same CCD as HD 104237 and is binned at 600 s intervals. The mean count rate and standard deviation for the source light curve (top) is 0.25 0.04 c s-1 and the corresponding value for the background light curve (bottom) is 0.007 0.004 s-1. Error bars are 1.
Background-subtracted XMM-Newton X-ray spectrum of HD 104237 using photons from the EPIC PN detector and the extraction region shown in Figure 1. The spectrum has been rebinned to a minimum of 15 photons per energy bin. Solid line shows the best-fit 3T VAPEC optically thin plasma model (Table 4). The best-fit 2T VAPEC model (Table 4) is nearly identical to the 3T model shown, except that the 2T model slightly underestimates the flux in the 0.5 - 0.6 keV range by 20%.
Unsmoothed Chandra ACIS-I image of the Herbig Ae star HD 150193 in the 0.3 - 7 keV range with linear scaling and J2000 coordinates. The pixel size is 0.49′′. The cross marks the optical position of HD 150193, and circled sources A and C correspond to the bright X-ray peak and a fainter X-ray peak to its NE. The X-ray position of the faint peak C is RA = 16 40 17.94, Decl. = 23∘ 53′ 44.64′′. which is offset by 0.6′′ from the optical position, as compared to a 0.8′′ offset for the bright peak A. The faint peak C is identified with the Herbig star HD 150193.
Unsmoothed archived Chandra ACIS-I image of the Corona Australis cloud (ObsId = 19) in the 0.3 - 7 keV range. The usable exposure is 19.7 ks and coordinate overlay is J2000. The circled detection of R CrA has 68 8 counts and weak emission (4 2 counts) is seen at the position of T CrA.
X-ray and bolometric luminosities of Herbig Ae/Be stars (filled squares), whose numbers correspond to Table 5. Also shown are the Fe stars AK Sco and T Cra (open squares). The stellar luminosity of Elias 1 is uncertain (Berrilli et al. 1992; Hillenbrand et al. 1992). The large solid polygon to the left encloses the region occupied by T Tauri stars and the sloping dashed line shows the typical relation log (LX/Lbol) 3.75 for TTS. The solid polygon on the right shows the analogous region for massive OB stars and their canonical relation log (LX/Lbol) 7.0. The dotted polygon at right center encloses the region occupied by classical main-sequence BVe stars. The Herbig stars shown are (1) HR 5999, (2) HD 104237, (3) Elias 1 (= V 892 Tau), (4) HD 141569, (5) HD 163296, (6) AB Aur, (7) HD 100546, (8) HD 150193, (9) R CrA, (10) HD 97048.