On the correlation between the recent star formation rate in the Solar Neighbourhood and the glaciation period record on Earth
Abstract
Shaviv (2003) has shown evidence for a correlation between variations in the Galactic cosmic ray flux reaching Earth and the glaciation period record on Earth during the last 2 Gyr. If the flux of cosmic rays is mainly the result of Type II supernovae, an additional correlation between the star formation history of the Solar Neighbourhood and the timing of past ice ages is expected. Higher star formation rate implies increased cosmic ray flux and this may translate into colder climate through a rise in the average low altitude cloud cover. Here we reanalyze the correlation between this star formation history and the glaciation period record on Earth using a volume limited open cluster sample. Numerical modeling and recent observational data indicate that the correlation is rather strong but only if open clusters within 1.5 kpc from the Sun are considered.
keywords:
Galaxy: disk - Galaxy: evolution - Galaxy: open clusters and associations: general - solar neighbourhood - star formation1 Introduction
During the past 1 Gyr, the Earth’s climate has fluctuated between warm periods and cold periods or glaciations. The most recent period of glaciation was at its maximum about 10 kyr ago. Although the exact causes of the glacial cycles are not clear, a number of mechanisms able to trigger the cycles of the ice ages have been suggested, ranging from variations in the Solar Cycle (Rind, 2002; Marsh and Svensmark, 2003; Scherer and Fichtner, 2004) or in the orbit of the Earth (Williams et al., 1998) to natural oscillations of the ocean/continent/atmosphere system (Donnadieu et al., 2004).
Recently, Shaviv (2001, 2003a) and Svensmark (2004) have put forward evidence for a correlation between variations in the flux of cosmic rays reaching the Earth and the timing of past ice ages. Cosmic-ray particles, or cosmic rays for short, continuously collide with Earth, and they make up the only samples of matter from outside the Solar System. They are sub-atomic particles, nearly 90% are protons and the rest are nuclei of heavier atoms (8%) and electrons (1%). Cosmic rays are very energetic and virtually all of them travel very close to the speed of light. When a cosmic-ray particle hits Earth’s atmosphere, it creates a series of cascades of many lower-energy particles. These secondary, lower-energy particles in turn collide with objects on Earth’s surface virtually all the time. Cosmic rays are produced as a result of stellar activity, violent events at the Galactic Center and at great distances in the hearts of galaxies far beyond the Milky Way, neutron stars and black holes, but also during Type II supernovae explosions that are the final stage in the evolution of massive stars. The Sun is an active star and cosmic ray flux variability is a by-product of changes in the solar wind strength but solar wind particles have much lower energies than the Galactic cosmic rays. On the other hand, massive stars are short-lived ( 20 Myr) and are formed in great numbers during enhanced star formation episodes or starbursts. An increase in the Galactic cosmic ray flux is therefore expected within a few Myr of any starburst episode. The overall cosmic ray flux on Earth is affected not only by the neighbouring emission rate, that is clearly proportional to the star formation rate, but also by the magnetic field of the region where the Earth is located at a given time. This second effect correlates more with the periodic crossing of regions of compressed gas than with star formation itself and, in the absence of detailed modeling, might even dominate over the neighbouring emission rate. This possibility is however going to be neglected throughout the rest of the paper as compressed gas may also be connected with star formation and because the effect of magnetic fields on Galactic cosmic rays is weaker for higher energy particles (as the ones expected from supernovae). Ney (1959) was the first to point out that cosmic rays are the primary source for ionization in the Troposphere. Recent empirical evidence confirms a direct connection between average global low altitude cloud coverage and cosmic ray flux (Svensmark and Friis-Christensen, 1997; Svensmark 1998, 2000; Marsh and Svensmark, 2000; Palle Bago and Butler, 2000; Wagner et al., 2001; Shaviv, 2001; Carslaw et al., 2002; Stozhkov, 2003). An increase in the low altitude cloud coverage translates into a decrease in the average global temperature and therefore occurrence of ice age epochs. Christl et al. (2004) have found evidence for a link between the flux of Galactic cosmic rays and climate during the past 0.2 Myr. Svensmark (2004) has shown that variations in the flux of Galactic cosmic rays at Earth during the last 4.6 Gyr indicate a remarkable resemblance to changes in the climate during the same period of time suggesting again that Earth’s climate evolution is in some way linked to the evolution of the Galactic disk.
On the other hand, observations suggest that, throughout the Milky Way’s history, a non-negligible fraction of star formation has occurred in starburst-like events (see Freeman and Bland-Hawthorn, 2002, for a recent review). Shaviv (2003a) showed that apparent peaks in the star formation rate of the Solar Neighbourhood coincide with ice age epochs on Earth. To support his claims, Shaviv uses results on the star formation rate in the Milky Way disk obtained by Scalo (1987), Barry (1988), and Rocha-Pinto et al. (2000a, b). Although the majority of studies in this field use samples of stars in the Solar Neighbourhood with no stars more distant than about 100 pc being considered, it does not mean that the star formation history derived can only be applied to stars born in the Solar Neighbourhood. Nearby stars older than about 0.2 Gyr come from birth sites which span a large range in Galactocentric distances. Wielen (1977) showed that the orbital diffusion coefficient deduced from the observed increase of velocity dispersion with age implies that such stars have suffered an rms azimuthal drift of about 2 kpc for an age of 0.2 Gyr. Considerable, but smaller, drift should occur also in the radial direction. Wielen et al. (1996), on the basis of the Sun’s metallicity and the radial metallicity gradient in the Galactic disk, estimated that the Sun has migrated outward by 1.90.9 kpc in the past 4.5 Gyr. Shaviv also points out that peaks in the star formation rate have to be connected with peaks in the Galactic open cluster formation rate. Using data from the Lotkin et al. (1994) open cluster catalogue he finds a main peak 300 Myr ago and another, less statistically significant, 600 Myr ago. Mechanisms able to trigger enhanced star formation in the Milky Way disk suggested in his paper include gravitational tides induced during close encounters with the Magellanic Clouds and interactions with the Galactic spiral pattern. Shaviv (2003b) indicates that the actual picture could be even more complicated with variations in the solar wind strength, greenhouse effect and cosmic ray flux modulation by a variable star formation rate in the Milky Way disk working together to model the long-term glacial activity on Earth. On the other hand, paleoclimatology records indicate that the Earth’s glaciation history has shown a cyclic behavior during the last 1 Gyr with two additional major glaciations 2.2-2.4 Gyr ago (mid-Proterozoic ice age) and 2.9-3.0 Gyr ago (Archean ice age). Paleoclimatological data from Crowell (1999), Frakes et al. (1992) and Veizer et al. (2000) show 8 major ice age episodes during the last 1 Gyr. The timeline of the ice age epochs from geological records is shown in Fig. 2.
If, as paleoclimatological records suggest, the Earth’s glaciation history shows a cyclic behavior and this is connected with the local star formation rate, an oscillating star formation history is expected. Early determinations of the star formation history of the Solar Neighbourhood failed in finding a periodic star formation rate. However, Hernandez et al. (2000) using stellar color-magnitude diagrams found that the local star formation rate during the last 3 Gyr has an oscillatory component of period 500 Myr superimposed on a small level of constant star formation activity. This cyclic behavior is interpreted by these authors as the result of repeated encounters with the Galactic arm density pattern. Assuming that star clusters are the elementary units of star formation (Clarke et al., 2000; Kroupa and Boily, 2002; Lada and Lada, 2003), de la Fuente Marcos and de la Fuente Marcos (2004) have derived a star formation history of the Solar Circle (heliocentric distance 3.5 kpc) during the last 2 Gyr that is fully consistent with the one derived by Hernandez et al. (2000): cyclic star formation rate with a period of 0.4 0.1 Gyr. However, their results also suggest that for volume-limited open cluster samples (the Solar Neighbourhood, heliocentric distance 1 kpc) the recovered history can be slightly different. The Solar Neighbourhood is defined as a volume centered on the Sun that is much smaller than the overall size of the Milky Way galaxy and yet large enough to contain a statistically useful sample of stars (see, e.g., Binney and Tremaine, 1987). The appropriate size of the volume depends on which stars or objects are going to be investigated: for white dwarfs, which are both common and faint, it may consist of a sphere of radius 10 pc centred on the Sun, while for the bright but rare O and B stars, the Solar Neighbourhood may be considered to extend as far as 1 kpc from the Sun. Shaviv (2003a) suggests that a cyclic star formation during the last 3 Gyr is in contradiction with the glaciation records if the global scale climate changes on Earth are interpreted as a result of the increase in cosmic ray flux induced by enhanced star formation. In this paper, we reanalyze this conclusion using a volume-limited open cluster sample from the Open Cluster Database (Mermilliod, 2004) corrected from evolutionary effects (open cluster dissolution) as described in de la Fuente Marcos and de la Fuente Marcos (2004). Our objective is to show that if a complete, volume-limited open cluster sample is considered, the correlation, if real, has to be recovered.
This paper is organized as follows: in Section 2, we explain our choice of open cluster sample as well as present its properties. The raw histogram of open cluster number vs. age and the corrections are also included in this Section as well as the potential limitations of our approach. In Section 3, we compare the timing of the ice ages from geological records with the local star formation history inferred in Section 2. The statistical significance of the results is analyzed in Section 4. Open questions and conclusions are summarized in Section 5.
2 Our sample: from the age distribution to the star formation rate
If star clusters (open clusters and associations) are the elementary units of star formation in the Milky Way disk they can, in principle, be used to derive the star formation history, recent and old. Unfortunately, stellar associations evolve and dissolve in a time-scale of 50 Myr (Brown, 2002), therefore they cannot be used to study the star formation rate. On the other hand, open clusters are comparatively long lived objects that may serve as excellent tracers of the structure and evolution of the Galactic disk. Although the, now outdated, Lyngå catalogue (1987) has been the classical reference on open cluster data for many years, the Open Cluster Database (WEBDA) developed and maintained by J.-C. Mermilliod (1996, 2004) includes all the data already covered in Lyngå’s catalogue and many more. The latest update of the Open Cluster Database (WEBDA, February 2004) includes 1731 open clusters with ages for 616 objects (36%). In this database we have found 568 clusters with age 2 Gyr. We consider this age cutoff because paleoclimatological data indicate that cyclic glaciations started about 1 Gyr ago. Out of this sample, 127 objects are within 1 kpc from the Sun and have 100 pc (open cluster density, = 202 cluster/kpc3). Only 3 clusters in this subsample are older than 1 Gyr. Unfortunately, our initial choice for the volume produces an age distribution dominated by low number statistics. In order to increase the statistical significance of our results, we have relaxed slightly the inclusion criteria. We have considered a cylinder of radius 1.5 kpc and 150 pc with 256 open clusters and = 121 cluster/kpc3. In our final sample, only 7 clusters are older than 1 Gyr.
We have decided to consider a relatively small volume in order to minimize the effects of orbital diffusion. Special care has to be taken when working with object samples in the Galactic disk as the stars or open clusters in the sample considered, if old enough, may have formed far away from their current location. In a non-volume-limited sample, the star/open cluster sample birth sites are in fact distributed over a larger range of distances because of orbital diffusion. When trying to derive the global star formation history of the Galactic disk this process has very desirable consequences as the objects studied can provide an estimate of the global star formation rate and their conclusions can be extrapolated to the entire Milky Way disk. However, if we are studying an explicitly local process, samples can be polluted by objects that were not local at the time of their birth. In our case, we are trying to either confirm or reject a possible correlation between the local star formation rate and the relatively recent global changes in the Earth climate. If a star or an open cluster was not close enough to the Solar System at the time of a glaciation event it is very unlikely that it would have had any effect on the recorded ice age episode. It is therefore of the main importance to depopulate our sample of objects not born in the Solar Neighbourhood during the last 1 Gyr. It is basically impossible to achieve this goal with field star samples but for open cluster samples it should be not so difficult. Very little is known about orbital diffusion of entire star clusters but it is likely that the process is significantly slower than for stars and inversely proportional to the mass of the open cluster. Our strategy is to use objects with heliocentric distance 1.5 kpc and height scale 300 pc (or 150 pc) to minimize the effects of pollution from orbital diffusion. In addition to the sample presented, we have considered another five subsamples with more restrictive spatial inclusion criterion. Results from the various samples are fully consistent within the error limits.
On the other hand, and as for any other physical parameter, open cluster age determinations are affected by errors. In a large sample, these errors are very likely to be non-homogeneous as different methods have been used by different authors to calculate the ages. The disparity in open cluster ages (when considering different authors, see WEBDA for multiple examples) partly reflects the critical dependence of cluster isochrone fitting on the adopted reddening (often large for open clusters), even small reddening errors can create significant errors in the derived age and metallicity. However, determining effective temperatures and metallicities for cluster turn-off-stars directly through echelle spectroscopy is free from systematic errors and subject only to uncertainties in the model atmospheres. Some ages for clusters in the sample considered have been determined using the first technique, but others have been found using the second one or even other indirect methods. It is relatively difficult, specially in papers older than about 5 years, to find published estimations of the errors associated with open cluster age determinations. The analysis in de la Fuente Marcos and de la Fuente Marcos (2004) shows that the average age error is about 22% and that younger ages are affected by larger errors (although always 50%). If this error sample can be considered as representative of the error range for the entire sample, the youngest cluster (age 0.5 Gyr) errors are very likely in the range 50-150 Myr with older cluster errors in the range 150-250 Myr. The age errors affect considerably the duration of the star formation events, since they tend to scatter the ages of the star clusters originally born in a burst. We can expect that this error could smear out peaks and fill in gaps in the age distribution. Our conclusions are mainly sensitive to the errors in age determination but also to the degree of completeness of the open cluster sample. On the other hand, any errors in theoretical stellar models also propagate into the results obtained because the published open cluster ages always make reference to theoretical stellar models, sometimes through direct isochrone comparison, others through the use of morphological features found in the cluster color-magnitude diagram.
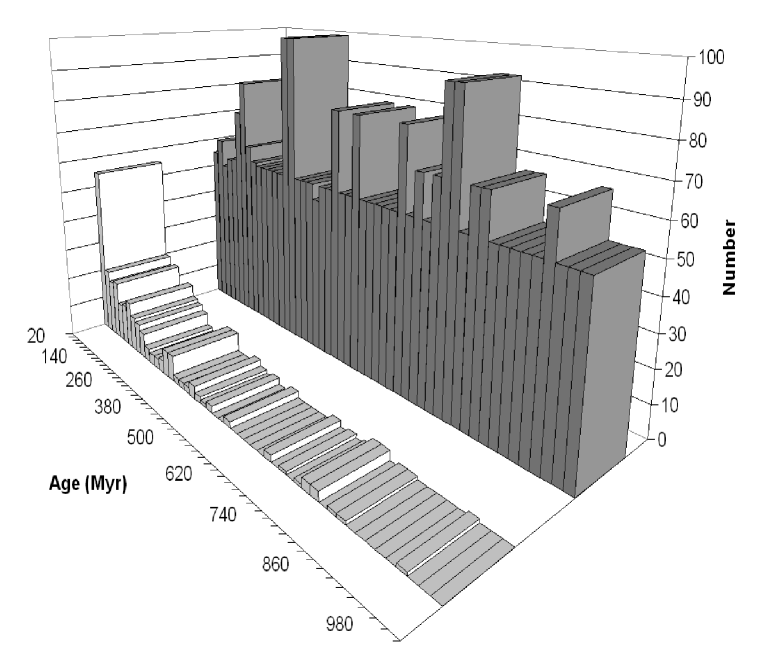
Fig. 1, white histogram, is nothing more than the actual age distribution of the open cluster sample considered in this paper, a raw histogram of open cluster numbers vs. age, of relatively young, nearby open clusters. In order to interpret this distribution additional tools are needed. Following de la Fuente Marcos and de la Fuente Marcos (2004), we use results from Experimental Stellar Dynamics to help us in this analysis by matching cluster dynamics and cluster data to provide a better view of the recent star formation history of the Solar Neighbourhood. As described in de la Fuente Marcos and de la Fuente Marcos (2004) our numerical models have been calculated with the standard -body code NBODY5 (Aarseth, 1985, 2003) for clusters located in the Solar Neighbourhood. These calculations include the effects of stellar evolution, the Galactic tidal field, primordial binaries, and realistic initial mass functions. These models indicate that an open cluster has to include about 200-400 stars (at least) in order to survive for about 0.5 Gyr, 400-700 to last 0.7 Gyr, 700-1000 to be detectable after 0.9 Gyr and 1000-2000 to survive for about 1.3 Gyr. In Fig. 1, we assume that the number of open clusters in each age bin is, by hypothesis, correlated with the number of open clusters initially born at that time. Once an age distribution is available, it is in principle easy to recover the star formation history that gave rise to the observed age distribution by using results from our realistic -body simulations. Our method does not assume any a priori galactic structure or condition on the star formation rate and it basically consists of three steps: (i) Construct a representative sample of open clusters; (ii) Construct the age distribution diagram for the sample; (iii) Infer the star formation history from the diagram. As the life span of larger clusters is longer, therefore, an usually high number of open clusters at a given time interval can be interpreted as the result of an event of enhanced star formation at that given age. If star cluster masses are sampled from an open cluster initial mass function (hereafter OCIMF), larger numbers translate into increased probability of formation of large and therefore long-lived star clusters.
The resulting star formation history (Fig. 1, grey histogram) comes directly from the age distribution (Fig. 1, white histogram), in an approach which assumes that the most frequent ages of the open clusters indicate the epochs when the star formation was more intense if we take into account that star clusters are the elementary units of the star formation process. We have assumed that the open cluster sample under study is only representative of the Solar Neighbourhood, therefore the evolution of the local star formation rate can be inferred from its age distribution, since the number of open clusters in each age bin has to be correlated with the number of objects initially at that time as a result of dissolution processes. As pointed out before, the correction due to the dynamical evolution of the cluster (cluster disintegration) is needed because our sample includes clusters with different initial populations (). The more massive clusters have a longer life expectancy than the short-lived, small- clusters, thus the latter would be missing in the older age bins. It is however possible to correct for this effect using the OCIMF as well as results on the open cluster lifetimes from numerical simulations. Fig. 2 shows the Solar Neighbourhood sample with the evolutionary correction described above (de la Fuente Marcos and de la Fuente Marcos, 2004). Our method is only able to provide a lower limit for the corrected number of objects per bin, therefore the actual number is likely higher and the peaks, sharper. The effect is more important for older ages.
3 Ice age epochs and local star formation rate
Paleoclimatological data indicate that in the time interval 1-2 Gyr no major ice age episodes have been recorded. Our star formation rate analysis suggests that during the same period, the local star formation rate was much lower than in the subsequent 1 Gyr: no open clusters appear in the time interval 1.2-1.9 Gyr. Within the error limits (about 20%), this is fully consistent with quiescent star formation (not enhanced) in the Solar Neighbourhood during the age range 1-2 Gyr ago. However, and even before the Precambrian (600 Myr ago), glaciation episodes have occurred at regularly spaced intervals of time ( 200 Myr) and lasting millions, or even tens of millions of years.
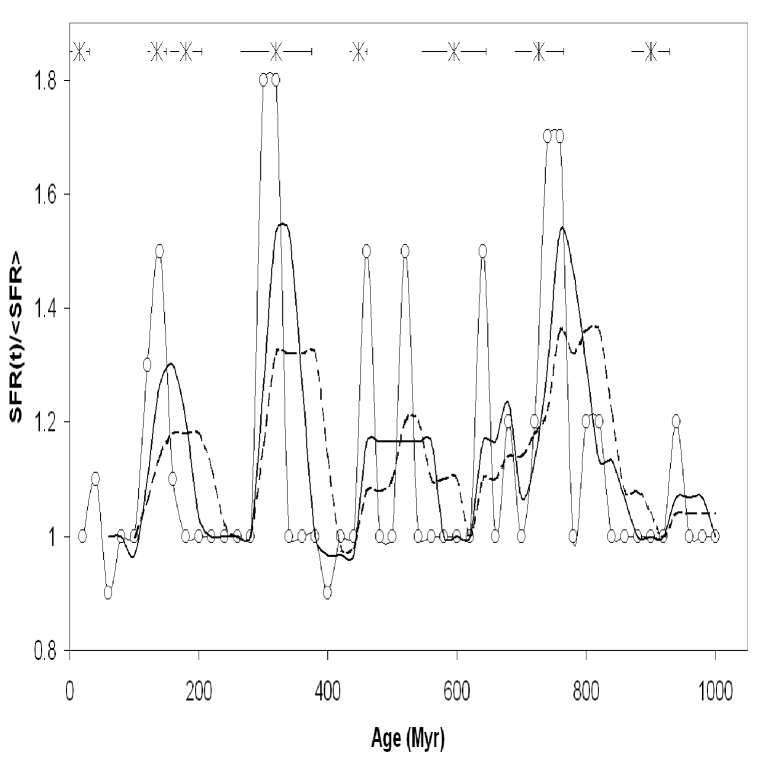
Fig. 2 suggests a strong correlation between enhanced star formation episodes in the Solar Neighbourhood and occurrence of ice ages on Earth. Besides, it appears that glaciations start some Myr after the (apparently) associated starburst began. Nevertheless, the magnitude of the error in the ages of the open clusters makes it difficult to confirm this apparent trend. On the other hand, Shaviv (2003a) indicates that the Neoproterozoic era (0.55-1 Gyr ago) was intrinsically cooler than the Phanerozoic (0-0.55 Gyr) era. If enhanced star formation is associated with glacial cycles, a higher average star formation rate is expected in the Neoproterozoic period. This is exactly what is observed in Fig. 2. The Marinoan and Varangian Glaciations (565, 615 Myr ago, respectively) and the Sturtian Glaciation (725 Myr ago) have been the coldest epochs in Earth’s climate history with large, continental-size glaciers covering enormous regions of the Earth. Comparatively, the mid-Mesozoic glaciation (160 Myr ago) was much less severe than the others. On the other hand, paleoclimatological records suggest that in the time interval 600-800 Myr the Earth continuously had some sort of ice age present. Geological evidence suggests that 750 Myr ago glaciations reached sea level and equatorial latitudes (Snowball Earth scenario, Hoffman et al. 1995; Hoffman and Schrag, 2002). If the strength of a given glaciation is a function of the strength of the (assumed) associated enhanced star formation episode, then Fig. 2 is fully consistent with this scenario. On the other hand, Evans (2003) has found that Neoproterozoic glaciogenic sediments were deposited mainly at low paleolatitudes, in contrast to their Pleistocene counterparts. High depositional latitudes dominate all Phanerozoic ice ages, exclusively low paleolatitudes characterize both of the major Precambrian glacial epochs. Transition between these two glaciation modes occurred within a 100 Myr interval, intrinsically coeval with the Neoproterozoic-Cambrian explosion of metazoan diversity. This study shows that glaciation episodes are much more common from about 750 Myr ago than in the preceding sedimentary record. This evidence has been interpreted as a fundamental Precambrian-Phanerozoic shift in Earth’s glacial style.
4 Statistical significance of the results
Given the two sets of data, namely the epochs of recent enhanced star formation of the Solar Neighbourhood and the glaciation period record, Fig. 2 is not enough to confirm or reject the hypothesis of a causal correlation between the two phenomena. In this section we will provide a much more detailed statistical comparison of the two data sets.
4.1 Data Smoothing: Savitzky-Golay filters
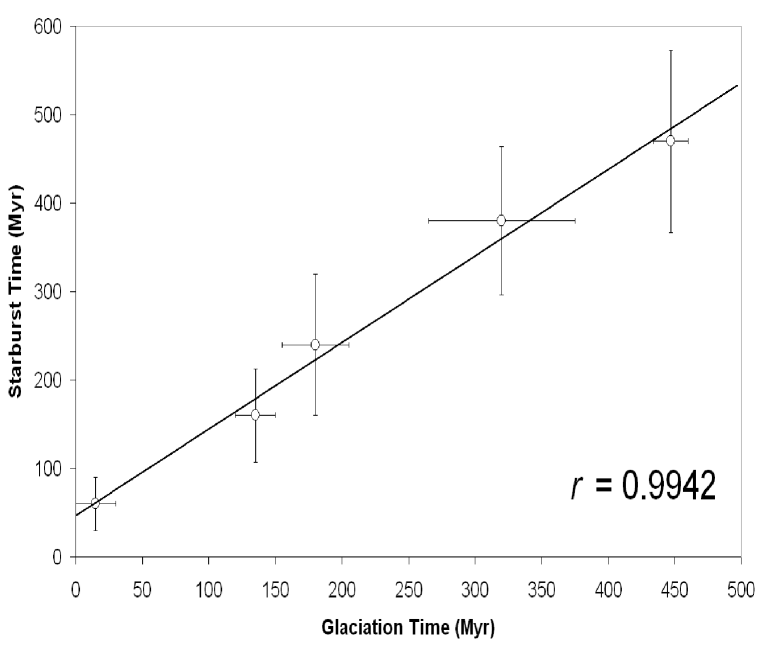
Data smoothing assumes that the variable under study is both slowly varying and also corrupted by random noise. In our case, the star formation rate is, in fact, changing relatively slowly with time and the number of open clusters per age interval or bin is affected by age determination errors and therefore corrupted. It is, however, difficult to assume that age errors are a type of random noise because important systematic errors may have been included during the age determination process (de la Fuente Marcos and de la Fuente Marcos, 2004). In the previous sections we have used the moving window averaging method to smooth the recovered star formation history. If the underlying function is constant, or is changing linearly with time (increasing or decreasing), then no bias is introduced into the resulting smoothed curve. Higher points at one end of the averaging interval are on the average balanced by lower points at the other end. A bias is introduced, however, if the distribution function has a nonzero second derivative: the height of local maxima are always reduced and their width increased by moving window averaging. Narrow features are broadened and suffer corresponding loss of amplitude. Savitzky-Golay filters (Savitzky and Golay, 1964), however, provide smoothing without loss of resolution. They approximate the underlying function by a polynomial (quadratic or quartic, typically) as described by, e.g., Press et al. (1992). Fig. 3 shows the recovered star formation history smoothed by a Savitzky-Golay filter (of degree 2) using 9 points. The filter recovers a missing feature in the input distribution, the 200-300 peak. Five peaks of enhanced star formation are recovered in the age range 0-550 Myr for the sample studied: 6030 Myr, 16053 Myr, 24080 Myr, 38084 Myr, and 470103 Myr. Here the errors have been estimated from the star cluster age errors. The glaciation epochs in this age range are: 1515 Myr, 13515 Myr, 18025 Myr, 32055 Myr, and 44713 Myr. Both the paleoclimatological records of the glaciation episodes and the timing of the enhanced star formation epochs appear to be fairly consistent. This can be interpreted as an indication of the existence of a connection between the recent star formation record of the Solar Neighbourhood and the glaciation period record. It may be argued that Fig. 4, although suggestive of a trend, might not reflect the full nature of the correlation problem studied due to overly optimistic errors for the cluster age determination having being used. This is, however, not the case as the errors found for the maxima are 50%, 33%, 33%, 22% and 22%, respectively. According to the age errors quoted in the literature (that can be mainly found in papers published during the last five years) the upper limit is about 50% for young clusters ( 100 Myr), 30% for intermediate age clusters (100-300 Myr), and 20% for older clusters. When considering these errors some of the starburst episodes overlap. The optimistic range would be about 10%-20% with the largest value for the youngest objects. On the other hand, the linear correlation coefficient, or Pearson’s , is about 0.99 when we represent the maxima from the Savitzky-Golay smoothing procedure as a function of the time-coincident glaciation events, Fig. 4. Our analysis indicates the presence of a strong correlation between enhanced star formation episodes and glaciation events during the last 550 Myr.

4.2 Adaptative Smoothing: variable time kernel
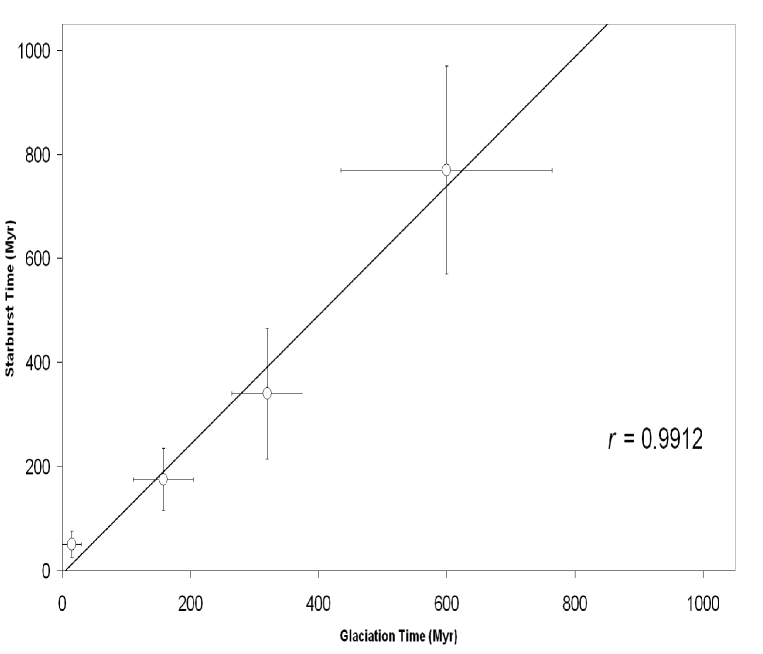
In Figs. 2 and 3, both the moving average and the Savitzky-Golay filter applied to the results do not directly reflect the errors in cluster ages. These errors could be as high as 50% for young clusters (age 100 Myr), around 30% for open clusters in the age range 100-600, and 20% for the age range 600-1000. The errors have been, however, included in the determination of the peaks of enhanced star formation activity. In this section, a variable time kernel for the smoothing following the actual errors has been applied to the recovered data. Fig. 5 shows the result of our adaptative smoothing as well as the glaciation epochs. The obtained star formation history can be considered as the worst case scenario with the most pessimistic evaluation for the errors being considered and included in the smoothing process. Fig. 5 indicates that the uncertainties in open cluster age determination for ages older than about 500 Myr are clearly too large at present, in principle, to draw any conclusion regarding either the presence or the absence of a correlation with the glaciation events. At this stage it is not possible to resolve this problem, but by degrading the resolution of the paleoclimatological data we should be able to obtain not a proof but at least an indication of the presence of a correlation.

We have done this to obtain Fig. 6. The peaks have then been linearly correlated to the glaciation record for the four remaining maxima in the star formation history. Fig. 6 shows the obtained correlation that is fairly good within the error limits. Although, due to the errors in cluster ages, only four events can be correlated, the result suggests a strong causal connection between the recent star formation history of the Solar Neighbourhood and the glaciation period record. The choice of the glaciation events included in Fig. 6 has been fully constrained by the errors considered in cluster age determinations.
4.3 Model optimization: Saha’s merit function
When attempting to answer the question of whether or not two data sets are drawn from the same distribution function, the chi-square test is the natural choice for binned distributions. However, if the number of points per bin for one of the distributions is small, the implicit assumption in the chi-square test (the data object points follow a Gaussian distribution) is no longer valid. This is exactly what we have in our open cluster age histogram with most of the bins in the age range 500-1000 Myr containing 0, 1, 2 or 3 clusters. Saha (1998) developed a test to study this special case. Saha’s test is based on the merit function:
| (1) |
where the th bin has model points and data object points. The above expression can be used even when shot noise is not negligible. The idea behind the test is the following, for a given data object set and binning, we can change the parameters of the model to generate a model points distribution to maximize . In our case, the data object set is the open cluster sample and the model to be adjusted is the glaciation period record. If the model glaciation period record that maximizes resembles the paleoclimatological record, then the correlation can be considered positive. In the following, we have used the test for the age interval 300-1000 Myr. Unfortunately, this is the time range where errors are in the range 100-220 Myr. We have constructed three merit functions for a bin size of 50, 100 and 200 Myr, respectively. The number of clusters observed in a particular bin follows the distribution in Fig. 1, white histogram. The model following the glaciation period record has been constructed as follows: i) we assume that enhanced star formation episodes are characterized by the formation of clusters per unit time, ii) these clusters have life times longer than the time interval studied (in this work, 1 Gyr), iii) the number of clusters to be observed in a given bin is proportional to the fraction of glaciation episode included in that bin as well as to the duration of the episode, as in Fig. 2. The total number of model clusters generated under these assumptions is about 20% larger than the actual number of observed clusters to simulate incompleteness of the observed sample. For the first merit function (bin size, 50 Myr), we have performed 1,000,000 Monte Carlo simulations of random glaciation records against the open cluster age record. The random glaciation records include the same number of events that the one matching the observed glaciation record. Only 4% of the simulated sets produce a better model-data value of the merit function conserving the number of glaciation episodes in the studied age range. The glaciation intervals that maximize the merit function are: 300-425, 500-550, 600-650, 700-775, and 800-900 in Myr. The actual glaciation record in the age range considered is: 300-375, 434-460, 545-645, 689-765, and 870-930 in Myr. A similar result is obtained for the larger bin sizes.
5 Discussion and conclusions
In this paper we have attempted to confirm or reject the existence of a correlation between the local star formation history as derived from the open cluster formation rate in the Solar Neighbourhood and the timing of glaciation episodes on Earth. Peaks in the age distribution diagram of the cluster sample were interpreted as signatures of starbursts. Our results indicate that the analyzed star formation rate presents two components: periodic episodes of enhanced star formation superimposed on a quiescent star formation level. Although it could have been induced by tidal interactions with the Magellanic Clouds (Shaviv, 2003a; de la Fuente Marcos and de la Fuente Marcos, 2004), there is, however, a cyclic behavior in the burst sequence that may be better explained by the density wave hypothesis (Lin and Shu, 1964) for the presence of spiral arms in late-type galaxies. A model like the one outlined in Hernandez et al. (2000a) and developed in Martos et al. (2004) can explain easily the 0.4 Gyr periodicity found by de la Fuente Marcos and de la Fuente Marcos (2004) for the Galactic disk. For a pattern speed = 20 km s-1 kpc-1 (e.g. Martos et al., 2004) and a Galactocentric distance = 8.5 kpc it implies an orbital period of about 1 Gyr for the Sun. If the enhanced star formation episodes are, in fact, due to the interactions with the spiral arms it means that our Galaxy has two arms. This has been recently suggested by Martos et al. (2004) using a completely different approach. However, the periodicity observed for the local star formation rate is 150 and it could be interpreted as evidence in favour of the presence of a four-armed spiral pattern in the Galactic disk. Unfortunately, this conclusion is strongly affected by the significant value of the associated errors that make it also compatible with a two-armed spiral pattern. The different periodicity observed for the Solar Neighbourhood can also be interpreted as higher harmonics due to local substructures.
For our complete, volume-limited open cluster sample in the Solar Neighbourhood only 7 objects are found in the age range 1-2 Gyr, with no objects in the age range 1.2-1.9 Gyr. However, for an open cluster sample in the Solar Circle (heliocentric distance 3.5 kpc) the recovered star formation rate is rather different, with several peaks of star formation. This apparently unexpected result brings to our attention the fact that in order to trigger enhanced star formation two ingredients are required: a mechanism able to trigger the process and a certain number of giant molecular clouds available to host the process. The distribution of giant molecular clouds in the Milky Way disk is not uniform and therefore this may translate into non-uniform star formation when considering relatively small regions ( 1.5 kpc) and young ( 2 Gyr) ages. The discrete behavior should disappear when both longer time scales and larger volumes are considered. On the other hand, the star formation histories recovered from the two descriptions do not need to be consistent as the effects of both spiral pattern and galactic interactions (two plausible mechanisms able to trigger enhanced star formation) are not uniform through the entire disk. In this work we have only used a fairly small part of the disk trying to minimize the effects of orbital diffusion. It implies a restriction of the studied region not only in volume but also in time to avoid pollution by objects formed far away from the studied volume. This can be considered a Lagrangian approach to the star formation history of the Milky Way disk.
It is important to point out that the timing coincidences and the overall good correlation found between the recent star formation rate in the Solar Neighbourhood and the glaciation period record on Earth are totally independent of the assumed model for the spiral structure (two, four-armed) and the spiral pattern speed. Our analysis not only suggests a strong correlation in the timing of the events (enhanced star formation and glaciation episodes), but also in the severity and length of the episodes. On the other hand, the correlation between the meteoritic data (exposure ages of Fe/Ni meteors) given in Fig. 10, panel F (Shaviv, 2003a) and the normalized local star formation rate shown in Fig. 2 is fairly good, with the lowest levels in meteor exposure indicating lower cosmic ray flux.
Although the exact causes for glaciation episodes, and the ice ages cycles within them, are still far from being well established, the astrophysical data discussed in this paper strongly suggest that galactic dynamics plays a primary role in the long-term evolution of global climate on Earth. The overall evolution is however likely the result of a complicated dynamic interaction between the Solar Cycle, periodic changes in the orbit of the Earth, natural oscillations of the ocean/continent/atmosphere system, variations in the composition of the atmosphere, and Galactic dynamics. Even though our conclusions are uncertain as they are based on a relatively small subsample of a larger but still incomplete sample composed of almost 2000 open clusters, they are similar to the ones previously found by other independent studies.
References
- [1] Aarseth, S.J., 1985. In: Brackbill, J.U., Cohen, B.I. (Eds.), Multiple Time Scales. Academic Press, New York, p. 377.
- [2] Aarseth, S.J., 2003. Gravitational -Body Simulation: Tools and Algorithms. Cambridge University Press, Cambridge.
- [3] Binney, J., Tremaine, S., 1987. Galactic Dynamics. Princeton University Press, Princeton.
- [4] Brown, A.G.A., 2002. In: Grebel, E.K., Brandner, W. (Eds.), Modes of Star Formation and the Origin of Field Populations. ASP Conference Series, p. 150.
- [5] Carslaw, K.S., Harrison, R.G., Kirkby, J., 2002. Science 298, 1732
- [6] Christl, M., Mangini, A., Holzkämper, S., Spötl, C., 2004. Journal of Atmospheric and Solar-Terrestrial Physics 66, 313.
- [7] Clarke, C.J., Bonnell, I.A., Hillenbrand, L.A., 2000. In: Mannings, V., Boss, A.P., Russell, S.S. (Eds.), Protostars and Planets IV. University of Arizona Press, p. 151.
- [8] Crowell, J.C., 1999. Memoir of the Geological Society of America, vol. 192.
- [9] Donnadieu, Y., Goddéris, Y., Ramstein, G., Nédélec, A., Meert, J., 2004. Nature 428, 303.
- [10] Evans, D.A.D., 2003. Tectonophysics 375, 353.
- [11] Frakes, L.A., Francis, E., Syktus, J.I., 1992. Climate modes of the Phanerozoic; the history of the Earth’s climate over the past 600 million years. Cambridge University Press, Cambridge.
- [12] Freeman, K., Bland-Hawthorn, J., 2002. ARA&A 40, 487.
- [13] de la Fuente Marcos, R., de la Fuente Marcos, C., 2004. New Astron. 9, 475.
- [14] Hernandez, X., Valls-Gabaud, D., Gilmore, G., 2000. MNRAS 316, 605.
- [15] Hoffman, P.F., Schrag, D.P., 2002. Terra Nova 14, 129.
- [16] Hoffman, P.F., Kaufman, A.J., Halverson, G.P., Schrag, D.P., 1995. Science 281, 1342.
- [17] Kroupa, P., Boily, C.M., 2002. MNRAS 336, 1188.
- [18] Lada, C.J., Lada, E.A., 2003. ARA&A 41, 57.
- [19] Lin, C.C., Shu, F.H., 1964. ApJ 140, 646.
- [20] Loktin, A.V., Matkin, N.V., Gerasimenko, T.P., 1994. Astron. Astrophys. Trans. 4, 153.
- [21] Lyngå, G., 1987. Catalogue of Open Cluster Data, 5th ed. (Cent. Données Stellaire, Strasbourg). (available at http://cdsweb.u-strasbg.fr)
- [22] Marsh, N., Svensmark, H., 2000. Phys. Rev. Lett. 85, 5004.
- [23] Marsh, N., Svensmark, H., 2003. Space Sci. Rev. 107, 317.
- [24] Martos, M., Hernández, X., Yáñez, M., Moreno, E., Pichardo, B., 2004. MNRAS 350, L47.
- [25] Mermilliod, J.-C., 1996. In: Milone, E.F., Mermilliod, J.-C. (Eds.), The Origins, Evolutions, and Destinies of Binary Stars in Clusters. ASP Conference Series, p. 475.
- [26] Mermilliod, J.-C., 2004, Open Cluster Database, http://www.unige.ch/webda.
- [27] Ney, E.P., 1959. Nature 183, 451.
- [28] Palle Bago, E., Butler, C.J., 2000. Astronomy and Grophysics 41, 18.
- [29] Press, W.H., Teukolsky, S.A., Vetterling, W.T., Flannery, B.P., 1992. Numerical Recipes in FORTRAN. Cambridge University Press, Cambridge.
- [30] Rind, D., 2002. Science 296, 673.
- [31] Rocha-Pinto, H.J., Scalo, J., Maciel, W.J., Flynn, C., 2000a. ApJ 531, L115.
- [32] Rocha-Pinto, H.J., Scalo, J., Maciel, W.J., Flynn, C., 2000b. A&A 358, 869.
- [33] Saha, P., 1998. AJ 115, 1206.
- [34] Savitzky, A., Golay, M.J.E., 1964. Analytical Chemistry 36, 1627.
- [35] Scalo, J.M., 1987. In: Thuan, T.X., Montmerle, T., Tran Thanh Van (Eds.), Starbursts and Galaxy Evolution. Editions Frontières, Gif sur Yvette, p. 445.
- [36] Scherer, K., Fichtner, H., 2004. A&A 413, L11.
- [37] Shaviv, N.J., 2001. Phys. Rev. Lett. 89, 051102
- [38] Shaviv, N.J., 2003a. New Astron. 8, 39.
- [39] Shaviv, N.J., 2003b. Journal of Geophysical Research 108, 3.
- [40] Svensmark, H., Friis-Christensen, E., 1997. Journal of Atmospheric and Solar-Terrestrial Physics 59, 1225.
- [41] Svensmark, H., 1998. Phys. Rev. Lett. 81, 5027.
- [42] Svensmark, H., 2000. Space Sci. Rev. 93, 155.
- [43] Svensmark, H., 2004. Phys. Rev. Lett. (submitted).
- [44] Stozhkov, Y.I., 2003. J. Phys. G: Nucl. Part. Phys. 29, 913.
- [45] Veizer, J., Godderis, Y., Francois, L.M., 2000. Nature 408, 698.
- [46] Wagner, G., Livingstone, D.M., Masarik, J., Muscheler, R., Beer, J., 2001. Journal of Geophysical Research 106, 3381.
- [47] Wielen, R., 1977. A&A 60, 263.
- [48] Wielen, R., Fuchs, B., Dettbarn, C., 1996. A&A 314, 438.
- [49] Williams, D.M., et al., 1998. Nature 396, 453.