SN 2003lw and GRB 031203: A Bright Supernova for a Faint Gamma-ray Burst
Abstract
Optical and near-infrared observations of the gamma-ray burst GRB 031203, at , are reported. A very faint afterglow is detected superimposed to the host galaxy in our first infrared observations, carried out hours after the burst. Subsequently, a rebrightening is detected in all bands, peaking in the band about 18 rest-frame days after the burst. The rebrightening closely resembles the light curve of a supernova like SN 1998bw, assuming that the GRB and the SN went off almost simultaneously, but with a somewhat slower evolution. Spectra taken close to the maximum of the rebrightening show extremely broad features as in SN 1998bw. The determination of the absolute magnitude of this SN (SN 2003lw) is difficult owing to the large and uncertain extinction, but likely this event was brighter than SN 1998bw by mag in the bands, reaching an absolute magnitude .
Subject headings:
gamma rays: bursts — supernovae: individual (SN 2003lw)1. Introduction
In recent years, extensive optical and near-infrared (NIR) follow-up of gamma-ray bursts (GRBs) has revealed a physical connection between a significant fraction of long-duration GRBs and core-collapse supernovæ (SNe). First, the bright SN 1998bw was discovered spatially and temporally coincident with GRB 980425 (Galama et al., 1998; Kulkarni et al., 1998). However, GRB 980425 was rather different from classical, cosmological GRBs, being severely underenergetic and lacking an optical afterglow. Then, SN 2003dh was detected in the afterglow of GRB 030329 (Stanek et al., 2003; Hjorth et al., 2003). Both SNe showed broad bumps in their spectra, indicating very large expansion velocities (up to km/s), and were extremely bright. These highly-energetic SNe are often named hypernovæ (e.g. Iwamoto et al., 1998). Last, bumps discovered in the light curves of several afterglows, peaking days after the GRB, have been interpreted as due to the emerging of SNe out of the afterglow light, based on their brightness, temporal evolution and colors (e.g. Bloom et al., 1999; Garnavich et al., 2003). The bumps resemble the light curve of SN 1998bw, with a certain scatter in the brightness and rise time (e.g. Zeh, Klose & Hartmann, 2004). Spectroscopic confirmation that the bump of GRB 021211 has a SN spectrum (SN 2002lt; Della Valle et al., 2003) supports this conclusion. These observations indicate that the GRB/SN association is common.
GRB 031203 was discovered by the INTEGRAL satellite on 2003 Dec 3.91769 UT (Götz et al., 2003), with a duration of s and a peak flux of erg cm-2 s-1 ( keV; Mereghetti & Götz, 2003a). The precise and fast dissemination of the GRB coordinates by the INTEGRAL burst alert system (Mereghetti et al., 2003b) allowed an effective search for the afterglow. We also immediately activated our ToO program at ESO, starting NIR observations at the NTT 7 hours after the GRB (Zerbi et al., 2003). The X-ray and radio afterglows were soon discovered (Santos-Lleo & Calderon, 2003; Frail, 2003). A compact galaxy, located at a consistent position, was proposed to be the GRB host galaxy by Prochaska et al. (2003). The redshift was (Prochaska et al., 2003, 2004), making GRB 031203 the second closest burst after GRB 980425 at (Galama et al., 1998). Vaughan et al. (2004) discovered a scattered expanding X-ray halo due to the reflection of the burst and/or early afterglow light from Galactic dust grains. This allowed an (indirect) measurement of the X-ray flux at the earliest stages after the burst onset.
Given the low redshift of this event, the isotropic-equivalent burst energy is extremely low111We adopt a cosmology with km s-1 Mpc-1, , (WMAP results). At the luminosity distance is Mpc and the distance modulus is mag., erg (20-2000 keV; Watson et al., 2004; Prochaska et al., 2004), well below the standard reservoir erg of normal GRBs (Frail et al., 2001; Bloom, Frail & Kulkarni, 2003). Only GRB 980425 (Galama et al., 1998) and XRF 020903 (Sakamoto et al., 2004) were less energetic.
Based on photometric monitoring of the host galaxy, several groups have reported evidence for a SN associated with GRB 031203 (Bersier et al., 2004; Thomsen et al., 2004; Cobb et al., 2004; Gal-Yam et al., 2004). After the ultimate confirmation, coming from spectroscopic observations and reported by our group (Tagliaferri et al., 2004), the IAU named this event SN 2003lw.
2. Observations and data reduction
Photometry. We observed the field of GRB 031203 starting h after the trigger, to search for the near-infrared (NIR) afterglow, using SofI on the ESO-NTT at La Silla (Chile). Subsequent imaging with ISAAC on the ESO-VLT showed the presence of a varying source coincident with the putative host galaxy of GRB 031203: the total flux had dimmed in the , and filters by a few tenths of a magnitude (see Fig. 1). We therefore started a campaign to monitor the optical/NIR light curve of the event, searching for a SN rebrightening. The observing log is presented in Tab. 1.
Image reduction and analysis were performed following the standard procedures, by means of both aperture photometry and PSF-matched image subtraction. To avoid saturation from a nearby bright star, the exposure time was always kept short. In same cases, occulting bars were placed to cover the bright star (showing that the effect was negligible). Optical and NIR photometry were calibrated against Landolt standard stars and the 2MASS, respectively. To focus on the issue of variability, in Tab. 1 we list just the relative photometry with respect to a reference epoch. We should also note that the host galaxy spectrum is dominated by prominent emission lines. This may lead to relatively large offsets when comparing results from other instruments, owing to unavoidable small differences in the filter profiles and CCD efficiencies.
Additional and photometry was acquired with the 2 m MAGNUM telescope of the University of Tokyo (Yoshii et al., 2003), located in the Hawaii Islands. Although the different shape of the MAGNUM and ESO filters (particularly critical due to the presence of the bright H line in the blue filter wing) makes it difficult to compare the results, the data are in good agreement (Tab. 1). For consistency, these data are not plotted in Fig. 1.
| UT startaaIn the form yymmdd, for year, month, day. | Seeing | Instrument | Band | MagnitudebbMagnitudes are given relative to the boldface epoch. |
|---|---|---|---|---|
| 031220.247 | 0.3 | FORS2 | -0.0230.020 | |
| 031230.250 | 0.5 | FORS1 | 20.370.05 | |
| 040228.193 | 0.7 | FORS1 | 0.1650.012 | |
| 040302.064 | 0.7 | FORS1 | 0.1690.015 | |
| 031215.314 | 0.6 | FORS1 | 20.140.03 | |
| 031217.284 | 0.7 | FORS1 | -0.0090.016 | |
| 031223.295 | 0.5 | FORS1 | -0.0600.016 | |
| 031228.296 | 0.6 | FORS1 | -0.0510.010 | |
| 031230.241 | 0.5 | FORS1 | -0.0440.013 | |
| 040116.171 | 0.8 | FORS1 | 0.1300.013 | |
| 040117.185 | 0.5 | FORS1 | 0.1390.014 | |
| 040221.101 | 0.7 | FORS1 | 0.2480.019 | |
| 040228.198 | 0.7 | FORS1 | 0.2420.012 | |
| 040302.069 | 0.6 | FORS1 | 0.2550.016 | |
| 031215.321 | 0.5 | FORS1 | 19.180.03 | |
| 031217.291 | 0.6 | FORS1 | -0.0140.015 | |
| 031223.300 | 0.4 | FORS1 | -0.0520.013 | |
| 031228.301 | 0.6 | FORS1 | -0.0440.015 | |
| 031230.245 | 0.4 | FORS1 | -0.0520.009 | |
| 040116.177 | 0.6 | FORS1 | 0.0500.008 | |
| 040117.179 | 0.6 | FORS1 | 0.0540.007 | |
| 040221.107 | 0.5 | FORS1 | 0.1510.013 | |
| 040228.203 | 0.8 | FORS1 | 0.1500.013 | |
| 031204.288 | 0.9 | SofI | 18.130.034 | |
| 031205.258 | 0.5 | ISAAC | 0.1430.030 | |
| 031214.140 | 1.1 | SofI | 0.0140.032 | |
| 031223.191 | 1.0 | SofI | -0.0840.069 | |
| 040228.111 | 0.5 | ISAAC | 0.1100.045 | |
| 031204.300 | 0.9 | SofI | 17.360.042 | |
| 031205.271 | 0.5 | ISAAC | 0.2570.035 | |
| 031214.148 | 0.9 | SofI | -0.0060.033 | |
| 040228.104 | 0.5 | ISAAC | 0.1900.019 | |
| 031204.204 | 0.9 | SofI | 16.380.036 | |
| 031204.312 | 0.8 | SofI | -0.0360.033 | |
| 031205.267 | 0.5 | ISAAC | 0.1610.025 | |
| 031214.154 | 0.8 | SofI | 0.0460.044 | |
| 031223.188 | 1.0 | SofI | 0.0820.107 | |
| 040228.095 | 0.5 | ISAAC | 0.2550.055 | |
| 031224.507 | 1.5 | MAGNUM | 19.160.03 | |
| 040106.447 | 1.4 | MAGNUM | 19.160.03 | |
| 031224.503 | 1.1 | MAGNUM | 16.610.04 | |
| 040106.445 | 1.1 | MAGNUM | 16.580.04 |
Spectroscopy. Moderate-resolution spectra (FWHM Å) were taken with the VLT on 2003 Dec. 20 (FORS 2), 2003 Dec. 30 (FORS 1), and 2004 Mar. 01 (FORS 1). Flux calibration was achieved by observing spectrophotometric stars. After comparing synthetic magnitudes calculated from our spectra with the photometry we introduced a correction to account for light loss outside the slit. To ensure a sound relative calibration between the spectra, we also checked that the fluxes of the host galaxy emission lines did not vary. A detailed discussion of the spectroscopy and of the host galaxy will be presented elsewhere (Chincarini et al. 2004, in preparation; hereafter C04).
3. Results and discussion
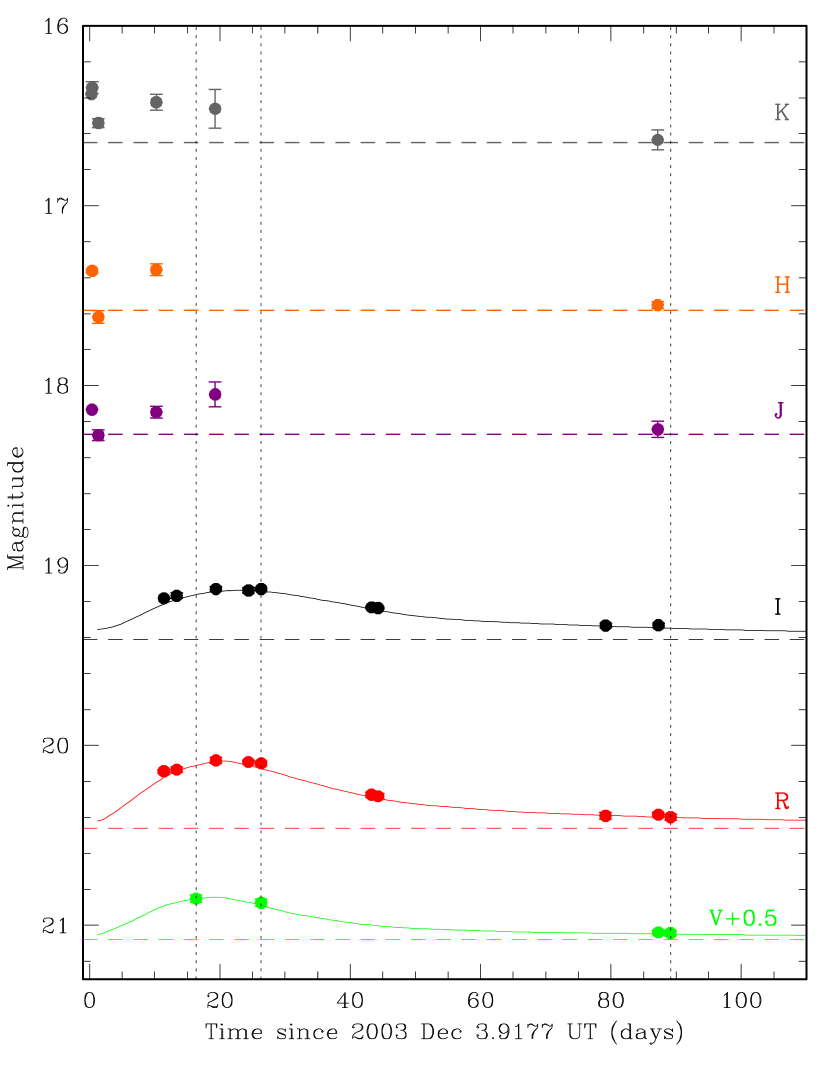
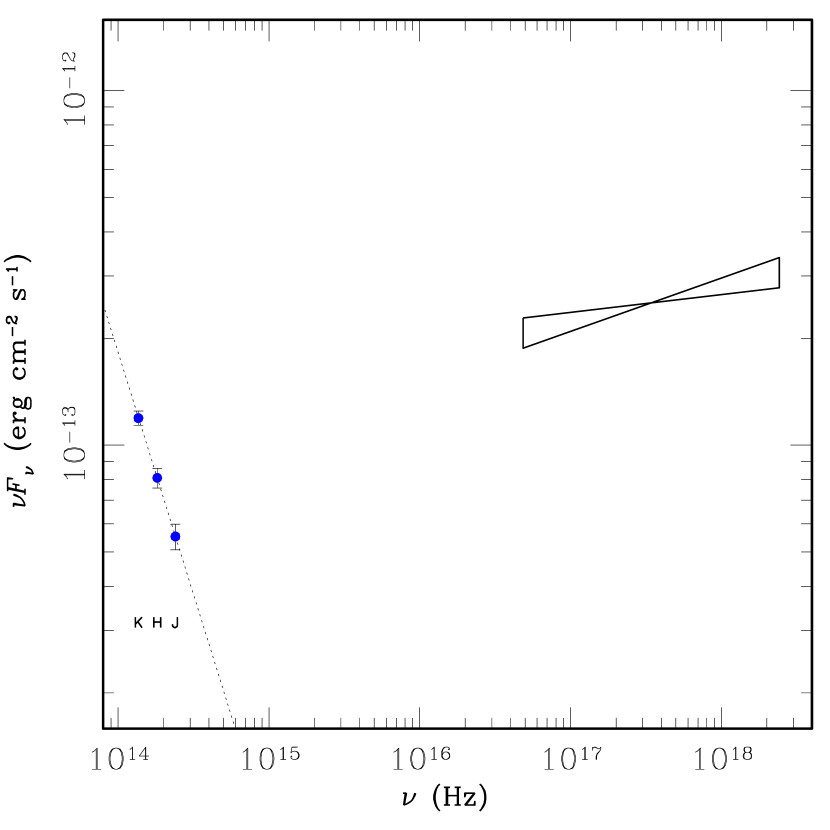
In Fig. 1 we show the light curves of GRB 031203. Early-time NIR photometry shows a dimming in all bands between the first and second night after the GRB. This is confirmed by PSF-matched image subtraction. We believe that we have seen the NIR afterglow of GRB 031203. The magnitudes are , , (9 hours after the GRB), obtained by subtracting the host contribution. Cobb et al. (2004) have -band observations at similar epochs, and do not report evidence for variability. However, extrapolation to the visible region yields , quite a faint value when compared to the host luminosity . Little contribution from the afterglow is seen in our measurement of Dec. 5, implying a quick decay between the two nights (, with ). However, there is no variation between the two -band observations of the first night (separated by 2.6 h), suggesting a break in the light curve or a bumpy behaviour. In Fig. 2, we compare the spectrum in the NIR and X-ray regions (Watson et al., 2004). A discontinuity is apparent, indicating a different origin for the emission in the two bands. The X-ray component has a much harder spectrum, and a slower decay (). Interestingly, Watson et al. (2004) infer a fast decay of the early-time X-ray afterglow, consistent with our NIR value (). In the standard model of afterglows (e.g. Sari, Piran & Narayan, 1998), a fast decay is consistent with a soft spectrum bluewards of the peak frequency.
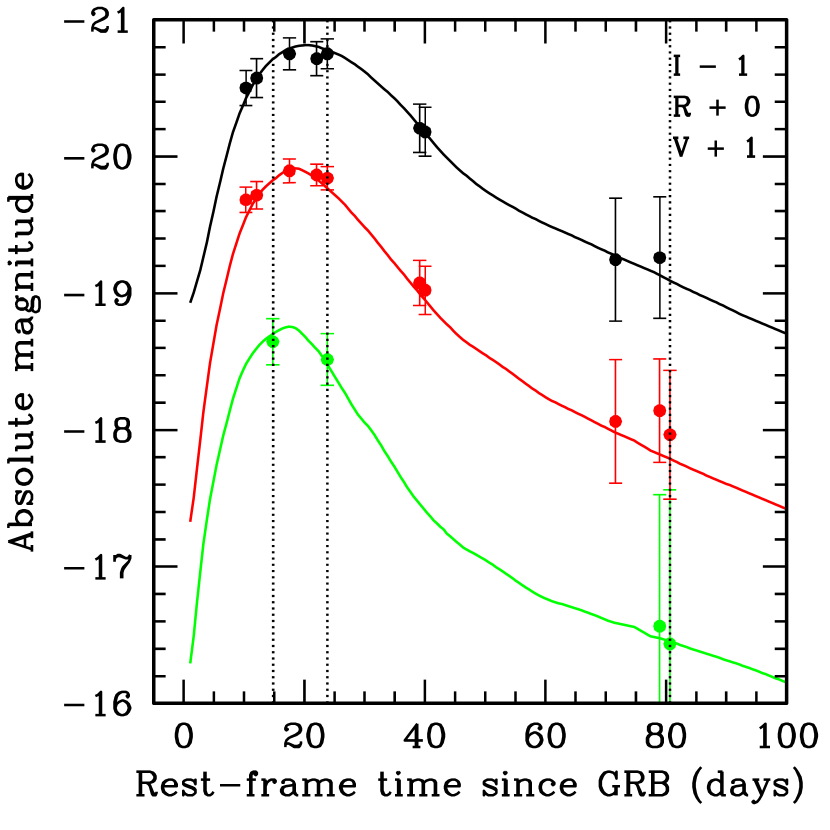
A few days after the GRB, a rebrightening is apparent in all optical/NIR bands. The rebrightening amounts to of the total flux, and is coincident with the center of the host galaxy to within ( pc at ). For comparison, we show in Fig. 1 the light curves of SN 1998bw (Galama et al., 1998; McKenzie & Schaefer, 2000), placed at and dereddened with (see below). Interpolation of the data was performed in order to estimate the fluxes of SN 1998bw at the frequencies corresponding to the observed bands. Even after correcting for cosmological time dilation, the light curve of SN 2003lw is broader than that of SN 1998bw, and requires an additional stretching factor of to match the and bands. Near the peak, the light curve is rather flat, resembling the hypernova SN 1997ef (Iwamoto et al., 2000) more than SN 1998bw. The -band maximum is reached on approximately 2003 Dec. 24 ( comoving days after the GRB). We note that the details of the light curve shape are sensitive to the removal of the host contribution. This may explain the different finding of Thomsen et al. (2004), who need no stretch, and Cobb et al. (2004), who find a longer rise. Assuming a light curve shape similar to SN 1998bw, which had a rise time of 16 days in the band, our data suggest an explosion time nearly simultaneous with the GRB. However, given that SN 2003lw was not strictly identical to SN 1998bw, and as we lack optical data in the days immediately following the GRB, a lag of a few days cannot be ruled out. Type-Ic SNe usually reach -band maximum in -20 days, the brightest events showing a slower evolution (see e.g. Fig. 2 of Mazzali et al., 2002).
A precise determination of the absolute magnitude of the SN is made difficult by the uncertain, and significant, extinction. C04 and Prochaska et al. (2004) constrain the average combined Galactic and host extinction to be based on the Balmer ratios of the host galaxy. Given the good spatial coincidence of the SN with the center of the host, such value is likely a good estimate for the SN extinction. We also adopt a Galactic extinction law (Cardelli, Clayton & Mathis, 1989) with . With the assumed reddening, SN 2003lw appears brighter than SN 1998bw by 0.5 mag in the , , and bands. The absolute magnitudes of SN 2003lw are hence , , and . Thomsen et al. (2004), using -band data, also found that SN 2003lw was brighter than SN 1998bw by mag, in full agreement with our result. Cobb et al. (2004), however, found a comparable luminosity for the two SNe; this discrepancy is entirely due to the lower extinction they assume.
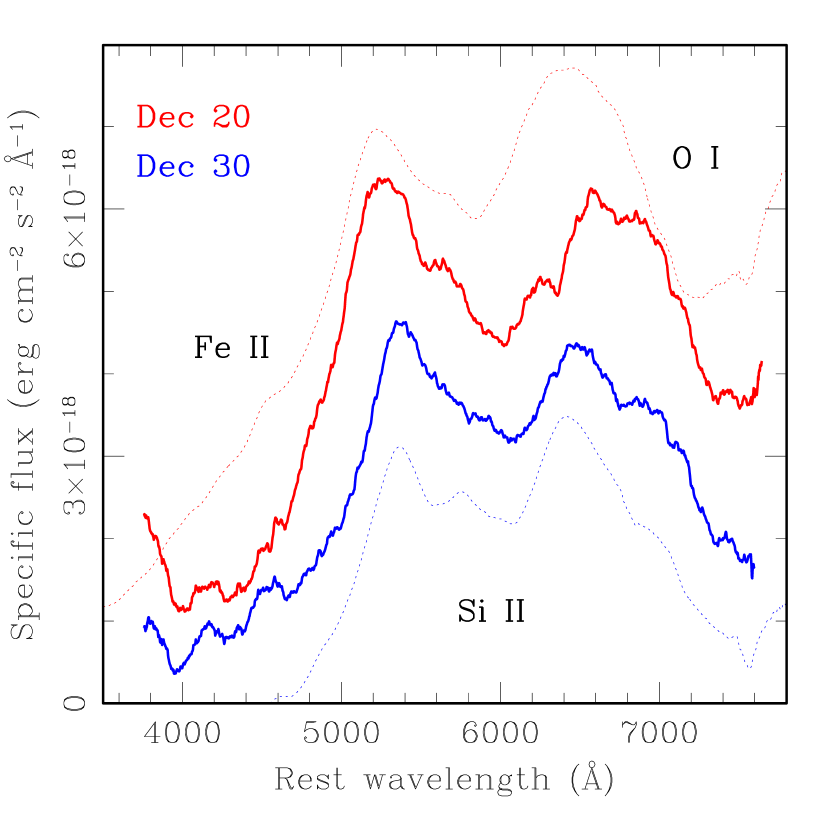
Fig. 3 shows the spectra of the rebrightening on 2003 Dec. 20 and Dec. 30 (14 and 23 rest-frame days after the GRB), after subtracting the spectrum taken on 2004 Mar. 1 (81 rest-frame days after the GRB). This assumes that the latter spectrum contains only a negligible contribution from the SN, which is confirmed by the photometry (Fig. 1). The spectra of SN 2003lw are remarkably similar to those of SN 1998bw obtained at comparable epochs (shown as dotted lines in Fig. 3; from Patat et al., 2001). Both SNe show very broad absorption features, indicating large expansion velocities. Thus we tentatively classify SN 2003lw as a hypernova. The main absorptions are identified in Fig. 3 as in SN 1998bw, following Iwamoto et al. (1998). The velocity of the Si II line in SN 2003lw is apparently smaller than in SN 1998bw. The broad peaks near 5300 Å and 6600 Å are probably the emission components of P-Cygni profiles due to the blending of several lines. There is evolution between the two epochs: the bluer bump is observed at longer wavelengths in the second spectrum, and is slighty narrower. Moreover, the shape of the redder peak is different in the two epochs. Both peaks appear at redder wavelengths than in SN 1998bw. Detailed modeling of the spectra will be presented elsewhere (Mazzali et al. 2004, in preparation).
By modeling the X-ray dust echo, Watson et al. (2004) concluded that GRB 031203 was an X-ray flash (XRF); however, the prompt emission data do not confirm this hypotesis (Sazonov, Lutovinov & Sunyaev 2004, in preparation). This event, like SN 1998bw (Pian et al., 2000), seems therefore to violate the correlation between the isotropic-equivalent gamma-ray energy and the peak spectral energy (Amati et al., 2002; Lamb et al., 2003). In fact, assuming erg (1-10000 keV; Watson et al., 2004), the Amati et al. (2002) relation would imply keV, a value indicating an XRF nature for GRB 031203. This is in contrast with INTEGRAL data. Of course, this issue will be be settled only after a thorough analysis of the prompt emission spectra.
The afterglow of GRB 031203 was very weak, the faintest ever detected in the optical/NIR. Extrapolation in the band yields a luminosity times fainter than the dimmest afterglow discovered so far (GRB 021211: Fox et al., 2003; Pandey et al., 2003). The detection of the SN optical light implies that the reason of such faintness was not an extreme dust obscuration. Also given the low redshift of the event, this example shows that some optical afterglows may escape detection just because they are faint (e.g. Fynbo et al., 2001; Lazzati et al., 2002; De Pasquale et al., 2003).
GRB 031203, together with GRB 980425 at , was a very dim event, perhaps a jet observed far from its axis (e.g. Maeda et al., 2002; Yamazaki, Yonetoku & Nakamura, 2003). Being so faint, they would have been likely missed at cosmological distances. Since the volume they sample is much smaller than that probed by classical, distant GRBs with , the rate of these events could be much larger. As noted by Thomsen et al. (2004), this would increase the detection rate for the Swift satellite (Gehrels et al., 2004). More rapid and efficient observations, also soon feasible thanks to Swift, will allow a detailed study of this largely unexplored class of events.
GRB 031203 was quite similar to GRB 980425, even if overall more powerful. Both events consisted in a single, underenergetic pulse. Their afterglows were very faint or absent in the optical, and showed a very slow decline in the X-ray (Pian et al., 2000; Watson et al., 2004). Last, they were both accompained by a powerful hypernova.
References
- Amati et al. (2002) Amati, L., et al. 2002, A&A, 390, 81
- Bersier et al. (2004) Bersier, D., et al. 2004, GCN Circ 2544
- Bloom et al. (1999) Bloom, J. S., et al. 1998, Nature, 401, 453
- Bloom, Frail & Kulkarni (2003) Bloom, J. S., Frail, D. A., & Kulkarni, S. R. 2003, ApJ, 594, 674
- Cardelli, Clayton & Mathis (1989) Cardelli, J. A., Clayton, G. C., & Mathis, J. S. 1989, ApJ, 345, 245
- Cobb et al. (2004) Cobb, B.E., Baylin, C.D., van Dokkum, P.G., Buxton, M.M., & Bloom, J.S. 2004, ApJ, 608, L93
- Della Valle et al. (2003) Della Valle, M., et al. 2003, A&A, 406, L33
- De Pasquale et al. (2003) De Pasquale, M., et al. 2003, ApJ, 592, 1018
- Fox et al. (2003) Fox, D. W., et al. 2003, ApJ, 586, L5
- Frail et al. (2001) Frail, D. A., et al. 2001, ApJ, 562, L55
- Frail (2003) Frail, D. A. 2003, GCN Circ 2473
- Fynbo et al. (2001) Fynbo, J. U., et al. 2001, A&A, 369, 373
- Galama et al. (1998) Galama, T. J., et al. 1998, Nature, 395, 670
- Gal-Yam et al. (2004) Gal-Yam, A., et al. 2004, ApJ, submitted (astro-ph/0403608)
- Garnavich et al. (2003) Garnavich, P. M., et al. 2003, ApJ, 582, 924
- Gehrels et al. (2004) Gehrels, N., et al. 2004, ApJ, in press (astro-ph/0405233)
- Götz et al. (2003) Götz, D., Mereghetti, S., Beck, M., Borkowski, J., & Mowlavi, N. 2003, GCN Circ 2459
- Heise et al. (2003) Heise, J. 2003, in AIP Conf. Ser. 662, Gamma-ray Burst and Afterglow Astronomy 2001, ed. G. R. Ricker & R. K. Vanderspek (New York: AIP), 229
- Hjorth et al. (2003) Hjorth, J., et al. 2003, Nature, 423, 847
- Iwamoto et al. (1998) Iwamoto, K., et al. 1998, Nature, 395, 672
- Iwamoto et al. (2000) Iwamoto, K., et al. 2000, ApJ, 534, 660
- Kulkarni et al. (1998) Kulkarni, S. R., et al. 1998, Nature, 395, 663
- Lamb et al. (2003) Lamb, D. Q., Donaghy, T. Q., & Graziani, C. 2003, ApJ, submitted (astro-ph/0312634)
- Lazzati et al. (2002) Lazzati, D., Covino, S., & Ghisellini, G. 2002, MNRAS, 330, 583
- Maeda et al. (2002) Maeda, K., Nakamura, T., Nomoto, K., Mazzali, P. A., Patat, F., & Hachisu, I. 2002, ApJ, 565, 405
- Mazzali et al. (2002) Mazzali, P. A., et al. 2002, ApJ, 572, L61
- McKenzie & Schaefer (2000) McKenzie, E. H., & Schaefer, B. E. 2000, PASP, 111, 964
- Mereghetti & Götz (2003a) Mereghetti, S., & Götz, D. 2003a, GCN Circ 2460
- Mereghetti et al. (2003b) Mereghetti, S., Götz, D., Borkowski, J., Walter, R., & Pedersen, H. 2003b, A&A, 411, L291
- Pandey et al. (2003) Pandey, S. B., et al. 2003, A&A, 408, L21
- Patat et al. (2001) Patat, F., et al. 2001, ApJ, 555, 900
- Pian et al. (2000) Pian, E., et al. 2000, ApJ, 536, 778
- Prochaska et al. (2003) Prochaska, J. X., Chen, H. W., Hurley, K., Bloom, J. S., Graham, J. R., & Vacca, W. D. 2003, GCN Circ 2475
- Prochaska et al. (2004) Prochaska, J. X., et al. 2004, ApJ, in press (astro-ph/0402085)
- Sakamoto et al. (2004) Sakamoto, T., et al. 2004, ApJ, 602, 875
- Santos-Lleo & Calderon (2003) Santos-Lleo, M., & Calderon, P. 2003, GCN Circ 2464
- Sari, Piran & Narayan (1998) Sari, R., Piran, T., & Narayan, R. 1998, ApJ, 497, L17
- Stanek et al. (2003) Stanek, K.Z., et al. 2003, ApJ, 591, L17
- Tagliaferri et al. (2004) Tagliaferri, G., et al. 2004, IAU Circ 8308
- Thomsen et al. (2004) Thomsen, B., et al. 2004, A&A, 419, L21
- Vaughan et al. (2004) Vaughan, S., et al. 2004, ApJ, 603, L5
- Watson et al. (2004) Watson, D., et al. 2004, ApJ, 605, L97
- Yamazaki, Yonetoku & Nakamura (2003) Yamazaki, R., Yonetoku, D., & Nakamaura, T. 2003, ApJ, 594, L79
- Yoshii et al. (2003) Yoshii, Y., et al. 2003, ApJ, 592, 467
- Zeh, Klose & Hartmann (2004) Zeh, A., Klose, S., & Hartmann, D. H. 2004, ApJ, in press (astro-ph/0311610)
- Zerbi et al. (2003) Zerbi, F. M., et al. 2003, GCN Circ 2471