Variable stars towards the bulge of M31: the AGAPE catalogue
††thanks: Complete Table 3 is available in electronic form at the CDS
via anonymous ftp to cdsarc.u-strasbg.fr (130.79.128.5) or via
http://cdsweb.u-strasbg.fr/cgi-bin/qcat?J/A+A/
††thanks: Based on data collected with the 2 m Bernard Lyot Telescope (TBL)
operated by INSU-CNRS and Pic-du-Midi Observatory (USR 5026).
The experiment was funded by IN2P3 and INSU of CNRS
We present the AGAPE astrometric and photometric catalogue of 1579 variable stars in a field centred on M31. This work is the first survey devoted to variable stars in the bulge of M31. The magnitudes of the objects and the colours suggest that our sample is dominated by red long-period variable stars (LPV), with a possible overlap with Cepheid-like type II stars. Fits of the light curves with sinusoids suggest that a large fraction of the stars correspond to periodic or semi-periodic objects with periods longer than 100 days. Twelve nova candidates are identified. Correlations with other catalogues suggest that 2 novae could be recurrent novae and provide possible optical counterparts for 2 supersoft X-ray sources candidates observed with Chandra.
Key Words.:
Galaxies:individual:M31 ; Cosmology: gravitational lensing ; Stars : variable : general ; Novae ; Cepheids; X-rays: stars1 Introduction
AGAPE Ansari et al. (1997) made a survey of several fields in the central part of M31 to look for gravitational microlensing events. As a major by-product, this survey discovered 1579 variable objects in a field centred on M31. The aim of this paper is to catalogue these objects. Due to the high star background, pixel lensing techniques have to be used to detect flux variations of individual stars. Since we are observing brightness fluctuations of unresolved stars, variable stars, particularly those that are intrinsically faint, are a significant background in the detection of real microlensing events. On the other hand, variable stars are also of high interest in their own right. Systematic surveys looking for variable stars in M31 have been first done by Hubble Hubble (1929)and Baade and Swope Baade and Swope (1963, 1965). Recent surveys on large fields have been used to search for Cepheids Magnier et al. (1997) and cosmological calibrators (DIRECT project Kaluzny et al. (1998)). However, except for novae and X-ray sources Kaaret Kaaret (2002), Kong et al. Kong et al. (2002), published work avoid the bulge region. Our study is then the first one done on this central zone and it leads to the identification of some variable stars poorly known in M31: Miras and long period Cepheid-like objects. Our catalogue is drawn from 3-seasons of measurements and our field has significant intersection with those of other studies (Crotts and Tomaney (1996), DIRECT field E, Riffeser et al. (2001)) and the Point AGAPE collaboration using the INT Kerins et al. (2001).
Sect. 2 presents AGAPE observations and variable selection. Sect. 3 presents the astrometry as well as our photometry and period search (Time Series Analysis). Sect. 4 discusses our type-identified variable stars and sect. 5 presents our complete catalogue as well as some conclusions.
2 AGAPE observations and variable selection
2.1 AGAPE observations and pixel method photometry
The AGAPE observations were made at the 2 m Bernard Lyot telescope (TBL) of the Pic du Midi Observatory with the f/8 spectro-reducer ISARD. A thin Tektronik CCD was used with a useful field of with pixels. Since the field of ISARD is small, 6 fields (called A, B, C, D, E, F) were necessary to cover one field centred on M31 and oriented along its main axis. The exposure times were generally 30(20) min in the passband. An additional field, Z, centred on the nucleus of M31 and with large overlap with A and B fields, was taken at the beginning of each night, as a reference to help in the pointing of the telescope. The exposures were as short as 1 min in both the and passbands for the Z central field. Since the short exposures prevent detection of faint or small amplitude variable objects, only novae are presented for the Z field data in this paper. The observing campaign ran from 1994 to 1996. It turned out that it was impossible to monitor all the fields in both colours each night. We put a priority on the first four fields, with an emphasis on red exposures. We obtained 69 observing nights in : 19 in 1994, 43 in 1995 and 7 in 1996. The number of images taken in each field during the whole survey is given in table 1.
| year | 1994 | 1995 | 1996 | total |
|---|---|---|---|---|
| filter | ||||
| A | 25/10 | 51/21 | 8/2 | 84/33 |
| B | 24/10 | 41/21 | 7/2 | 73/33 |
| C | 20/8 | 40/16 | 7/0 | 67/24 |
| D | 18/5 | 34/14 | 6/0 | 59/19 |
| E | 6/0 | 34/10 | 6/0 | 46/10 |
| F | 5/0 | 27/8 | 6/0 | 38/8 |
| Z | 32/12 | 55/20 | 13/1 | 100/33 |
The AGAPE detection procedure is described in Ansari et al. Ansari et al. (1997). It is based on super-pixel (7x7 pixels) photometry with sides roughly twice the standard seeing. These super-pixels are photometrically normalised to a reference frame and corrected for seeing variations. Then we transform the super-pixel ADU photometry to Johnson-Cousins and magnitudes as described in sect. 3.2.
2.2 Variable stars selection
During the selection procedure, we excluded an area of 20 pixels around well-resolved stars. Automatic procedures are efficient to detect stars brighter than . Le Du (2000) studies the relation of this influence zone with seeing. These resolved stars should contain no or very few M31 variable stars but stars from our Galaxy and M31 globular clusters. The light curves for each uncontaminated super-pixel are analysed. Baseline for background flux is taken as the minimum of a sliding average calculated on 4 to 8 consecutive points depending of the time sampling of the field. One bump is defined as beginning when 3 consecutive points lie above background and ending when 2 consecutive points fall below . For each bump, we compute its likelihood function :
One superpixel is selected as including a variable object when it contains one bump with its likelihood function greater than 100. We choose a high value for in order to eliminate false variable stars. These criteria lead to the selection of 1579 variable stars.
3 Astrometry, photometry and period search
3.1 Astrometry
Astrometry is based upon the catalogue of Magnier et al. Magnier et al. (1992), the most populous one available towards the bulge of M31 with the most homogeneous coverage of our field. This catalogue is connected to the Space Telescope Guide Star Catalog with an accuracy better than Magnier et al. (1993); Haiman et al. (1994). For each of AGAPE fields B to F we have from 6 to 20 stars in common with this catalogue. The final standard deviation on the positions is in the range . However, for the near-central fields Z and A, less than 3 stars are identified as common and we were obliged to use another reference catalogue. We thus used the one obtained by Aurière et al. Aurière et al. (1992) for their globular clusters study, based on the combination of Battistini et al. (1987) and Wirth et al. (1985). For these two fields the standard deviation on the distances between our positions and those on the catalogue for 11 and 10 common stars in fields A and Z respectively is . Finally we conclude that we have an astrometric accuracy in the range for our variable star positions, combining our uncertainties with those of Magnier and the other catalogues.
3.2 Photometry
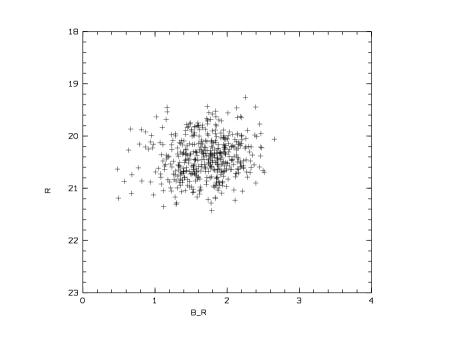
The super-pixel photometry gives the integrated flux in squares of 7x7 pixels corresponding to 2.1” x 2.1” on the sky. We first have to remove the stellar background which is bright and chaotic in the M31 bulge. Almost all variable stars are not resolved nor significantly measured at minimum. In this case we can consider the background as being the average minimum flux, which is taken as the minimum of the sliding average on five points along the light curve. However, the star always contributes at some level even at minimum brightness and we also compute the average flux (with rejection) in a zone around the object. The background is taken as the lesser of these two values and is subtracted from flux values. To obtain and Johnson-Cousins magnitudes, we use the colour equations as given in Ansari et al. Ansari et al. (1997) transforming between super-pixel and PSF photometry. Since our field contains several “bright unvariable” stars measured by Magnier et al. Magnier et al. (1992), we use 36 common stars in and 19 common stars in (excluding central fields A and B) to derive magnitude scale constants for our data. The standard deviations corresponding to the computation of these constants are 0.15 and 0.24 for and respectively. They are dominated by random scatter and include our errors and Magnier et al. Magnier et al. (1992) errors. This accuracy is sufficient to characterise the magnitude at maximum observed brightness of the variable stars and the colour range for our star sample, but is too poor for using individual indices for identification purposes. The magnitude measurements will be thus used for making a Colour Magnitude Diagram but will not be given in the final catalogue. To compute the magnitude at maximum we select the 5 brightest measurements and eliminate the 2 brightest ones to avoid possible residual cosmic rays. is the average of the 3 remaining measurements. To enable a reliable magnitude measurement and thus a colour, the stars have to emerge significantly from the background. Since there are fewer measurements, the magnitude at maximum is the average of the 2 brightest measurements. is the difference between the peak and in each passband. Figure 1 gives our Colour Magnitude Diagram at observed maximum brightness for the 459 variable stars which have been measured in the passband, in fields A, B, C, D. This diagram is interpreted in sect. 4.1.
| Ident |
|
Ident |
|
||||||
|---|---|---|---|---|---|---|---|---|---|
| B030 | 20.5 | 060 | C032 | 20.6 | 187 | ||||
| B098 | 21.1 | 103 | B005 | 20.3 | 188 | ||||
| A266 | 21.1 | 111 | A320 | 20.2 | 189 | ||||
| B054 | 19.9 | 116 | A077 | 19.7 | 190 | ||||
| A058 | 19.6 | 123 | B043 | 20.1 | 193 | ||||
| C071 | 20.9 | 125 | A189 | 20.4 | 194 | ||||
| C188 | 21.2 | 127 | A185 | 20.6 | 196 | ||||
| A014 | 20.1 | 131 | A044 | 20.3 | 197 | ||||
| C055 | 20.5 | 132 | A162 | 20.0 | 197 | ||||
| C012 | 20.7 | 133 | A241 | 20.8 | 197 | ||||
| C081 | 20.9 | 134 | A343 | 20.0 | 200 | ||||
| C013 | 20.3 | 140 | A190 | 20.3 | 202 | ||||
| A059 | 20.4 | 142 | A002 | 19.6 | 210 | ||||
| A018 | 20.1 | 148 | B006 | 20.3 | 212 | ||||
| A046 | 20.2 | 151 | C016 | 20.5 | 212 | ||||
| B014 | 20.4 | 164 | C169 | 21.0 | 216 | ||||
| A286 | 20.6 | 155 | A019 | 20.2 | 220 | ||||
| B058 | 20.6 | 156 | A109 | 20.3 | 223 | ||||
| C017 | 20.5 | 162 | B140 | 20.0 | 244 | ||||
| B165 | 20.2 | 164 | C006 | 20.1 | 244 | ||||
| A079 | 19.9 | 165 | B007 | 20.0 | 250 | ||||
| B016 | 20.0 | 165 | A136 | 20.9 | 254 | ||||
| C128 | 20.7 | 165 | A049 | 20.6 | 259 | ||||
| A060 | 20.3 | 168 | C004 | 19.9 | 335 | ||||
| B164 | 20.2 | 171 | C072 | 20.1 | 344 | ||||
| C177 | 20.1 | 179 | A001 | 19.5 | 368 | ||||
| C015 | 20.3 | 186 | A282 | 20.6 | 385 |
3.3 Period search (time-series analysis)
Our photometric data, as to time series analysis, are characterised by: - their sampling which is unevenly spaced; - one measurement per night; - yearly season-limited autumn observations. We are able to detect periods in the range 60-400 days (and we will see that this range is appropriate for the study of bulge variables which contain an interesting population of long-period objects). In this work we do not extract an extensive sample of periodic variable stars but rather identify a subset to characterise our sample. We use the Scargle method Scargle (1982) as implemented in MIDAS for the Time Series Analysis of our data. It is a modification of the periodogram analysis, equivalent to best-squares fitting of sine waves to the data and suited to unevenly spaced data Scargle (1982). For each variable star, we have fitted the Scargle sinusoid on the light curves from the three seasons and made a visual inspection. A majority of these light curves could correspond to periodic or semi-periodic objects with periods greater than 100 days. The longest observational season (1995) spans about 150 days. Periods shorter than 150 days are thus favoured for giving a convincing visual confirmation of the light-curve fit. For periods greater than 250 days, light curves with a sharp feature which is clearly observed on each year are accepted. For these longest periods, we checked systematically that the half period did not fit. We present in Fig. 2 to Fig. 10 nine of these light curves fitted by their Scargle sinusoid (X-axis is in (J-2449624.5) days, Y-axis in ADU/sec).
Table 2 gives and periods for 54 stars for which the visual fit of the Scargle sine was as good as in the cases of Fig. 2 - Fig. 10. The period estimate is given with 10 to 20% accuracy. Since our period determinations are only estimates, we don’t give them in our final catalogue.
3.4 Period Luminosity Diagram
The Period Luminosity Diagram is a classical representation for characterising pulsating variable stars. We thus plot our data presented in Table 2 in such a diagram in Fig. 11. In order to characterise the nature of our variable stars we have drawn fiducial lines for the location of M31 cepheids Freedman and Madore (1990) LMC RV Tauri stars Alcock et al. (1998) and Miras Clayton and Feast (1969), the two last sets of data being converted to M31 distance. M31 cepheids and LMC RV Tauri stars have been observed in the passband and obtaining these lines was rather straightforward. On the other hand, as for Miras, almost all recent investigations for P/L studies are made in infrared colours or are transformed in bolometric magnitudes. Thus, we decided to use the passband absolute magnitude / period diagram of Clayton and Feast Clayton and Feast (1969), which we transformed to passband at M31 distance. Colour equation from to is derived from diagrams from MACHO data Alves et al. (1998). We used also this reference to check the reliability of the Clayton and Feast’s data for long period Miras, since these authors said there were uncertain. The astrophysical aspect of this diagram is discussed in section 5.2.
4 Variable star general catalogue
4.1 The catalogue
Each variable star in the catalogue is identified as AGPVm, m running from 1 to 1579. Then are given: Fn(x,y) (F being the letter of identification of AGAPE field and n the variable star number in this field; x and y being the pixel coordinates in the reference frame), right ascension and declination for 2000.0, magnitude at observed maximum as defined in Sec. 3.2, and the likelihood function as defined in section 2.2. Table 3 presents an extraction of this catalogue, showing the first and last star for each field and the 12 nova candidates with their numbers added (with respect to CDS catalog) in the last column. When the novae were discovered by eye, no value is given.
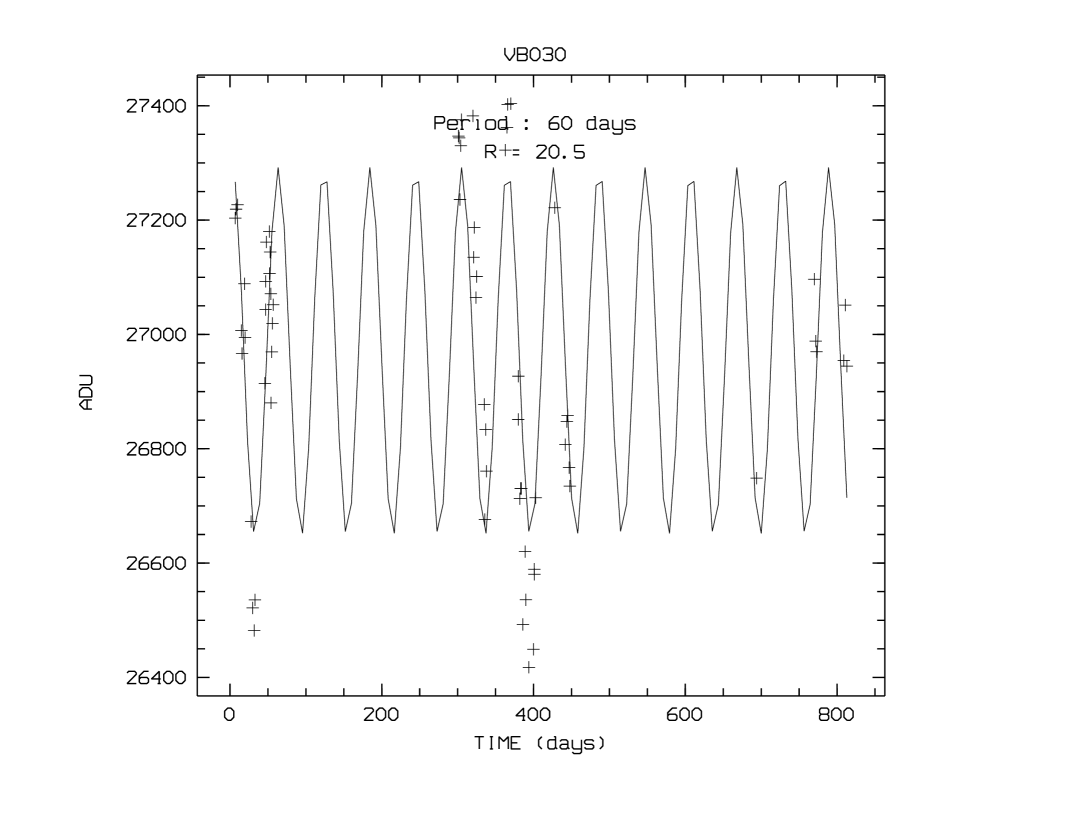

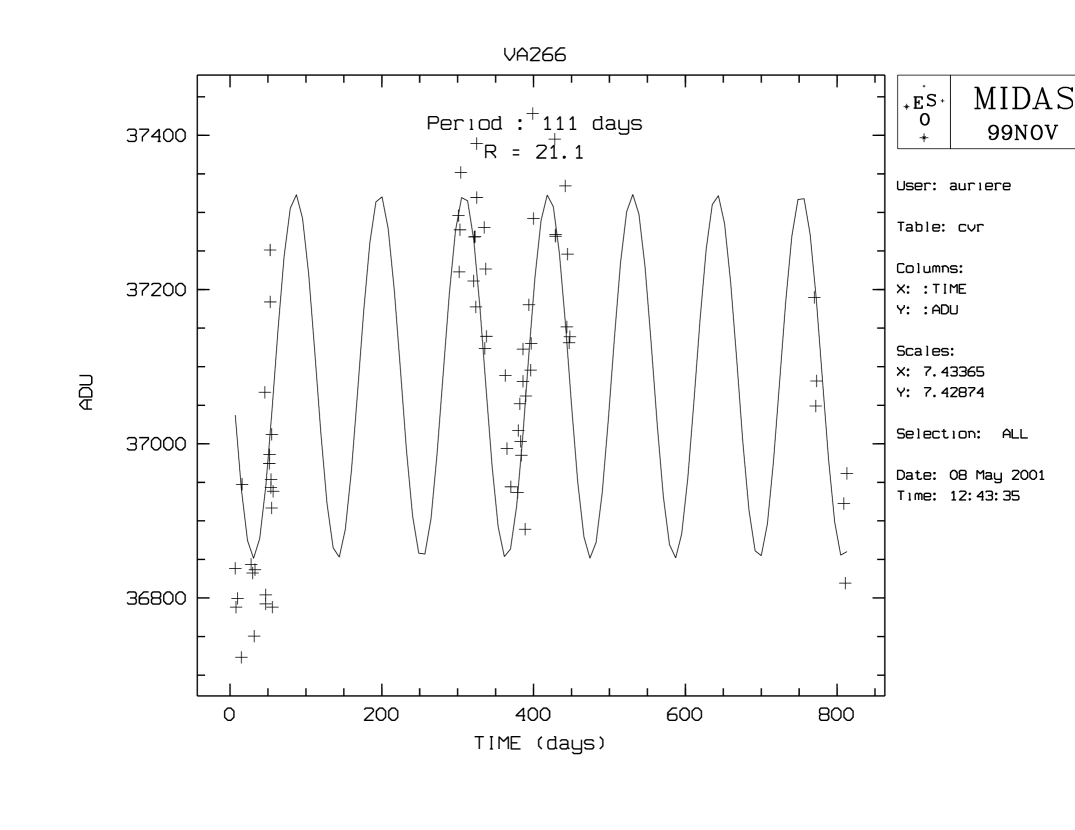
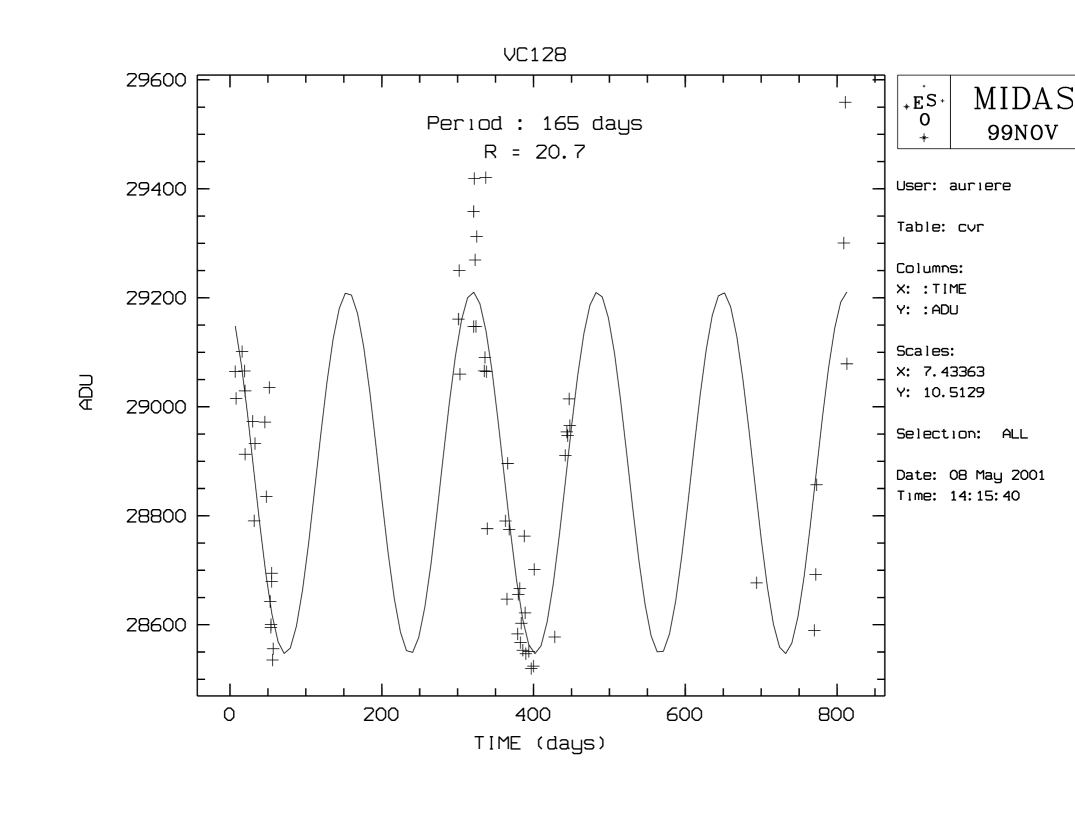
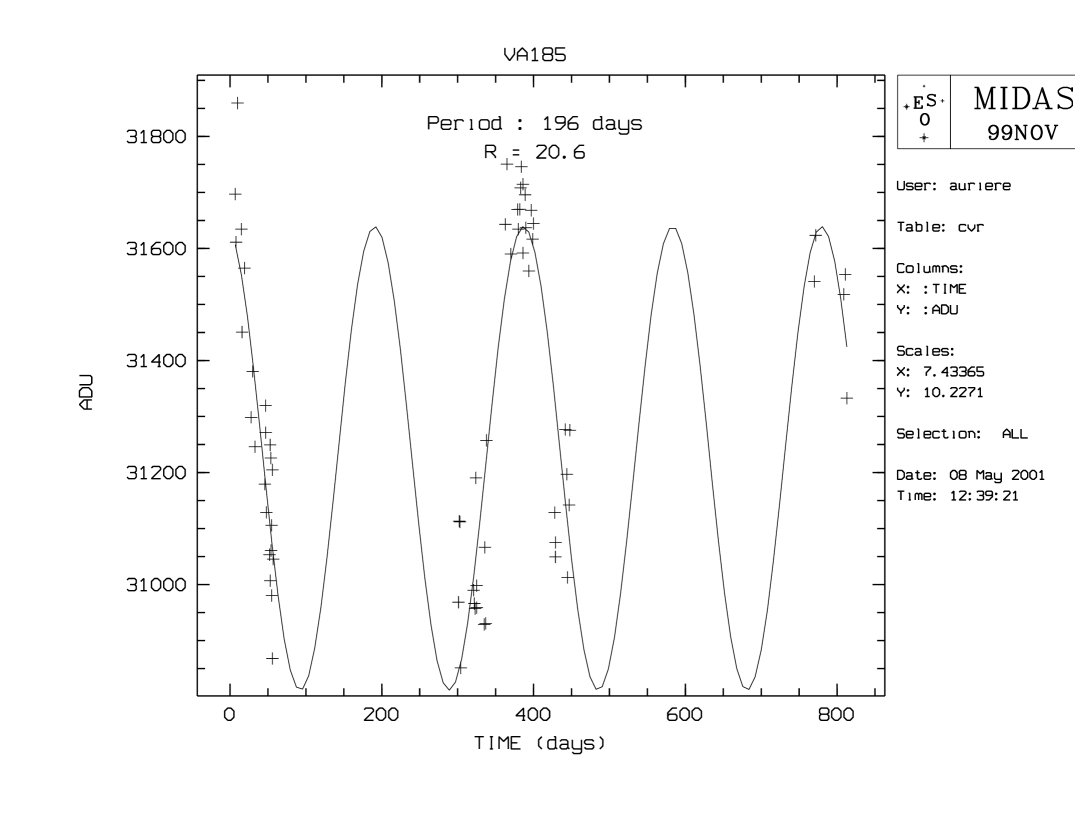


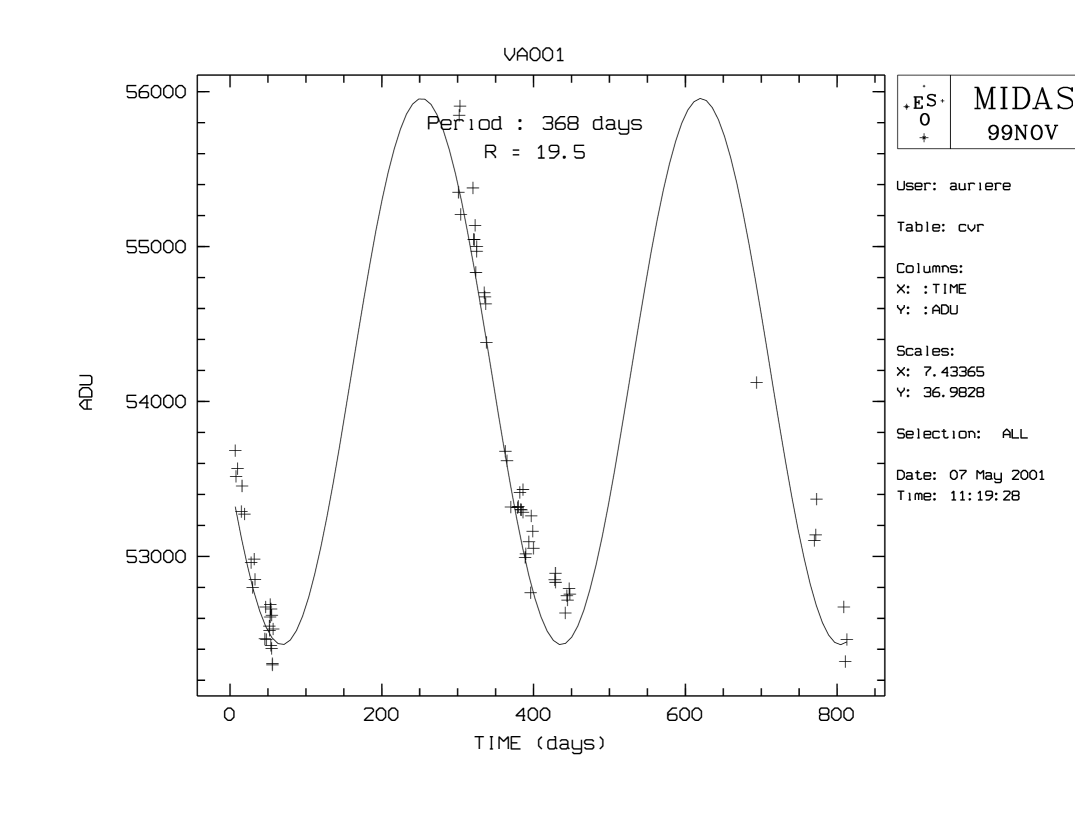
Fig.2.-Fig.10. Variable light-curves fitted by their Scargle sinusoid. X-axis is in (J-24449624.5) days, Y-axis in ADU/sec. The 3 first objects are of the Cepheid type, the 5 last ones are certainly LPVs.
| Id | Fn | (2000.0) | (2000.0) | # | ||
|---|---|---|---|---|---|---|
| AGPV0001 | A001(0697,0392) | 0h42m53.36s | 41d14’26.8” | 19.48 | 940 | |
| … | ||||||
| AGPV0390 | A397(0834,0352) | 0h42m50.26s | 41d14’00.8” | 20.46 | 100 | |
| AGPV0391 | A398(0365,0380) | 0h42m58.52s | 41d15’49.8” | 17.14 | NOV01 | |
| AGPV0392 | B001(0920,0220) | 0h42m26.41s | 41d16’56.2” | 16.07 | 32000 | NOV03 |
| AGPV0393 | B002(0754,0333) | 0h42m31.57s | 41d17’16.0” | 17.24 | 20000 | NOV02 |
| AGPV0394 | B003(0422,0305) | 0h42m36.32s | 41d18’41.7” | 19.45 | 720 | |
| … | ||||||
| AGPV0581 | B190(0446,0372) | 0h42m37.40s | 41d18’23.7” | 20.94 | 100 | |
| AGPV0582 | C001(0597,0350) | 0h42m50.65s | 41d21’20.4” | 19.28 | 3000 | |
| AGPV0583 | C002(0784,0384) | 0h42m48.36s | 41d20’28.5” | 18.47 | 2800 | NOV04 |
| … | ||||||
| AGPV0842 | C272(0771,0504) | 0h42m51.18s | 41d20’09.8” | 21.11 | 100 | |
| AGPV0843 | D001(0910,0609) | 0h43m 8.41s | 41d16’39.9” | 16.80 | 30000 | NOV05 |
| AGPV0844 | D002(0927,0567) | 0h43m 7.22s | 41d16’43.4” | 19.39 | 1800 | |
| … | ||||||
| AGPV1185 | D348(0585,0580) | 0h43m13.04s | 41d18’04.9” | 21.43 | 100 | |
| AGPV1186 | E001(0721,0300) | 0h42m17.24s | 41d13’35.4” | 17.65 | 4900 | NOV08 |
| AGPV1187 | E002(0459,0646) | 0h42m29.00s | 41d13’36.1” | 18.22 | NOV06 | |
| AGPV1188 | E003(0317,0264) | 0h42m23.07s | 41d15’20.6” | 20.63 | 490 | |
| … | ||||||
| AGPV1438 | E259(0337,0392) | 0h42m25.51s | 41d14’52.3” | 21.00 | 100 | |
| AGPV1439 | E260(0724,0490) | 0h42m21.30s | 41d20’28.7” | 18.41 | NOV07 | |
| AGPV1440 | F001(0905,0390) | 0h42m33.27s | 41d09’59.6” | 20.35 | 520 | |
| … | ||||||
| AGPV1575 | F138(0425,0400) | 0h42m41.22s | 41d11’55.2” | 20.89 | 100 | |
| AGPV1576 | F139(0346,0381) | Oh42m42.08s | 41d12’18.0” | 17.56 | NOV09 | |
| AGPV1577 | F140(0430,0650) | 0h42m46.60s | 41d11’ 8.3” | 17.82 | NOV10 | |
| AGPV1578 | Z001(0528,0266) | 0h42m43.75s | 41d16’52.0” | 16.35 | NOV11 | |
| AGPV1579 | Z002(0658,0411) | 0h42m44.81s | 41d15’53.6” | 14.98 | NOV12 |
4.2 Correlation with other catalogues
We have then correlated our catalogue with the General Catalogue of Variable Stars (GCVS, Durlevich et al. Durlevich et al. (1996)) as available at CDS, with Chandra sources Kaaret (2002); Kong et al. (2002); Di Stefano et al. (2003), as well as 2MASS data Skrutskie et al. (1997). As to the GCVS, about 200 objects fall in our field, all being classified as novae but one cepheid. 7 objects of GCVS (all novae) fall at less than 2” from our variable stars. Among these associations, only one concerns one of our nova candidates and we consider that the other ones are chance associations. Nova 27 from GCVS is at 1.9” from NOV12 (AGPV1579, Z002, sect. 5.3). Nova 27 was observed in 1985 Ciardullo et al. (1987) and could then be a recurrent nova.
M31 V0934 of GCVS, which is V38 of Hubble (1929), is a type I cepheid (period 17.764 days). It falls in our field C but has no counterpart in our catalogue. However, we find on our data one variable object located 2.5” from V0934 position with about 20 magnitude at maximum. M31 V0934 may have been discarded in our microlensing survey as being one resolved star on our reference frame (sect. 2.2).
Chandra made several observations of the bulge of M31. Tens of X-ray sources were detected with location accuracy better than 1” (Kaaret Kaaret (2002), Kong et al. Kong et al. (2002)). These X-ray observations are the only ones which deserve correlation with our catalogue since they have small error boxes (1” accuracy versus several several ” for ROSAT HRI) necessary to avoid too many chance identifications. Among the 4 X-ray sources which fall nearer than 2” from our variable objects, 2 deserve peculiar attention. CXOM31 J004242.1+411218 Kaaret (2002) is located 0.7” from NOV09 (AGPV1607, F139). This identification is discussed in sect. 5.3.
CXOM31 J004247.8+411550. is located 0.6” from AGPV0288, in the very central bulge. Kong et al. Kong et al. (2002) observed it again as r1-25. Di Stefano et al Di Stefano et al. (2003) include this source in their list of super soft X-ray sources candidates. Di stefano et al. Di Stefano et al. (2003) could not find any optical counterpart brighter than magnitude 21 on HST archives, in the wavelenth range. AGPV0288 peaks at in AGAPE observations, and is a small amplitude irregular object. r1-25 is fitted with a blackbody model kT=122 eV, rather hard for a supersoft source. Clearly, this association will deserve a deeper study.
About 50 objects from 2MASS catalogue fall in our field. None are associated with AGAPE variable stars within 2” radius, but some are associated with brighter objects (galactic stars or globular clusters). This is in accordance with the fact that the rather short period LPVs of our catalog are expected to be fainter in K that the limiting magnitude of the 2MASS catalog (about K=16), when scaling LMC results Hughes and Wood (1990); Lebzelter et al. (2002).
4.3 Spatial distribution of variable stars and the extinction in M31 bulge
The spatial distribution of the variable stars is of importance for two reasons : variable stars are often considered as a possible reference background from which it will be possible to disentangle a microlensing event population which will present a near/far M31 asymmetry Crotts (1992); Kerins et al. (2001); part of the variables we have observed really belong to the bulge and we can thus contribute to the disk/halo distribution debate of objects in M31. An important factor in the star distribution in M31 comes from extinction Hatano et al. (1997).
In the AGAPE survey, the six investigated fields are distributed apart from the major axis of M31, A D F being on the “far side” and B C E on the “near side”. We consider that the E and F fields have too sparse observations to give significant data (cf. Table 1) for this problem. At the near side, which corresponds to the “bottom” of Hatano et al. (1997), the bulge is in part behind the (dusty) disk. In our study, the most significant anomaly in the variable star distribution is due to B field. It contains half the number of variable stars in field A (190 with respect to 370; almost same ratio for the corresponding numbers of stars per brightness unit). The B field contains extinction zones such as the dust complex D395A Melchior et al. (2000b) . However, using the extinction map of Melchior et al. Melchior et al. (2000b), we did not find a correlation between the variable stars and extinction distributions. This could come because extinction can be very patchy in galaxies Thoraval et al. (1999). Local large extinction has been pointed out in M31 in the case of globular clusters Barmby et al. (2002).
Thus, because of extinction and perhaps threshold effects, the variable star distribution towards the bulge of M31, might be not symmetric with respect to the major axis of the galaxy.
5 Identified variables
5.1 Introduction
Our observational data enable us to characterise variable stars with their absolute magnitudes, colours and periods. Observational conditions of the AGAPE experiment bring some biases and thus some limitations on the identification of the variable stars which were discussed in previous sect.s. Our robust variability criteria lead to almost all measured of variable stars being between 20 and 21 magnitudes. Inspection of tables of data published by the DIRECT collaboration shows that the bulk of their detected variable stars is in the same magnitude range as ours.
Our search detects M31 variable stars brighter than or . Colour magnitude diagrams such as that of Kukarkin Kukarkin (1975) show that this limit enables the study of only the brightest part of the variable star population including long period red stars and Cepheids, and almost all the kinds of stars observed by Baade et al. Baade and Swope (1963, 1965). On the other hand, RR Lyrae stars, which are difficult to observe from the ground in M31 because of their faintness Pritchet and van den Bergh (1987), are clearly out of reach.
We are able to study the population II variable stars which are tracers of the bulge in a region where by projection bulge and disk populations are not easy to disentangle. Few population II objects like RV Tauri stars have been studied, and Miras have not been unambiguously detected in M31. Up to now variable surveys were done more in the disk population than in the bulge. Studies have shown that when approaching the center of M31 a number of new star classes appeared. This is first the case for bright red stars, some of them being possibly very long period Miras Rich and Mould (1991). Hodge Hodge (1992) remarks that from the work of Swope and Baade Baade and Swope (1963, 1965) the number of irregular variables increases when approaching the bulge. Also, the same author shows that the ratio of type I Cepheids to type II Cepheids has a maximum in medium parts of the disk. Thus one expects to find very few type I Cepheids in the bulge direction. Apart from novae which are outstanding bright objects in our sample, other objects can be characterised by the CMD of the population resolved in . Figure 1 shows that this population is peaked on around mag. () and around mag. The photometric properties of the variable stars when compared to the HR diagram of Kukarkin Kukarkin (1975), are compatible with faint RV Tauri variables or bright semi-regular ones. The bulk of the measured periods is in the range 100-250 days and thus they are compatible with this hypothesis. It is also remarkable that the bulk of the CMD of Fig. 1 is very similar (taking into account the distance modulii) to that obtained by Melchior et al. Melchior et al. (2000a) for variables detected using the pixel method in the LMC, which are interpreted as ”Long Timescale and Long Period Variables”.
In the two following sections, we describe work on variable stars for which we could identify the type, namely rather long period pulsating objects and novae.

5.2 Periodic pulsating stars
Bright pulsating stars are generally divided into Cepheid-like and long period red variables (called hereafter LPVs). In the part of the colour magnitude diagram we investigate here, as well as in the 100-200 days period interval, these two kinds of variable stars overlap. However, since LPVs have generally periods greater than 100 days, we can expect the shortest periods variable stars in our catalogue to be Cepheid-like (example Fig. 2). Actually, some of the light curves are reminiscent of the asymmetric shape observed for cepheids Stetson (1996). On the other hand, stars with periods greater than 200 days are presumably LPVs (examples Fig. 8, 9, 10).
Early work on M31 Cepheids was done by Baade and Swope Baade and Swope (1963, 1965) with the Palomar telescope to calibrate the M31 distance. Modern CCD studies were made Freedman and Madore (1990); Magnier et al. (1997); Mochejska et al. (2000) and the period luminosity for M31 population I Cepheids is by now well established for several colours including . Figure 11 shows that our shorter period variable stars are at least 2 magnitudes fainter than M31 population I cepheids Freedman and Madore (1990). They thus clearly belong to the population II type Wallerstein and Cox (1984). Actually, the shortest period star of Table 2 lies very near the location of LMC RV Tauri stars, for which, unfortunatelly the long period range is not known Alcock et al. (1998). The light-curve of one star of this type in M31 has been recently presented (Riffeser et al, 2001) ; however, our data sampling is not good enough to uncover the characteristic double-wave shape of RV Tauri stars in our light curves.
LPV (Period 100 days) are classically divided into Miras and semi-regular variables Habbing (1996); the Miras are classically those with amplitude larger than 2.5 mag. Microlensing surveys have brought an impressive number of new variables, infrared data (both near-infrared from the ground and far-infrared from space) Hipparcos and HST observations have completely renewed our knowledge on pulsating stars and the two classes are now considered as overlapping Bedding and Zijlstra (1998); Lebzelter et al. (2002). Optical light curves and optical colours of LPVs have instigated new studies Delaverny et al. (1997); Mennessier et al. (1997). Figure 11 shows that our stars are generally brighter than what is expected for a Mira Clayton and Feast (1969). Since semi-regular variables are rather brighter than Miras, they should be the more frequent in our catalog and Table 2. Yearly windowing has certainly biased our selection towards near-one-year periods. We checked that half the derived periods did not give plausible fits. C004 (Fig. 8), C072 (Fig. 9) and A001 (Fig. 10) are particularly convincing. A001 presents a 3 magnitude amplitude light curve and is very likely to be a Mira. However, these objects are more than one magnitude brighter than what is expected for galactic or LMC Miras with the same period. We cannot exclude neither peculiar LPVs nor that our phase undersampling leaded us to a false (too long) period determination.
| # | Id | Date | year | |
|---|---|---|---|---|
| NOV01 | AGPV0391 | 17.14 | 006.88 | 1995 |
| NOV02 | AGPV0393 | 17.24 | 399.83 | 1995 |
| NOV03 | AGPV0392 | 16.07 | 303.10 | 1995 |
| NOV04 | AGPV0583 | 18.47 | 771.89 | 1996 |
| NOV05 | AGPV0843 | 16.80 | 335.14 | 1995 |
| NOV06 | AGPV1187 | 18.22 | 301.12 | 1995 |
| NOV07 | AGPV1439 | 18.41 | 006.96 | 1994 |
| NOV08 | AGPV1186 | 17.65 | 443.93 | 1995 |
| NOV09 | AGPV1576 | 17.56 | 006.97 | 1994 |
| NOV10 | AGPV1577 | 17.82 | 321.10 | 1995 |
| NOV11 | AGPV1578 | 16.35 | 320.94 | 1995 |
| NOV12 | AGPV1579 | 14.98 | 444.82 | 1995 |
5.3 Novae
M31 novae have been systematically searched for more than 70 years Hubble (1929); Arp (1956); Rosino et al. (1989); Ciardullo et al. (1987); Shafter and Irby (2001). The relation between their magnitude and rate of decline is now established Capaccioli et al. (1989) and can be compared to those of other galaxies Della Valle and Livio (1995). In addition to being interesting in their own right, novae are of cosmological interest in the context of Type Ia supernova precursors and the nature of supersoft sources Kahabka and van den Heuvel (1997).
Twelve nova candidates were detected by AGAPE. These objects are so bright at maximum that some were found visually and we can expect detection of all novae which occurred in our field during AGAPE observation periods and for which 3 points of the light curve were measured.

Table 4 gives the data for our 12 nova candidates named as NOVn (first column) where n goes from 01 to 12. Column 2 gives the catalogue identification, so that coordinates can be found in Table 3 (see also section 5.1). The next three columns give , the date of the observed maximum brightness given in (J-2449624.5) days, and the year of occurrence. Figure 12 shows the light curves for these twelve nova candidates. Only six of the novae were observed at maximum. NOV02, 04, 06, 08, 11 were observed by Shafter and Irby Shafter and Irby (2001). NOV08 and NOV09 present very small brightness decreases and are peaked around . They could correspond to the wing part of bright nova light-curves, as NOV06 could be as well. Actually AGAPE observed NOV08 during 1995’s season and Shafter and Irby Shafter and Irby (2001) in 1996, when it was the brightest object of their survey. NOV08 could thus be a recurrent nova. Also one nova appears to be observed at 1.9” from NOV12 by Ciardullo et al. Ciardullo et al. (1987) in 1985 (their nova 27, see sect. 5.1). NOV12 could thus be a recurrent nova.
Now, the Chandra source CXOM31 J004242.1+411218. Kaaret (2002) is located 0.7” from NOV09 (see sect. 5.1). NOV09 was observed in 1994’s AGAPE runs and Chandra observations were performed in 2001 october. Orio et al. Orio et al. (2001) describe which can be expected as X-ray emission from classical and recurrent novae. Most classical and recurrent novae emit hard X-rays in the first months after the outburst and during 2-10 years, with peak X-ray luminosity of a few times erg/s. On the other hand, the supersoft X-ray phase of novae which is also relatively short lived (up to 10 years) is observed only for up to 20% of novae according to 108 objects analysed contained in the ROSAT archive. This phase corresponds to very soft spectra (equivalent temperatures in the range 15-80 eV) and high luminosity ( - erg/s bolometric luminosity) Kahabka and van den Heuvel (1997). CXOM31 J004242.1+411218. has a luminosity of erg/s and thus cannot be associated with the hard emission of an M31 nova. On the other hand, scaling an estimate presented by Kaaret Kaaret (2002), a blackbody spectrum with a temperature of 80 eV would imply an unabsorbed luminosity of erg/s in the 0.1-10 keV band for HRC count rate of this source. Lower temperatures would require higher unabsorbed luminosities to produce the same observed count rate. The luminosity of CXOM31 J004242.1+411218 is thus consistent with that of a supersoft source. Unfortunately it is a rather faint source and no spectral information is available. No other observations with Chandra Kong et al. (2002) nor XMM Newton Di Stefano et al. (2003) report this source. It may be because it is near the limiting sensitivity of these observatories, but supersoft sources are also known to be transient sources Trudolyubov et al. (2001). Up to now only 2 X-ray sources were suggested has being possible supersoft ones linked with M31 nova outbursts (Nedialkov et al. Nedialkov et al. (2002), Kaaret Kaaret (2002),Di Stefano et al.Di Stefano et al. (2003). In sect. 5.1 we discuss another possible identification of a supersoft source with an AGAPE catalogue variable object.
An important question concerning novae is about their location; both their radial distribution and population to which they belong is still in debate. First Ciardullo Ciardullo et al. (1987) showed that there is not a central hole in their distribution as could be derived from Arp (1956) observations. The debate is to know whether novae belong to the bulge or to the disk. Ciardullo et al. Ciardullo et al. (1987) concluded that the novae were a bulge population and suggested that the binary central excess in M31 (novae, X-ray sources) could come from ejection from globular clusters. Aurière et al. Aurière et al. (1992) argued that actually all X-ray sources and novae in the bulge of M31 were sufficiently near globular clusters that they could have been ejected from. Shafter and Irby Shafter and Irby (2001) also support a main bulge origin though they cannot exclude a bulge fraction as low as 50%. On the other hand, Hatano et al. Hatano et al. (1997) propose that the M31 novae belong mainly to the disk population. They made a study of the positions of 191 novae observed at Mount Wilson and Asiago for which photometry at maximum was available, and used a model of extinction in order to interpret asymmetry along the minor axis. Studies of other systems show that young populations may be more efficient than old populations to produce novae. Now, it is classically considered that disk dominated galaxies produce more novae, which are brighter and with faster decline, than bulge dominated galaxies which produce fainter and slower ones Della Valle et al. (1994); Della Valle and Livio (1998). This scenario has population-synthesis code support Yungelson et al. (1997). Our sample of 12 novae candidates does not show any asymetric distribution along the minor axis of M31. However, it is to small to bring a significant contribution to the debate and it will be useful when joined to those from other M31 surveys.
6 Conclusions
We have presented the first catalogue of variable stars located in (or at least towards) the bulge of M31. The 1579 objects include 12 nova candidates, and mainly semi-periodic or periodic objects. Their magnitudes, colours and long period of variation suggest that our sample is dominated by a mixture of Long Period Variables (LPV) and type 2 Cepheid like variables (RV Tauri). The AGAPE data thus can address the question of the M31 bulge variable star population and particularly the nature of its bright component as well as its spatial distribution.
It is worth mentioning that both novae and the pulsating periodic variable stars are of cosmological interest as luminosity candles and distance calibrators. Also, the nova population is related to supersoft X-ray sources which may be progenitors of Type I supernovae. As to this aspect, we propose both the detection of two recurrent novae and the possible optical identification of two supersoft X-ray sources candidates observed with Chandra. This work will be complemented and extended using data from the new large field survey POINT-AGAPE performed with the Isaac Newton Telescope An et al. (2004).
Acknowledgements:
This research has made use of databases operated by CDS, Strasbourg, France.
References
- Alcock et al. (1998) Alcock, C., Allsman, R., Alves, D., et al.: 1998, AJ 115, 1921
- Alves et al. (1998) Alves, D., Alcock, C., Cook, K., et al.: 1998, Joint Discussion in 24, XXIII IAU General Assembly, astro-ph/9804003
- An et al. (2004) An, J., Evans, N., Hewett, P., et al.: 2004, astro-ph/0401374
- Ansari et al. (1997) Ansari, R., Aurière, M., Baillon, P., et al.: 1997, A&A 324, 843
- Arp (1956) Arp, H.: 1956, AJ 61, 15
- Aurière et al. (1992) Aurière, M., Coupinot, G., and Hecquet, J.: 1992, A&A 256, 95
- Baade and Swope (1963) Baade, W. and Swope, H.: 1963, AJ 68, 435
- Baade and Swope (1965) Baade, W. and Swope, H.: 1965, AJ 70, 212
- Barmby et al. (2002) Barmby, P., Perret, K. M., and Bridges, T. J.: 2002, Mon. Not. R. Astron. Soc. 329, 461
- Battistini et al. (1987) Battistini, P., Bonoli, F., Braccesi, A., et al.: 1987, A&AS 67, 447
- Bedding and Zijlstra (1998) Bedding, T. and Zijlstra, A.: 1998, ApJ 506, L47
- Capaccioli et al. (1989) Capaccioli, M., Della Valle, M., D’Onofrio, M., and Rosino, L.: 1989, AJ 97, 1622
- Ciardullo et al. (1987) Ciardullo, R., Ford, H., Neill, J., et al.: 1987, ApJ 318, 520
- Clayton and Feast (1969) Clayton, M. and Feast, M.: 1969, Mon. Not. R. Astron. Soc. 146, 411
- Crotts and Tomaney (1996) Crotts, A. and Tomaney, A.: 1996, ApJ 473, L87
- Crotts (1992) Crotts, A. P.: 1992, ApJ 399, L43
- Delaverny et al. (1997) Delaverny, P., Geoffray, H., Jorda, L., and Kopp, M.: 1997, A&AS 122, 415
- Della Valle and Livio (1995) Della Valle, M. and Livio, M.: 1995, ApJ 452, 704
- Della Valle and Livio (1998) Della Valle, M. and Livio, M.: 1998, ApJ 506, 818
- Della Valle et al. (1994) Della Valle, M., Rosino, L., Bianchini, A., and Livio, M.: 1994, A&A 287, 403
- Di Stefano et al. (2003) Di Stefano, R., Kong, A., Greiner, J., et al.: 2003, astro-ph/0306440
- Durlevich et al. (1996) Durlevich, O., Kazarovets, E., Kholopov, P., Kireeva, N., Samus, N., and Tsvetkova, T.: 1996, The new computer-readable version 1.1 of the General Catalogue of variable Stars, fourth edition, Vol.IV. The cross-identification tables. (as availbable at CDS)
- Freedman and Madore (1990) Freedman, W. and Madore, B.: 1990, ApJ 365, 186
- Habbing (1996) Habbing, H.: 1996, A&AR 7, 97
- Haiman et al. (1994) Haiman, Z., Magnier, E., Lewin, W., et al.: 1994, A&A 286, 725
- Hatano et al. (1997) Hatano, K., Branch, D., Fisher, A., and Starrfield, F.: 1997, ApJ 487, L45
- Hodge (1992) Hodge, P.: 1992, The Andromeda galaxy, Kluwer
- Hubble (1929) Hubble, E.: 1929, ApJ 69, 103
- Hughes and Wood (1990) Hughes, S. and Wood, P.: 1990, AJ 99, 784
- Kaaret (2002) Kaaret, P.: 2002, ApJ 578, 114
- Kahabka and van den Heuvel (1997) Kahabka, P. and van den Heuvel, E.: 1997, A.R.A.A. 35, 69
- Kaluzny et al. (1998) Kaluzny, J., Stanek, K., Krockenberger, M., Sasselov, D., Tonry, J., and Mateo, M.: 1998, AJ 115, 1016
- Kerins et al. (2001) Kerins, E. et al.: 2001, Mon. Not. R. Astron. Soc. 323, 13
- Kong et al. (2002) Kong, A., Garcia, M., Primini, F., et al.: 2002, ApJ 577, 738
- Kukarkin (1975) Kukarkin, B.: 1975, in Pulsating Stars, John Wiley and Sons, New-York
- Le Du (2000) Le Du, Y.: 2000, Thesis, Universite Paris VI
- Lebzelter et al. (2002) Lebzelter, T., Schultheis, M., and Melchior, A.: 2002, A&A 393, 573
- Magnier et al. (1997) Magnier, E., Augusteijn, T., Prins, S., van Paradijs, J., and Lewin, W.: 1997, A&AS 126, 401
- Magnier et al. (1992) Magnier, E., Lewin, W., van Paradijs, J., et al.: 1992, A&AS 96, 379
- Magnier et al. (1993) Magnier, E., Lewin, W., van Paradijs, J., et al.: 1993, A&A 272, 695
- Melchior et al. (2000a) Melchior, A., Hughes, S., and Guilbert, J.: 2000a, A&AS 145, 11
- Melchior et al. (2000b) Melchior, A., Viallefond, F., Guélin, M., and Neininger, N.: 2000b, Mon. Not. R. Astron. Soc. 312, L29
- Mennessier et al. (1997) Mennessier, M., Boughaleb, H., and Mattei, J.: 1997, A&AS 124, 143
- Mochejska et al. (2000) Mochejska, B. J., Macri, L. M., Sasselov, D. D., and Stanek, K. Z.: 2000, AJ 120, 810
- Nedialkov et al. (2002) Nedialkov, P., Orio, M., Birkle, K., et al.: 2002, A&A 389, 439
- Orio et al. (2001) Orio, M., Covington, J., and Ögelman, H.: 2001, A&A 373, 542
- Pritchet and van den Bergh (1987) Pritchet, C. and van den Bergh, S.: 1987, ApJ 316, 517
- Rich and Mould (1991) Rich, R. and Mould, J.: 1991, AJ 101, 1286
- Riffeser et al. (2001) Riffeser, A. et al.: 2001, A&A 379, 362
- Rosino et al. (1989) Rosino, L., Capaccioli, M., D’Onofrio, M., and Della Valle, M.: 1989, AJ 97, 83
- Scargle (1982) Scargle, J.: 1982, ApJ 263, 835
- Shafter and Irby (2001) Shafter, A. and Irby, B.: 2001, ApJ 563, 749
- Skrutskie et al. (1997) Skrutskie, M., Schneider, S., Stiening, R., et al.: 1997, The impact of Large Scale Near-IR Sky Surveys p. 25
- Stetson (1996) Stetson, P.: 1996, PASP 108, 851
- Thoraval et al. (1999) Thoraval, S., Boissé, P., and Duvert, G.: 1999, A&A 351, 1051
- Trudolyubov et al. (2001) Trudolyubov, S., Borozdin, K., and Priedhorsky, W.: 2001, ApJ 563, L119
- Wallerstein and Cox (1984) Wallerstein, G. and Cox, A.: 1984, PASP 96, 677
- Wirth et al. (1985) Wirth, A., Smarr, L., and Bruno, T.: 1985, ApJ 290, 140
- Yungelson et al. (1997) Yungelson, L., Livio, M., and Tutukov, A.: 1997, ApJ 481, 127