Photometry and the Metallicity Distribution of the Outer Halo of M31.
II. The 30 Kpc Field
Abstract
We present the results of a wide-field photometric study of the red-giant branch (RGB) stars in the outer halo of M31, in a field located 30 to 35 kpc from the center of the galaxy along the southeast minor axis. At this remote location, we find that RGB stars belonging to M31 are sparsely but definitely present, after statistical subtraction of field contamination. We derive the metallicity distribution (MDF) for the halo stars using interpolation within a standard grid of RGB evolutionary tracks. The halo MDF is quite broad but dominated by a moderately high-metallicity population peaking at [m/H], strikingly different from the [m/H] level which characterizes the outer halo of the Milky Way. However, the shape and peak metallicity for this region are entirely similar to those found in other studies for the inner regions of the M31 halo, particularly our previous study of a 20-kpc region (Durrell, Harris, & Pritchet 2001) employing similar data. In summary, we find no evidence for a metallicity gradient or systematic change in the MDF out to quite large distances in the M31 halo: it appears to be a homogeneous and moderately metal-rich subsystem of the galaxy at all locations. The star counts in the 30-kpc field are also consistent with the law that fits the interior regions of the M31 spheroid surface brightness profile. The metal-rich MDF and the spheroid suggests M31 more strongly resembles a giant elliptical galaxy than other, Milky-Way-like, spirals.
1 Introduction
The halos of galaxies provide us with a fossil record of the earliest processes of galaxy formation. However, studying the halo content is particularly difficult in disk and spiral galaxies, where the halos are sparsely populated when compared to their disk subsystems. Therefore observations of halos in disk galaxies require either extremely deep surface photometry studies (eg. Wu et al., 2002; Zibetti, White & Brinkmann, 2003), or photometric and kinematic studies of the individual stars, star clusters, or planetary nebulae that populate these halos. Only in the nearest galaxies can the latter method(s) be employed.
The halo of the spiral galaxy M31 provides us with a uniquely large, nearby, and readily accessible population of halo stars in a giant disk galaxy. It is near enough that photometry of its brightest red-giant branch (RGB) stars is easily carried out with 4-meter-class telescopes. Since the pioneering color-magnitude diagram (CMD) of M31’s halo stars by Mould & Kristian (1986), a large number of CMD-based studies have been carried out from the ground (Mould, 1986; Pritchet & van den Bergh, 1988; Christian & Heasley, 1991; Davidge, 1993; Durrell, Harris & Pritchet, 1994; Couture et al., 1995; Reitzel, Guhathakurta & Gould, 1998; Durrell, Harris & Pritchet, 2001; Ferguson et al., 2002) and using the Hubble Space Telescope (Holland, Fahlman & Richer, 1996; Rich et al., 1996a, b; Sarajedini & van Duyne, 2001; Bellazzini et al., 2003). These studies consistently show that the majority of M31 halo stars are redder than their MW counterparts, a difference usually attributed to higher metallicity. These studies (most of which are based on fields located at projected distances from to over 20 kpc from M31, and most lying near the SE minor axis of M31) find the mean metallicity for the M31 halo stars to be in the range [Fe/H] , showing remarkable consistency for datasets differing greatly in photometric depth, field size, and observed colors. Whether or not the mean halo [Fe/H] varies with radius is unclear, although van den Bergh & Pritchet (1992) suggested that a strong metallicity gradient does not exist in the inner halo, and recent studies in more remote fields suggest that this is indeed the case (Reitzel, Guhathakurta & Gould, 1998; Durrell, Harris & Pritchet, 2001; Ferguson et al., 2002). Furthermore, these studies show that the M31 halo stars cover a wide range of metallicity ([Fe/H]), a conclusion further confirmed by spectroscopic studies (Reitzel & Guhathakurta, 2002). For comparison, the MW halo is more metal-poor by nearly an order of magnitude in the mean ([Fe/H]; Ryan & Norris 1991).
In addition to the differences in the metallicity distribution functions (MDFs), the spatial density of halo stars in the MW follows a power law (Wetterer & McGraw, 1996; Ivezic et al., 2003), which differs from the profile of the M31 bulge/halo found by Pritchet & van den Bergh (1994), more like that of an elliptical galaxy. Interestingly, the MDF of the M31 halo shows remarkable similarities with that of the giant elliptical galaxy NGC 5128 and the compact elliptical M32 (Durrell, Harris & Pritchet, 2001; Harris & Harris, 2001, 2002); the high mean metallicity of the latter (Grillmair et al., 1996) has led to the suggestion that perhaps tidal disruption of M32 (eg. Choi, Guhathakurta & Johnston, 2002) has helped create the largely metal-rich M31 halo (Ferguson et al., 2002). There are a number of other scenarios envisioned for matching current observational results of the M31 halo, including a massive merger (Brown et al., 2003), formation via accretion of smaller, stellar fragments (Côté et al., 2000), and in situ star formation from the agglomeration of smaller, primarily gas-rich objects (Durrell, Harris & Pritchet, 2001).
Recently, there have been exciting new revelations on the structure of the M31 halo. Ibata et al. (2001) have reported the detection of a large stream of metal-rich stars SE of M31 in their wide-field survey, and Ferguson et al. (2002) showed that there is more complex substructure in the halo and outer disk regions of M31. Morrison et al. (2003) and Zucker et al. (2004) have also found evidence for additional tidally disrupted satellite galaxies in the M31 halo. In an observational tour de force, Brown et al. (2003) have created an extremely deep HST-based CMD of the M31 halo about 11 kpc from the nucleus, and have confirmed the basic results of previous work (largely metal-rich halo, fewer metal-poor stars). However, they also deduce that the metal-rich stars may be a few Gyr younger than that of the (old) metal-poor stars and suggest that this age difference originates from a major merger 6-10 Gyr ago (the metal-rich population requiring incorporation of a rather massive galaxy). These are all interesting possibilities that require further study, and indicate that the M31 halo is not simply a homogeneous, coeval population of metal-rich stars.
2 Observations + Data Reduction
In our first paper (Durrell et al 2001; hereafter Paper I), we described photometry for over 2000 RGB halo stars in a halo field located about 20 kpc from M31 along the southeast minor axis. We found that the MDF at this projected location is, like the inner halo, still strongly weighted towards more metal-rich stars with a major peak in the MDF at [Fe/H]. The MDF also has a well populated tail extending to lower metallicities, making the entire distribution extremely broad.111We note that the metallicities in Paper I and this paper are typically quoted as [m/H], where [Fe/H] [m/H] 0.3 [assuming an enhanced [O/Fe]=]. In the discussion of Paper I we suggested that the entire halo MDF could be matched by a classic “simple model” of chemical evolution with wind-driven mass loss, and could be explained by a formation scenario where much of the M31 halo formed though the accretion of primarily gas-rich fragments.
In the present paper, we describe new results for a field located kpc from M31 also along the SE minor axis, and create the first clearly defined halo222The G1 field studied by Rich et al. (1996a) and Bellazzini et al. (2003) is located kpc from M31’s nucleus, but it is clear this area is contaminated by disk stars, and may also have tidal streams/features (eg. Reitzel, Guhathakurta & Rich, 2003; Rich et al., 2004). This field does not represent a ‘clean’ halo field at kpc. MDF at such a large distance from M31.
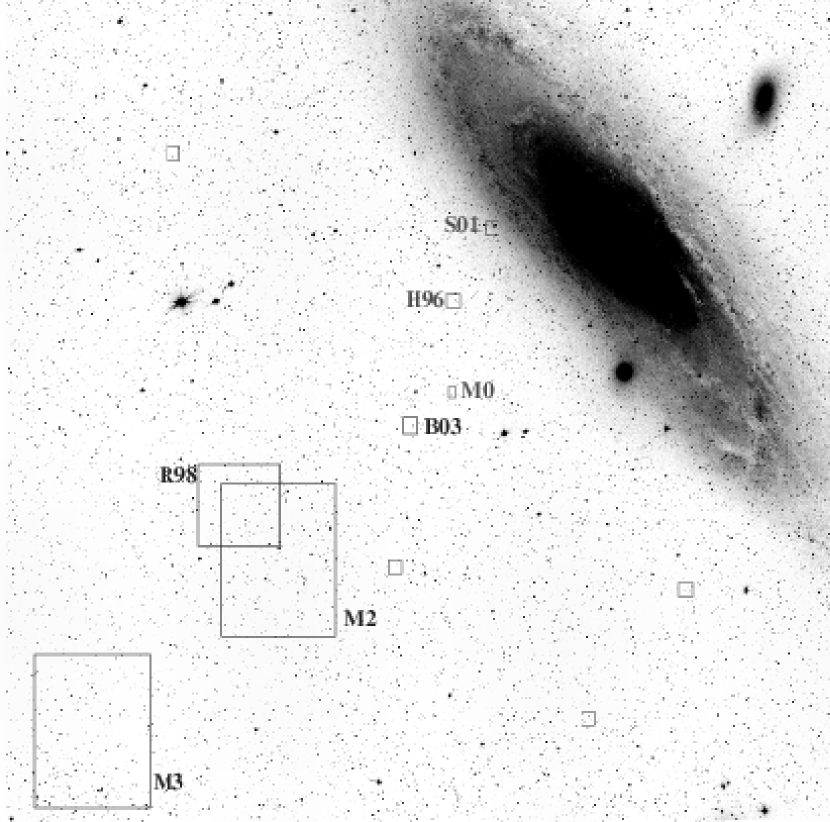
The observations we present here are of a single field centered at , , the field referred to as by Pritchet & van den Bergh (1994). We used the UH8K camera at the Canada-France-Hawaii Telescope (CFHT) on Sept. 19, 1996 to acquire the data, during the same observing run from which our Paper I observations were obtained. The UH8K camera (now decommissioned) was an 8-CCD mosaic camera with a total imaging area of 81922 pixels or 281 281 (scale = 0206 per pixel). One of the chips (chip 4) showed considerable bleeding and other inherent structure, and the low QE of chip 6 also proved to make it of little use for our purposes. We have thus used the remaining 6 chips (covering an area of 21′ x 28′ on the sky) for all subsequent analysis. The center of our field is located 22 SE of the M31 nucleus along the minor axis, or at a projected distance of kpc from M31, assuming kpc for M31 (Holland, 1998; Durrell, Harris & Pritchet, 2001); the entire field samples stars located from 190 to 25 (27 to 35 kpc) from M31. The location of the field is plotted in Figure 1, which also illustrates the fields from other recent M31 halo studies (including our [20 kpc] field from Paper I). Our field is located just within the outer extent of the M31 halo survey of Ibata et al. (2001).
2.1 Calibration and Pre-processing
Our science images of the field were obtained under non-photometric conditions, although shorter exposure images of the field were taken on the (photometric) night of Sept. 21, 1996 during the same observing run which we could use to calibrate our data. The photometry was calibrated through Landolt (1992) standards observed during the entire observing run (Sept 19-23, 1996). The calibration equations were derived for stars on a single chip (chip 1) of the UH8K Mosaic, and zeropoint shifts (, ) were derived to make the appropriate corrections to the and magnitudes measured on the other chips (a detailed description can be found in paper I):
| (1) |
| (2) |
Here is the mean airmass (the airmass terms are adopted values from Landolt 1992), and are the zeropoint values derived for chip 1, and and are the instrumental aperture magnitudes for chip , as measured through an aperture radius of 3.3′′ and normalized to an exposure time of 1 second. The rms scatter of the standard stars in each of the calibration equations was 0.018 – 0.027 magnitudes.
As with the previous data presented in Paper I (the inner field and a very remote background field ), the exposure times were 4 900s in and 3 900s in , with seeing on most individual images of 08 to 10 (FWHM).
The program images were pre-processed with bias frames, dark frames and flat-fields, and then combined in the normal manner through IRAF333IRAF is distributed by the National Optical Astronomy Observatories, which are operated by the Association of Universities for Research in Astronomy, Inc., under cooperative agreement with the National Science Foundation. tools. Flat fielding was carried out on the individual chips, using either a combined ‘superflat’ or a twilight flat that had been further corrected using a heavily smoothed superflat. The resulting images had uniform background intensities to less than . The individual CCD images were re-registered, scaled and averaged to construct a single combined image for each chip in each filter. The FWHM of the stellar images in all of the final, combined images was 090 for the images, and 095 for the images.
2.2 Photometry and Image Classification
Photometry of the objects on each combined image was performed with the stand-alone versions of the DAOPHOT II / ALLSTAR packages (Stetson, 1987; Stetson, Davis & Crabtree, 1990; Stetson, 1992). A single pass of DAOPHOT II ALLSTAR with a 3.5 detection threshold was adopted, since tests showed that a second pass of DAOPHOT II did not add noticeably to the number of objects detected on these relatively uncrowded fields. A stellar point-spread-function (PSF) was derived from 17 to 32 bright, uncrowded stars per image. A constant PSF was found to adequately fit the data on all images.
We are only interested in objects on the images with stellar appearance, so any resolved background galaxies that were not already ignored by DAOPHOT II were subsequently removed with a combination of image parameters: the DAOPHOT parameter (Stetson, 1987), and the image moment from Kron (1980) and Harris et al. (1991)444We add that we did not use one of the image classifiers utilized in Paper I, namely (the difference between the PSF and aperture magnitudes), because it eliminated few objects that were not already rejected through either DAOPHOT or .. All objects exceeding either or were considered to be non-stellar and rejected from further analysis. We used artificial-star experiments (see below) to set the classification boundaries and to confirm that few genuinely stellar objects were rejected.
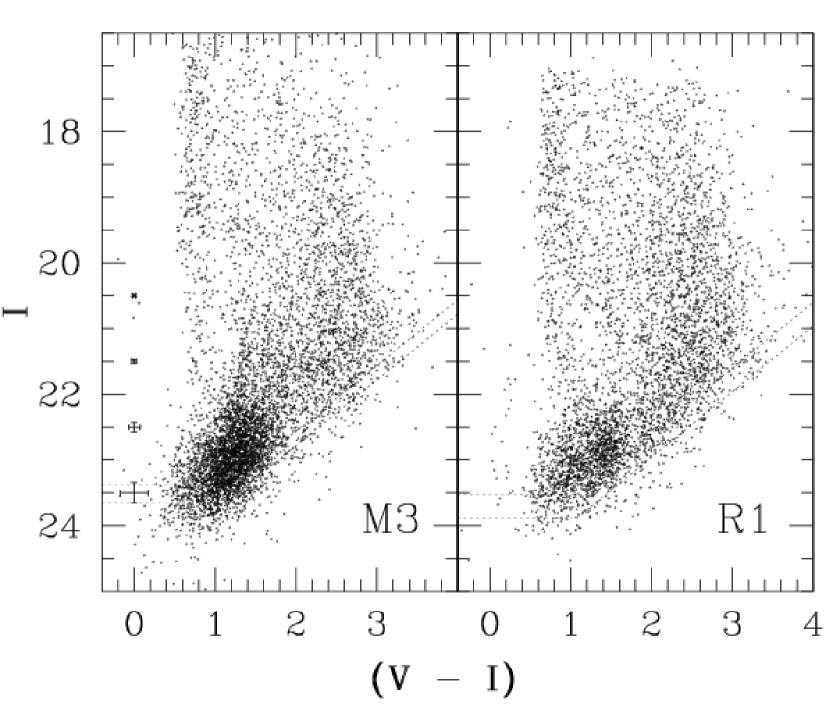
3 Color-Magnitude Diagram
The separate and lists of stellar objects from each chip were merged with a matching radius of 1 pixel, and then used to create color-magnitude diagrams for each. The CMD of the entire field (all 6 CCDs) is plotted in Figure 2, along with the background field for comparison. We note that the CMDs from the individual mosaic chips have slightly different photometric completeness limits (see next section) due to small QE differences, and we show the extreme values for these limits in Figure 2. Typical errorbars (derived from the artificial star experiments; see below) for stars with are also plotted.
3.1 Have We Detected the RGB Population?
There are a total of 6292 starlike objects in the CMD, roughly more than present in the background field (4648 stars; paper I). Over the nearly 550 arcmin2 in each field, the density of stars is thus quite uncrowded in an absolute sense. The usable field size of the field is 546 arcmin2, almost exactly the same size as the background field, so roughly one-third of the stars in our outer-halo field should be M31 halo stars. Most of the brighter () objects are foreground Milky Way halo stars, and most of the fainter, bluer objects are unresolved background galaxies.
We have performed a series of tests to confirm that we are indeed detecting the M31 halo this far from the galaxy center. First, we define a box within the CMD () within which we expect the upper part of the M31 RGB to be present, and simply count the numbers of stars in each of our program fields that lie within that box. For , there are 1034 such stars (assumed to be entirely background contamination); for , there are 1603 stars; and for – our field from Paper I – there are 3312 stars. Since this part of the CMD is bright enough and blue enough that all three fields should have similar photometric limits and high completeness, we can use these totals to make rough estimates of the statistical significance of the RGB detection. From the count statistics (and for the moment ignoring slight differences in the foreground reddening of each field; see below), we then estimate that we detect upper-RGB stars in field , and in the mid-halo field . This test is suggestive that we are detecting the RGB at high significance, even though the background contamination is larger than the RGB “signal” in . A more rigorous version of the field subtraction is done below.
A slightly more advanced test is to ask whether this excess residual population follows the luminosity function (LF) that would be expected for a true RGB. We have constructed a smoothed LF of the residual population in the same way as we did in Paper I. The result is shown in Figure 3. Here we use a smoothing kernel of 0.03 mag, and to remove some of the most obvious background contamination brighter than the RGB tip, we exclude stars with bluer than or redder than (again, the same procedure we used for field . The residual LF is noisier than we found in Paper I, but there is a clear excess of stellar objects fainter than with numbers rising towards fainter magnitudes in just the same way as we found in Paper I (see for comparison Fig.6 in that paper). Brighter than this level, the background population subtracts cleanly away with no significant residuals. The field passes the LF consistency test.
As a third test, we have also performed a one-by-one statistical subtraction of background stars from the CMD. To do this, we take each star in the CMD list and calculate the “separation radius” to every star in the list as . If any star in has mag, then both it and its matching object in are flagged and removed from the lists. In this way we match up stars within a fairly narrow range in color but a more generous range in magnitude (the distance, i.e. apparent magnitude, of the background star is less important for this purpose than its color, i.e. population type). This process is continued until every star in has been tried.
In Figure 4 we show, first, the CMD for the remaining unmatched stars, and second, the CMD of all the matched stars. By hypothesis, the first of these two CMDs should be a nearly pure RGB population from the M31 halo, while the second CMD should be a nearly pure background population (and should resemble the original CMD of the field, from Fig. 2). In Fig. 4a, an RGB stands out clearly in the expected region of the CMD, while other areas have almost entirely subtracted away. While this residual “signal” is much smaller than the population we found in the (20 kpc) field, features of the M31 halo RGB are still clear, such as the blue ‘edge’ of stars at and , which are the most metal-poor ([Fe/H]) M31 halo stars.
This statistically cleaned CMD does not take into account slight place-to-place differences in limiting magnitude or photometric completeness, and so we do not use it to do any direct analyses of the metallicity distribution or number counts. However, we regard it as a very strong test of the genuine presence of the M31 halo in our outer field.
3.2 Artificial Star Experiments
The photometric completeness of a star in the CMD is a function of , , and also location within the CCD mosaic because of chip-to-chip differences in QE within the array. Here, is defined as , where is the total number of stars added to the science images with a particular value of , and is the total number of those stars that are recovered, regardless of where they were found on the CMD.
To trace the completeness function behavior, we performed a series of artificial-star experiments on each chip. These tests are the same as those carried out in Paper I for other fields in our survey. A total of 40000 stars (10 runs of 4000 total stars added per run) were added to the star-subtracted science images for each chip. The stars had discrete input magnitudes and colors sampled at 0.5 magnitude intervals in the grid (, ). The simulated images were then reduced in precisely the same way as described above – a single pass of DAOPHOT II/ALLSTAR, merging of the resulting and datasets, and removal of non-stellar images using the image-classification algorithm. The number of stars added was similar to those found on the original science frames, indicating that we have adequately re-created the rather low crowding conditions on the frames.
The limiting magnitudes (; defined as the 50% completeness level) for each individual chip were derived by fitting the interpolation function (see Fleming et al., 1995) :
| (3) |
where is a parameter that measures the rate of decline of at . The values for and for each chip are listed in Table 1. Our results can be compared directly to those obtained in Paper I for the other fields in our survey; the limits of our data are comparable to that of the background field, but different from the interior field (the limits are mag brighter in , and deeper in ). These differences are due to the sky conditions; our data had better overall seeing (07 vs. 09), but much brighter sky conditions for the images.
Each star observed in our CMD (Figure 2) was then assigned a value of based on linear interpolation between the grid points from the artificial star results from the chip the star was measured on; it is these values that are used to derived corrected number counts for our MDF analyses below.
3.3 Reddening
In Paper I, the appropriate total reddening for the and fields was directly determined from the location of the blue edge of the foreground Milky Way halo population in the CMDs. In Figure 5 we have matched the color histogram of all stars with (all, presumably, foreground Milky Way halo stars) in the CMD with the derived blue edge of the field at . To match the histograms, we need to shift the data 0.03 mag to the red, suggesting for this field (where we have assumed an error of 0.02 mag on the color difference). This observed difference is due to the (slightly) higher galactic latitude of the field, but is also affected by the uncertainties ( mag) in the photometric color zeropoint; the latter is likely the dominant factor. This result is in excellent agreement with the predicted value () we find from the maps of Schlegel, Finkbeiner & Davis (1998). In addition, by adopting this empirical approach to deriving for a given field, we effectively remove any systematic errors resulting from field-to-field color calibration differences.
4 Analysis
4.1 Metallicity Distribution Function
In order to construct a metallicity distribution function (MDF) from our CMD, we need to assume an age distribution for the halo stars. To do so, we have assumed that all the halo stars are comparably old, so that by hypothesis the locations of the RGB loci are determined primarily by metallicity. While this may seem at odds with the finding of a intermediate-age M31 halo population by Brown et al. (2003), we note that this result (derived for a field located kpc from M31) may not be applicable to our much more remote halo fields. More importantly, the locus of the intrinsic RGB is insensitive to age for stellar populations that are already old, and thus any large spread in RGB location is most likely to be due to metallicity differences. In a more practical direction, since our data do not reach the fainter but more age-sensitive regions of the CMD (the horizontal branch and main-sequence turnoff), they cannot be used to investigate the age distribution of the M31 halo without a priori knowledge of the stellar metallicities that the RGB gives us to first order. Here, we simply assume the same age distribution (effectively, the same set of fiducial RGB tracks) as used in Paper I so that we can make the most direct possible comparison between the two fields. Clearly, in future it would be of great interest to find out if the inner-halo age spread found by Brown et al. (2003) persists into the outer halo, but even an age range of Gyr would not strongly affect the MDF deduced from the RGB; for a star of a given color, changing the age from 12 to 5 Gyr would increase the derived metallicity by dex (e.g. Harris, Harris & Poole, 1999).
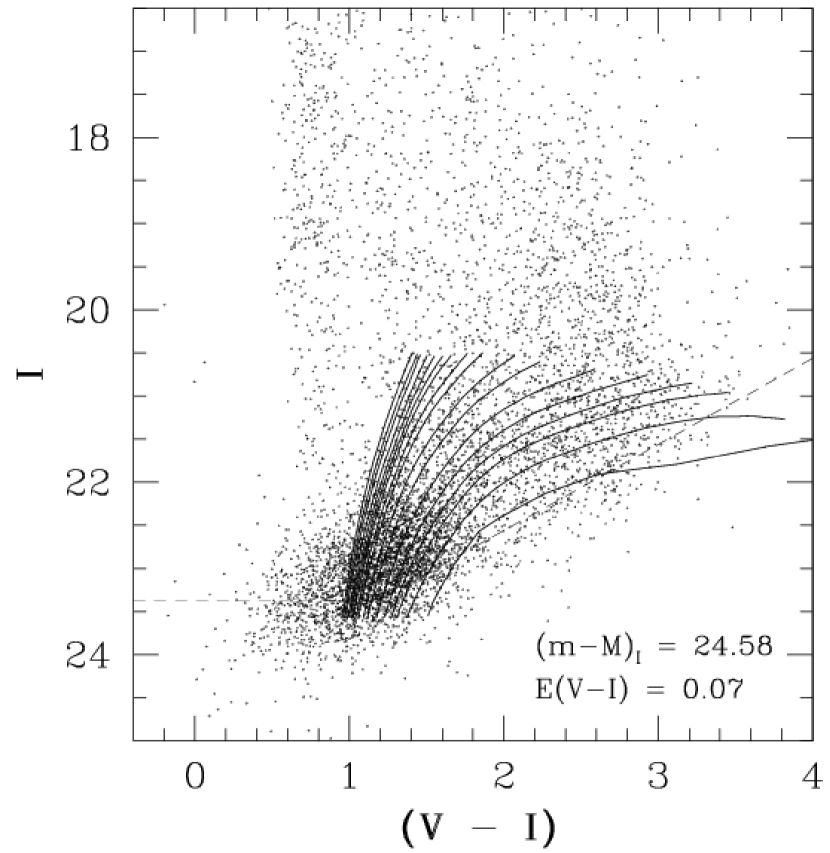
In practice, we use stars in the brightest two magnitudes of the RGB and a grid of fiducial RGB model tracks to estimate the abundance [m/H] of each star (defined as [m/H] = log(), where we adopt as in Harris & Harris 2000 and paper I). For consistency with previous work, we use the evolutionary tracks for 0.8 red giants by VandenBerg et al. (2000), calibrated to colors and normalized to standard Milky Way globular cluster fiducial sequences as discussed in more detail by Harris & Harris (2002). To extend the VandenBerg et al. (2000) grid to the most metal-rich stars ([m/H] ) we use empirical tracks from two metal-rich star clusters (NGC 6553, 6791) as discussed in Harris & Harris (2002).
In Figure 6 we have re-plotted the CMD, overlaid with the model evolutionary tracks. The model grid was shifted by the M31 distance moduli ( and ) and reddenings ( and ) for the and fields, respectively (see Fig. 8 of Paper I for the CMD of the background with superimposed tracks. The excess population of RGB stars in the field at intermediate colors and fainter than is evident; eg. Figure 2).
For each star in the and CMDs fainter than the RGB tip () we first derive and , and then interpolate within the model grid in the () plane to estimate the heavy-element abundance (and [m/H]). Then, to construct the MDF, we use all stars in the range 555Our faint-end cutoff at is slightly brighter than that adopted for the field in paper I because of the limiting-magnitude differences discussed above. to minimize the effects of photometric spread in the band and the rather large contribution of blue objects (likely faint, unresolved galaxies) fainter than .
Finally, the incompleteness-corrected number of stars (where was derived for 0.1-dex metallicity bins, and the cleaned MDF of our field was constructed by simply subtracting the background MDF of from the raw MDF. This final MDF is plotted in Figure 7 and listed in the first 2 columns of Table 2. The quoted uncertainties in each metallicity bin are the Poisson errors in the background-subtracted totals (). In Fig. 7, we also plot representative errorbars in the derived metallicities that would be generated solely by measurement uncertainties in . At the blue (extreme metal-poor) end of the distribution, the RGB tracks change very little with metallicity, and even small color errors unavoidably translate to a large spread in metal abundance.
Nominally, the deeper limit of the 30 kpc field (compared to that of the 20 kpc field) should allow us to quantify our MDF to slightly higher metallicities, since it is the band that determines the MDF limit for the extremely red stars with Solar metallicities and above. However, there appear to be very few such stars in the sample in any case (see also the HST studies by Holland, Fahlman & Richer, 1996; Rich et al., 1996a; Brown et al., 2003), and their small numbers are additionally uncertain because of the background contamination. We thus restrict our MDF to sub-Solar metallicities.
4.2 Comparison with 20 kpc field
Inspection of Figure 7 shows that the M31 outer-halo stars span a wide range in metal abundance ([m/H]). The MDF as a whole is predominantly metal-rich (peaking around [m/H]) but has a significant metal-poor tail (perhaps with a secondary peak at [m/H]). The median metallicity of the entire MDF is [m/H] or [Fe/H]. All these features are closely similar to those from the 20 kpc field of Paper I.
Since the publication of paper I, the fiducial sequences for the metal-rich end of the distribution have been refined somewhat (Harris & Harris, 2002), and we have also made minor changes to our bilinear interpolation routines. Accordingly, to make the two MDFs as strictly comparable as possible, we have re-created the MDF using the new interpolation routine and exactly the same range in as used above for the field. This revised MDF is listed in Table 2 and plotted in Figure 8, along with the original MDF from paper I. As expected, the MDF is virtually identical (after allowing for a different number of stars as a result of the more conservative magnitude range adopted here), showing that the modifications have no significant effect on the discussion from Paper I.
We show our final direct comparison between the 20 kpc and 30 kpc fields in Figure 9. Here, the number of stars has been multiplied by a factor of 0.23 to normalize both fields to the same effective population. It is evident that little difference exists between the two MDFs. A formal test over the range [m/H] indicates that they are similar at the 27% confidence level. In fact, any formal statistical difference is almost entirely due to the relative excess of stars in only 2 of the 21 bins (each of which in turn is based on a very small number of stars). For all the other bins, the error bars of the two MDFs mutually overlap.
4.3 Spatial Distribution
A by-product of our MDF comparison is a limited investigation of the radial profile of the outer M31 halo. Pritchet & van den Bergh (1994, hereafter PvdB94) combined measurements from various sources to construct the surface brightness profile of the M31 halo, finding that the profile could be fit by an r1/4 law from 0.2 to 20 kpc. The outer halo alone could be approximated by a steep power law (stellar volume density to r-5). As we have not independently derived the absolute values of from our data (such an analysis is beyond the scope of this paper), we limit ourselves to a deriving the relative number densities for the and fields.
The magnitude range for the stars in both MDFs is similar, so the normalization of the MDFs should directly yield the relative number density. The total background-corrected number counts in each MDF (up to [m/H]) in Table 2 are and , making the number ratio . Converted to a surface brightness ratio, this means the field is magnitudes fainter than . If we adopt the (admittedly uncertain) surface brightness of for the 20 kpc field from PvdB94, this suggests the observed surface brightness of our 30 kpc field is . This shows the advantage (and in fact, the necessity) of using a large field size to detect extremely low surface brightness through direct starcounts; in the small fields used by PvdB94, the M31 halo RGB was barely detected in the field, and only an upper limit for could be derived (, consistent with our new result).
Assuming the law profile from PvdB94 and a minor axis effective radius of 1.4 kpc (we have scaled the kpc value from PvdB94 for a distance of 780 kpc), we predict in the range 4.7 to 5.6 (assuming an error of in and an error of kpc in the centers of the kpc and kpc bins). Thus the stellar density in the field is consistent with the M31 spheroid continuing as an profile out to at least kpc.
Similarly, we can derive the stellar surface density decrease from kpc to kpc as a power law, from which we derive , or a volume stellar density ; these numbers are, again, consistent with power law values derived by PvdB94 for kpc. Note, however, that we are unable to discriminate between the two different profiles with our results. Studies of the stellar density of stars in fields at still larger radii will be required to fully address this issue (e.g. J. Ostheimer et al., in preparation).
5 Discussion
The primary results from our analysis are that
(a) the outer halo of M31 is predominantly broad and metal-rich to arbitrarily large galactocentric distances, and
(b) the outer halo shows little or no radial metallicity gradient.
In turn, our observed MDFs are (for the most part) very similar to those found by other researchers in more interior fields (Durrell, Harris & Pritchet, 1994; Holland, Fahlman & Richer, 1996; Rich et al., 1996a; Reitzel, Guhathakurta & Gould, 1998; Bellazzini et al., 2003; Brown et al., 2003). This statement does not contradict the recent findings of significant substructure in the M31 halo (Ferguson et al., 2002; Morrison et al., 2003; Zucker et al., 2004), as many of the halo fields are not located near the stream and warped disk features found in the Ibata et al. (2001) survey. It appears therefore that many of the MDF studies to date have been sampling the ‘typical halo’ of M31. The contributions of accretion of satellite galaxies do, however, appear to be an important (although not necessarily the most dominant) factor, based on the recent studies of Ibata et al. (2001) and Ferguson et al. (2002) and the presence of a significant “tail” of metal-poor stars in the MDFs we measure.
The MDF that we and other authors find for the M31 halo, to very large galactocentric distances, gives no indication that it has a classic Milky-Way-like metal-poor halo dominating anywhere. Bellazzini et al. (2003) find that a more metal-rich bulge population begins clearly within kpc, but at larger radii they see no significant increase in the relative size of the metal-poor population out to kpc. Our work now extends this limit to almost 35 kpc. The combined data make it plausible to suggest that M31 is surrounded by a predominantly metal-rich, r1/4 spheroid, not unlike the outer parts of giant elliptical galaxies.
As noted above, we did not assume the age distribution derived for an inner-halo 11 kpc field by Brown et al. (2003). In their study, they find that the metal-poor population is classically “old” (like Milky Way globular clusters), but the more metal-rich population is of intermediate age ( Gyr). Including some version of this age-vs.-metallicity gradient in our analysis would clearly yield a modified MDF which would be still broader and extend to still higher maximum metallicity, though not in a major way (slightly lower age would require higher [m/H] to yield the same color).
Deep enough photometry to reach the main sequence turnoff is as yet available for only this one M31 field, and so it is currently unknown if such a younger stellar population is present at the much larger halo distances that we have sampled. Possibilities exist that the Brown et al. (2003) sample may include some contamination from a disk population (Rich et al., 2004), or from another stellar stream (Guhathakurta & Reitzel, 2002), or something akin to a M31 ‘thick-disk’ population (Wyse & Gilmore, 1988; Wyse, 2002). However, it should be noted that the Brown et al. (2003) field is located further from the M31 nucleus than those of some other studies (eg. Durrell, Harris & Pritchet, 1994; Bellazzini et al., 2003) which found an MDF from the red giants that is very similar to that found in our distant fields (see Brown 2003 for a similar discussion). Furthermore, none of these MDFs show the additional very red population observed by Sarajedini & van Duyne (2001) which clearly could be sampling a thick disk (see Figure 1). In addition, Brown (2003) has shown that even a warped M31 disk cannot explain the large fraction of intermediate-age stars in their study.
The kinematics of these stellar populations in the outer environs of M31 will be of extreme importance in finally determining their true nature. If the flattened M31 ‘halo’ (clearly shown in the maps of Ibata et al. (2001) and Ferguson et al. (2002)) is rotation-dominated, it would not be like any thick disk currently known. Hurley-Keller et al. (2004) have performed a kinematical study of the planetary nebulae in the outer regions of M31, and clearly show that the outer parts of the M31 bulge (the same region that we have called ‘halo’ in this paper) are indeed rotating. This is suggestive of either a dominant ‘bulge’ population (if a kinematically distinct [more metal-poor?] population does exist), or at the very least a rotating metal-rich ‘spheroid’ (but not a ‘thick-disk’) population. In addition to this, the outer halos of some giant ellipticals have significant rotation signatures (Côté et al., 2001, 2003; Peng, Ford & Freeman, 2004a, b). For all of the differences between the M31 and Milky Way halos emphasized above, the Milky Way may also have a somewhat flattened outer stellar halo (eg. Morrison et al., 2000; Yanny et al., 2000; Chen et al., 2001; Siegel et al., 2002, and references within).
We found in Paper I that the observed MDF of our 20-kpc field could be well matched by a single-zone simple chemical evolution model with a numerical ‘yield’ . Though this effective nucleosynthetic yield is more than 5 times larger than the best-fit value for the Milky Way halo, it is still low enough to suggest that almost half the original gas in the region was ejected or unused in the rounds of star formation which formed these stars. By inference, we can make the same suggestion about the 30 kpc field MDF since it is virtually identical. Whether the ‘proto-M31’ region was created from many dwarf-sized fragments coming together, or the merging of a few larger, more massive gaseous protogalaxies cannot be told from these simple chemical models.
Other mechanisms to form metal-rich spheroid populations have also been explored. In the dissipationless-accretion model of Côté et al. (2000), the MDF of the halo is generated from multiple accretions of satellites which have already formed most of their stars, although the mass spectrum of such satellite dwarf galaxies would be required to be strongly weighted towards the high-mass end if the MDF is as metal-rich as we see in M31 and in large ellipticals (Harris & Harris, 2001). By contrast, Beasley et al. (2003) use CDM-based hierarchical merging models of gaseous fragments to construct MDFs that are typically broad and metal-rich, closely resembling what we see in M31 or (e.g.) NGC 5128. In this model, the sequence of mergers typically continues for a few Gyr and so the metal-richer population can easily be younger by a few Gyr than the first, metal-poor population. Lastly, Bekki, Harris & Harris (2003) explored the possibility that the merger of two disk galaxies could explain the NGC 5128 halo MDF, and further suggested that the M31 halo could have formed via a similar route. In this latter model, the stars now in the halo originated in the moderately metal-rich progenitor disks before the merger. An advantage of this disk-merger model is that is can easily explain the fact that the MDF of the globular clusters in the merged galaxy is different from the halo-star MDF (the metal-poor clusters were the ones already present in the progenitor galaxies, while most of the metal-richer ones formed in the merger). On the other hand, its disadvantages are that it predicts a modest halo metallicity gradient (which we do not see in M31), and it does not yet address the necessary later “reconstruction” of a major disk in M31.
In summary, at present there are a variety of possible modelling approaches capable of generating the rather metal-rich halo MDFs that are now realized to be common in large galaxies. However, the strong similarities of the halo MDFs to date, the presence of metallicity gradients in the inner spheroids, the small metal-poor population at any radius, and the spheroid luminosity-metallicity correlation (Rich, 2004) all suggest that stellar satellite accretion is not the dominant factor in spheroid formation for many galaxies.
6 Summary
We have presented photometry of the M31 halo within a field located 30 kpc from the galaxy center along the SE minor axis. Using careful object classification and statistical removal of background contamination, we have been able to isolate a sample of a few hundred M31 halo red giants. We derive the photometric metallicity distribution function for this outer M31 halo, and find that it is virtually identical with the MDF from our previously studied 20-kpc field: the implication is that the MDF throughout the halo is broad, moderately metal-rich (peaking at [m/H] ), and has no systematic radial gradient. We also find that the M31 halo has a steep radial density profile: the elliptical-like profile determined previously from data at at smaller radii continues on outward through our 30-kpc field.
References
- Beasley et al. (2003) Beasley, M.A., Harris, W.E., Harris, G.L.H., & Forbes, D.A. 2003, MNRAS, 340, 341
- Bekki, Harris & Harris (2003) Bekki, K., Harris, W.E., & Harris, G.L.H. 2003, MNRAS, 338, 587
- Bellazzini et al. (2003) Bellazzini, M., Cacciari, C., Federici, L., Fusi Pecci, F., & Rich, M. 2003, A&A, 405, 867
- Bertelli et al. (1994) Bertelli, G., Bressan, A., Chiosi, C., Fagotto, F., & Nasi, E. 1994, A&AS, 106, 275
- Brown (2003) Brown, T. 2003, in The Local Group as an Astrophysical Laboratory, ed. M. Livio (Cambridge University Press), in press (astro-ph/0308298)
- Brown et al. (2003) Brown, T.M., Ferguson, H.C., Smith, E., Kimble, R.A., Sweigart, A.V., Renzini, A., Rich, R.M., & VandenBerg, D.A. 2003, ApJ, 592, 17
- Chen et al. (2001) Chen, B., et al. 2001, ApJ, 553, 184
- Choi, Guhathakurta & Johnston (2002) Choi, P.I., Guhathakurta, P., & Johnston, K.V. 2002, AJ, 124, 310
- Christian & Heasley (1991) Christian, C.A., & Heasley, J.N. 1991, AJ, 101, 848
- Côté et al. (2000) Côté, P., Marzke, R.O., West, M.J., & Minniti, D. 2000, ApJ, 533, 869
- Côté et al. (2001) Côté, P., et al. 2001, ApJ, 559, 828
- Côté et al. (2003) Côté, P., McLaughlin, D.E., Cohen, J.G., & Blakeslee, J.P. 2003, ApJ, 591, 850
- Couture et al. (1995) Couture, J., Racine, R., Harris, W.E., & Holland, S. 1995, AJ, 109, 2050
- Davidge (1993) Davidge, T. 1993, ApJ, 409, 190
- Durrell, Harris & Pritchet (1994) Durrell, P.R., Harris, W.E., & Pritchet, C.J. 1994, AJ, 108, 2114
- Durrell, Harris & Pritchet (2001) Durrell, P.R., Harris, W.E., & Pritchet, C.J. 2001, AJ, 121, 2557 (Paper I)
- Ferguson et al. (2002) Ferguson, A.M.N., Irwin, M.J., Ibata, R.A., Lewis, G.F., & Tanvir, N.R. 2002, AJ, 124, 1452
- Fleming et al. (1995) Fleming, D.E.B., Harris, W.E., Pritchet, C.J., & Hanes, D.A. 1995, AJ, 109, 1044
- Grillmair et al. (1996) Grillmair, C.J., et al. 1996, AJ, 112, 1975
- Guhathakurta & Reitzel (2002) Guhathakurta, P., & Reitzel, D.B. 2002, BAAS, 34, 1120
- Harris, Harris & Poole (1999) Harris, G.L.H., Harris, W.E., & Poole, G.B. 1999, AJ, 117, 855
- Harris & Harris (2000) Harris, G.L.H., & Harris, W.E. 2000, AJ, 120, 2423
- Harris & Harris (2001) Harris, W.E., & Harris, G.L.H. 2001, AJ, 122, 3065
- Harris & Harris (2002) Harris, W.E., & Harris, G.L.H. 2002, AJ, 123, 3108
- Harris et al. (1991) Harris, W.E., Allwright, J.W.B., Pritchet, C.J., & van den Bergh, S. 1991, ApJS, 76, 115
- Holland (1998) Holland, S. 1998, AJ, 115, 1916
- Holland, Fahlman & Richer (1996) Holland, S., Fahlman, G.G., & Richer, H.B. 1996, AJ, 112, 1035
- Hurley-Keller et al. (2004) Hurley-Keller, D., Morrison, H.L., Harding, P., & Jacoby, G.H. 2004, ApJ, submitted
- Ibata et al. (2001) Ibata, R., Irwin, M., Lewis, G., Ferguson, A.M.N., & Tanvir, N. 2001, Nature, 412, 49
- Ivezic et al. (2003) Ivezic, Z., et al. 2003, in ASP Conf. Ser., Milky Way Surveys : The Structure and Evolution of Our Galaxy, ed. D. Clemens, T. Brainerd & R. Shah (San Francisco:ASP),in press (astro-ph/0309074)
- Kron (1980) Kron, R.G. 1980, ApJS, 43, 305
- Landolt (1992) Landolt, A.U. 1992, AJ, 104, 340
- Morrison et al. (2000) Morrison, H.L., Mateo, M., Olszewski, E.W., Harding, P., Dohm-Palmer, R. C., Freeman, K.C., Norris, J.E., Morita, M. 2000, AJ, 119, 2254
- Morrison et al. (2003) Morrison, H.L., Harding, P., Hurley-Keller, D., & Jacoby, G. 2003, ApJ, 596, 183
- Mould (1986) Mould, J. 1986, in Stellar Populations, ed. C.A.Norman, A.Renzini, & M.Tosi (Cambridge: Cambridge University Press), 9
- Mould & Kristian (1986) Mould, J., & Kristian, J. 1986, ApJ, 305, 591
- Peng, Ford & Freeman (2004a) Peng, E.W., Ford, H.C., & Freeman, K.C. 2004a, ApJ, 602, 685
- Peng, Ford & Freeman (2004b) Peng, E.W., Ford, H.C., & Freeman, K.C. 2004b, ApJ, 602, 705
- Pritchet & van den Bergh (1988) Pritchet, C.J., & van den Bergh, S. 1988, ApJ, 331, 135
- Pritchet & van den Bergh (1994) Pritchet, C.J., & van den Bergh, S. 1994, AJ, 107, 1730 (PvdB94)
- Reitzel, Guhathakurta & Gould (1998) Reitzel, D.B., Guhathakurta, P., & Gould, A. 1998, AJ, 116, 707
- Reitzel & Guhathakurta (2002) Reitzel, D.B., & Guhathakurta, P. 2002, AJ, 124, 234
- Reitzel, Guhathakurta & Rich (2003) Reitzel, D.B., Guhathakurta, P., & Rich, R.M. 2003, AJ, submitted (astro-ph/0309295)
- Rich (2004) Rich, R.M. 2004, Carnegie Observatories Astrophysics Series, Vol. 4: Origin and Evolution of the Elements, ed. A. McWilliam & M. Rauch (Cambridge: Cambridge Univ. Press), in press
- Rich et al. (1996a) Rich, R.M., Mighell, K.J., Freedman, W.L., & Neill, J.D. 1996a, AJ, 111, 768
- Rich et al. (1996b) Rich, R.M., Mighell, K.J., & Neill, J.D. 1996b, in ASP Conf. Ser. 92, Formation of the Galactic Halo…Inside and Out, eds. H.Morrison & A.Sarajedini (San Francisco:ASP), 544
- Rich et al. (2004) Rich, R.M., Reitzel, D.B., Guhathakurta, P., Gebhardt, K., & Ho, L.C. 2004, AJ, 127, 2139
- Ryan & Norris (1991) Ryan, S.G., & Norris, J.E. 1991, AJ, 101, 1865
- Sarajedini & van Duyne (2001) Sarajedini, A., & van Duyne, J. 2001, AJ, 122, 2444
- Schlegel, Finkbeiner & Davis (1998) Schlegel, D.J., Finkbeiner, D.P., & Davis, M. 1998, ApJ, 500, 525
- Siegel et al. (2002) Siegel, M.H., Majewski, S.R., Reid, I.N., & Thompson, I.B. 2002, ApJ, 578. 151
- Stetson (1987) Stetson, P.B. 1987, PASP, 99, 191
- Stetson, Davis & Crabtree (1990) Stetson, P.B., Davis, L.E., & Crabtree, D.R. 1990, in ASP Conf. Ser. 8, CCDs in Astronomy, ed. G.H. Jacoby (San Francisco:ASP), 289
- Stetson (1992) Stetson, P.B. 1992, in ASP Conf. Ser. 25, Astronomical Data Analysis Software and Systems I, eds. D.M. Worral, C. Biemesderfer, and J. Barnes (San Francisco:ASP), 297
- VandenBerg et al. (2000) VandenBerg, D.A., Swenson, F.J., Rogers, F.J., Iglesias, C.A., & Alexander, D.R. 2000, ApJ, 532, 430
- van den Bergh & Pritchet (1992) van den Bergh, S., & Pritchet, C.J. 1992, in The Stellar Populations in Galaxies, ed. B.Barbuy & A. Renzini (Dordrecht: Kluwer), 161
- Wetterer & McGraw (1996) Wetterer, C.J., & McGraw, J.T. 1996, AJ, 112, 1046
- Wu et al. (2002) Wu, H., et al. 2002, AJ, 123, 1364
- Wyse (2002) Wyse, R.F.G. 2002, Eur.Ap.Soc.Pub.Ser., 2, 295
- Wyse & Gilmore (1988) Wyse, R.F.G., & Gilmore, G. 1988, AJ, 95, 1404
- Yanny et al. (2000) Yanny, B., et al. 2000, ApJ, 540, 825
- Zibetti, White & Brinkmann (2003) Zibetti, S., White, S.D.M., & Brinkmann, J. 2003, MNRAS, 347, 556
- Zucker et al. (2004) Zucker, D.B., et al. 2004, ApJ, submitted (astro-ph/0401098)
| CCD | ||
|---|---|---|
| 0 | 24.65 | 23.51 |
| 1 | 24.78 | 23.61 |
| 2 | 24.61 | 23.38 |
| 3 | 24.76 | 23.62 |
| 5 | 24.71 | 23.65 |
| 7 | 24.56 | 23.57 |
| bbcounts after background subtraction | bbcounts after background subtraction | |||||
|---|---|---|---|---|---|---|
| [m/H] | ||||||
| 6.4 | 2.6 | 1.1 | 1.1 | |||
| 12.9 | 5.0 | 2.5 | 3.7 | |||
| 12.8 | 5.2 | 1.9 | 3.3 | |||
| 41.8 | 7.4 | 3.6 | 3.9 | |||
| 24.1 | 5.8 | 1.4 | 3.2 | |||
| 38.8 | 6.7 | 14.2 | 4.5 | |||
| 28.4 | 6.2 | 17.5 | 5.3 | |||
| 48.3 | 8.7 | 14.9 | 6.5 | |||
| 50.8 | 8.4 | 12.7 | 5.6 | |||
| 60.3 | 9.1 | 10.5 | 5.6 | |||
| 58.0 | 9.5 | 33.4 | 8.1 | |||
| 108.5 | 11.8 | 22.7 | 7.0 | |||
| 96.7 | 11.8 | 21.9 | 7.9 | |||
| 164.3 | 14.8 | 33.7 | 8.6 | |||
| 164.5 | 14.5 | 47.2 | 9.2 | |||
| 196.8 | 17.3 | 30.1 | 10.5 | |||
| 262.2 | 21.1 | 37.3 | 12.6 | |||
| 257.1 | 21.8 | 52.5 | 14.2 | |||
| 216.3 | 23.8 | 38.2 | 17.8 | |||
| 137.9 | 22.4 | 44.2 | 18.6 | |||
| 142.0 | 25.9 | 49.1 | 19.5 | |||
| 9.7 | 20.1 | |||||