A HUBBLE SPACE TELESCOPE WFPC 2 INVESTIGATION OF THE DISK-HALO INTERFACE IN NGC 89111affiliation: Based on observations with the NASA/ESA Hubble Space Telescope, obtained at the Space Telescope Science Institute, which is operated by the Association of Universities for Research in Astronomy, Inc. under NASA contract No. NAS5-26555. These observations are associated with proposal #6588.
Abstract
We present deep narrowband observations with high spatial resolution of extraplanar diffuse ionized gas in the halo of NGC 891, obtained with the WFPC2 on-board the HST. Our H observations, centered on the northern part of NGC 891, reveal an extended gaseous halo, which fills almost the entire field of view of our WFPC2 observation. Whereas NGC 891 has been studied extensively with ground-based telescopes, here the small scale structure of the extended emission line gas is presented at high spatial resolution of 01, corresponding to 4.6 pc at the distance to NGC 891. The majority of the H emission is diffuse. Several discrete features (e.g., filaments) are visible as well. Some of the filaments reach distances of up to 2.2 kpc above the galactic plane, and are extremely collimated, even at high galactic latitudes. We compare the morphology of these filaments with theoretical models, which describe possible transport mechanisms in a general way. Despite the prominent dust lane, many bubbles, shells and super-shells can be discerned in the midplane. We also investigate extraplanar dust features, which are best visible in unsharp-masked images of our broadband F675W image, and we compare them to the spatial distribution of DIG filaments. The high- dust is detected out to distances of 2.2 kpc above/below the galactic midplane. Individual dust features, however, are not spatially correlated with diffuse ionized gas counterparts, such as individual filaments. Quite interestingly, the orientation of the dust features changes from being mostly aligned perpendicular to the disk at low galactic latitudes, to a parallel alignment at high . We compare the diffuse ionized gas distribution to the hot ionized medium, traced by X-ray observations performed by Chandra. There exists a good correlation of the presence of the warm and hot ionized gas, in particular, an X-ray bright region at 1-1.5 kpc fills the entire northern halo region, whereas the intensity in the midplane is considerably depressed. We also compare the sizes of individual H emission line features in the midplane of NGC 891 with similar structures that are known in our Milky Way and in the LMC.
THE ASTRONOMICAL JOURNAL, in press (August 2004 issue)
1 INTRODUCTION
The detection of extended diffuse ionized gas (DIG) or frequently also called warm ionized medium (WIM) in halos of late-type spiral galaxies is generally believed to be correlated with the star formation activity in the galaxy disk. This layer in external galaxies is equivalent to the Reynolds layer, which is observed in our Milky Way (Reynolds, 1984). More recent galactic studies showed that the diffuse H emission is ubiquitous and detected in almost every direction on the sky (Haffner et al., 2003). DIG has a typical electron density of in the disk (decreasing exponentially towards higher galactic latitudes), and has a typical scale height of 1-2 kpc.
In the theoretical picture, the gas, most likely driven by collective supernovae, is expelled into the halos of these galaxies. Norman & Ikeuchi (1989) developed the theory in which the gas is being transported through tunnel-like features into the halo, called chimneys, provided the superbubbles created from SNe fulfill the breakout criterion. Depending on the strength of the gravitational potential the gas may be able to fall back onto the galactic disk, which is described as the galactic fountain scenario (Shapiro & Field, 1976; de Avillez, 2000). A few other investigations of the multiphase interstellar medium involving SNe have been conducted (e.g., Korpi et al., 1999; Wada & Norman, 1999, 2001; Wada, 2001).
The fractional contribution of DIG to the total H emission in galaxies reaches typically values of 25-50% (e.g., Walterbos & Braun, 1994; Ferguson et al., 1996b; Lehnert & Heckman, 1995; Thilker et al., 2002), and DIG is thus an important constituent of the ISM. The emission is most likely due to photoionization by hot OB stars (Miller & Cox, 1993; Dove & Shull, 1994). The temperatures, determined from upper limits of diagnostic line ratios (e.g., [N II] lines) in the galaxy and in a few external galaxies are in the range of 8000-13000 K. (Rand, 1997; Reynolds et al., 2001; Tüllmann et al., 2000). However, other ionizing and heating mechanisms such as shock-ionization (Chevalier & Clegg, 1985), magnetic reconnection (Birk et al., 1998) and turbulent mixing layers (Slavin et al., 1993) have been invoked in order to account for the observed emission line ratios, which are not consistent with current pure photoionization models (Mathis, 1986; Domgörgen & Mathis, 1994). The line ratios in the disk are more or less consistent with the models. However, recently determined line ratios in external galaxies, such as the [O III]/H, increase with increasing galactic distance, which are not compatible with these models, as observations have shown (Rand, 1998, 2000; Tüllmann et al., 2000).
Furthermore, it is presently not clear how the ionizing photons can travel such vast distances from the disk into the halo, if OB stars are regarded as the primary source. Gaseous halos seem to be a common feature among starburst galaxies (Lehnert & Heckman, 1995), where the gas is most likely expelled into the halos by starburst- or SNe-driven superwinds. However, in normal or quiescent galaxies the presence of extended gaseous halos does not seem to be the general case but is mostly encountered in late type spirals with high SF activity on both local and global scales (Rossa & Dettmar, 2003a, b).
A few investigations have been undertaken to study the gaseous halos in quiescent galaxies (Pildis et al., 1994; Rand, 1996; Hoopes et al., 1999; Collins et al., 2000; Rossa & Dettmar, 2000; Miller & Veilleux, 2003), but not all of these galaxies revealed extraplanar DIG (eDIG). The first larger survey to study eDIG in the disk-halo interaction (DHI) context has been carried out recently, which covered 74 edge-on galaxies (Rossa & Dettmar, 2003a, b). It was shown in this investigation that nearly 41 % of the survey galaxies have eDIG detections, and a minimal threshold of star formation rate per unit area was derived (Rossa & Dettmar, 2003a).
A variety of morphological features are generally observed (e.g., filaments, plumes, bubbles, shells), and sometimes, in the case of actively star forming galaxies (e.g., NGC 4700), even a pervasive DIG layer at typical distances of 1-2 kpc above/below the galactic plane was detected. Individual filaments, occasionally reaching distances of up to 6 kpc, are superimposed in a few cases as well (Rossa & Dettmar, 2003b). Whereas the above mentioned survey and the smaller samples studied by individual researchers have aimed at the detection and overall morphology of gaseous halos in edge-on galaxies, little is actually known about the small scale structure of the eDIG. This small scale structure can only be studied in the nearest galaxies with the highest spatial resolution available. Therefore, high resolution observations with the HST in nearby edge-on spirals, yielding spatial resolutions of the order of a few parsecs, such as in the case of NGC 891, seem promising to study the disk-halo connection in detail.
| Object | R. A. (J 2000.0) | Dec. (J 2000.0) | Filter | FWHM | p.a. | ||
|---|---|---|---|---|---|---|---|
| [hh mm ss] | [° ′ ″] | [s] | [Å] | [Å] | [°] | ||
| NGC 891 | 02 22 39 | +42 22 11 | 400 | F675W | 6734.5 | 889.4 | 22 |
| NGC 891 | 02 22 39 | +42 22 11 | 2800 | F656N | 6561.5 | 22.0 | 22 |
| NGC 891 | 02 22 39 | +42 22 11 | 2700 | F656N | 6561.5 | 22.0 | 22 |
2 NGC 891 AND THE DISK-HALO CONNECTION
The famous nearby edge-on spiral NGC 891 is considered to be a twin to our own Milky Way in many respects. It is one of the best studied edge-on galaxies, which has been investigated in almost all wavelength regimes from the radio (e.g., Dahlem et al., 1994) to the X-ray (Bregman & Pildis, 1994) regime in the DHI context. About a decade ago an eDIG layer has been discovered in this galaxy (similar to the Reynolds layer in our Milky Way) by Dettmar (1990) and Rand et al. (1990), making use of H narrowband imaging. Further spectroscopic investigations confirmed and revealed diffuse emission up to 5 kpc above the galactic plane (Keppel et al., 1991; Dettmar & Schulz, 1992; Rand, 1997, 1998). From the imaging observations it was shown that the star formation activity in NGC 891 is not equally distributed along the disk, since an asymmetrical distribution of the DIG layer is observed. The dominating SF activity is located in the northern part of NGC 891, whereas in the southern part there is much less activity. This is consistent with radio continuum observations (Dahlem et al., 1994), which are not affected by dust. Therefore, extinction can be excluded as a cause of the depression of the eDIG layer in the southern part. Instead, it is rather a real consequence of the decreasing strength of SF activity within the disk of NGC 891. Those inhomogeneities are not unusual among actively star forming galaxies.
In addition of bearing a prominent eDIG layer, NGC 891 also shows spectacular extraplanar dust features, which reach up to kpc into the halo as well (Howk & Savage, 1997). Correlation studies of the DIG distribution, traced by the H emission, so far do exist with the radio continuum (Dahlem et al., 1994), and H I (Swaters et al., 1997), and for the hot ionized medium (HIM), as observed in the X-rays (Bregman & Pildis, 1994). A previous study by Howk & Savage (1999) showed that there is generally no direct correlation between the DIG filaments and extraplanar dust features on a small scale. This behavior was confirmed by Rossa & Dettmar (2003b) using a much larger sample. A re-investigation of the extraplanar dust in NGC 891 using deeper broad band images also validates this trend (Howk & Savage, 2000). FIR and sub-mm observations, as performed with the ISO satellite and with SCUBA at the JCMT, respectively, have also detected amounts of extended cold dust in NGC 891 (Alton et al., 1998). In addition, an extended halo has been reported from CO observations, obtained with the IRAM 30m telescope (García-Burillo et al., 1992). All these observations strongly imply that there is a large scale circulation of matter from the disk into the halo. This is directly linked to galaxy evolution, as the IGM is enriched with metals by those outflows.
The distance to NGC 891, as a member of the NGC 1023 group, has been derived to be 9.5 Mpc (van den Bergh, 1992), which is consistent with other distance determinations such as the Planetary Nebula Luminosity Function (PNLF), which yielded 9.9 Mpc (Ciardullo et al., 1991). We will adopt a distance of 9.5 Mpc throughout this paper. With this distance NGC 891 is a prime candidate for high resolution studies of the small scale structure of the DIG. Furthermore, this galaxy has an inclination which is very close to be perfectly edge-on (), where the disk separates from the halo in projection very well. We therefore have carried out H observations with the HST, making use of the WFPC2, which yielded a spatial resolution of 4.6 pc at the distance of NGC 891. This allowed us to study the distribution of DIG in external galaxies with unprecedented detail. Similar studies have been carried out recently for the starburst galaxy NGC 3079 (Cecil et al., 2001, 2002), where the nucleated gaseous outflowing cone was imaged and compared to the X-ray morphology, studied with Chandra. Furthermore, one additional HST/Chandra comparison study in the case of the interacting actively star forming Virgo spiral galaxy NGC 4631 was performed (Wang et al., 2001).
3 OBSERVATIONS AND OBSERVING STRATEGY
The HST observations of NGC 891 were carried out with the WFPC2 camera. For the narrowband (H) observations the F656N filter was used, and the broadband images (to be used for continuum subtraction) were obtained with the F675W filter. The datasets have the following abbreviations U54Y0202B (narrowband) and U54Y0101B (broadband). In total, 8 HST orbits were performed to obtain a deep H image of NGC 891 resulting in an on-source integration time of 25.1 ksec. The observational parameters are listed in Table 1.
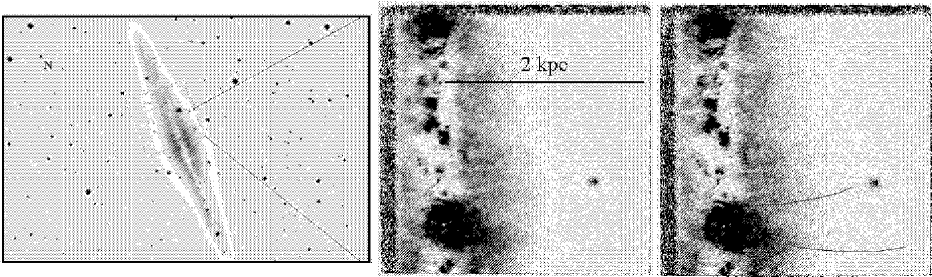
The individual exposures were taken between February 17-19 1999 in dither mode, in order to approach more closely the diffraction limit of the telescope (since the WFPC2 CCD pixels are undersampled), and to allow good cosmic ray removal. The WFPC2 field was centered on R. A. , and Dec. , both J 2000.0 at HST orientation angle , centered on the PC frame. This resulted in a on the sky, thus aligned along the major axis of NGC 891. The field covers the northern part of NGC 891, slightly north off the central region, including parts of the prominent bulge (see Figure 1). The field position and p.a. were chosen for a variety of scientific reasons, which are briefly elucidated below.
From the detections of the extraplanar gas layer in NGC 891 in the early nineties it was known that there is an asymmetrical eDIG distribution, with the prominent gaseous halo in the northern part of NGC 891 (cf. Dettmar, 1990; Rand et al., 1990). Due to the velocity field of NGC 891 which was studied in H I (Rupen, 1991), the northern part was also the most suitable choice for our investigation, as it covered the H emission in the available F656N filter passband. The southern part of NGC 891 would not be covered by the FWHM of the F656N filter. Furthermore, interesting features (filaments, H II regions) are visible in ground-based images in this specific northern part, which can be studied now with higher angular resolution.
A few orientations of the WFPC2 aperture onto NGC 891 were possible in principle. However, due to the time-critical observations (NGC 891 could only be observed in small periods of time twice a year), and a possible further delay of the WFPC2 observations during 1998 (due to problems associated with the coolant of the NICMOS camera), we were prompted to change our original proposed orientation. After analyzing possible solutions, taking into account the above mentioned constraints, three viable orientations, which would cover most of the desired areas in NGC 891, remained. We finally decided to choose the (p.a. = 22°) orientation, since the other two orientations suffered from relatively bright stars near the edges of the WFPC2 aperture, which would lead to reflexions and ghost-images in the WFPC2 field. In order to avoid contamination of bright stars on the border of these regions ( dragon’s breath), which would ultimately lead to difficulties in removing artifacts that might be caused by these, we neglected the other two orientations.
4 DATA REDUCTION
The data were pipeline processed in the usual manner, including bias level correction and flat-fielding. The further reduction was performed using the drizzle package within IRAF, developed for dithered images (Fruchter & Hook, 2002). First we applied a coarse cosmic ray removal using the precor task to the images. Then the dithered images were cross-correlated with one image acting as the reference image, both in the on-band and off-band exposures. Subsequently, we determined the shifts using shiftfind and avshift, choosing the WF2 field as a weight parameter. The average shifts determined in each of the four WFPC2 CCD chips for each individual exposure had values ranging from -5 to 16 pixels. In order to check that the count rates in the sub-fields did not significantly deviate from one image to another, we compared the values, obtained from two selected fields, as determined through the image statistics. The images did not show any significant deviation. Now each of the four PC/WF sub-images were processed separately. We then generated cosmic ray masks. The shifted sub-images were drizzled with a scale factor of 0.5 to an embedded output image having the dimension of 2048 2048 pixels. After drizzling the images were median combined. Then we blotted (the process of reverse drizzling) the median image in order to have images which match the positions and the size of the input images. These blotted images can be used to identify and mask cosmic rays in the original images. Finally the blotted images were drizzled onto a finer grid. In order to recover some resolution from the undersampled images we thus shrunk the drop size. For more details on the drizzling method we refer to Gonzaga et al. (1998).
Since from the drizzled images no mosaics could be generated within IRAF, we have used the smaller images to create a mosaic, which was used for the flux calibration comparison, and identifying the bright filaments, whereas the higher resolved drizzled images have been used to analyze the small-scale morphology of the DIG.
5 ANALYSIS
5.1 Narrowband imaging
Due to the given FWHM of 22.0 Å of the F656N filter, the filter passband also contains some amount of continuum. In order to obtain pure H emission the F656N images had to be continuum subtracted by the scaled broadband filter (F675W) exposure. This was done by measuring the count rates of several individual stars, which were visible in all of the four WFPC2 fields in both the on-band and off-band exposures. The individual measurements were then averaged to obtain a final scaling factor. The off-band exposure, multiplied by the scaling factor, was subtracted from the on-band exposure to obtain a continuum free H image. Due to the relatively small FWHM of the F656N filter there is no contamination of emission from the adjacent [N II] doublet. Finally, a flux calibration has been performed. The net H image’s calibration was derived following O’Dell & Doi (1999). We did not include the correction they derive for contamination of [N II] emission, since the velocity shift of NGC 891 places only little [N II] emission in the filter passband. The calibration was consistent within the uncertainties with ground-based calibration (Rand et al., 1990). The determined sensitivity of is of the order of (rms per pixel).
Generally speaking, using a broadband filter for the continuum subtraction is done to save exposure time in the offband filter. While the line emission is included in the broad filter passband, the contribution of line emission with respect to the continuum is very small. The equivalent widths of both filter passbands are quite different. Hence, when the continuum image is scaled to the narrowband image in order to bring the continuum levels together, the line emission in the broadband filter passband is scaled down quite substantially compared to the line emission in the narrowband filter, and very little (a few percent at most) of the line emission maybe removed from the narrowband filter passband. Since this data set is primarily geared to the morphology of the emission, and not to the diffuse or absolute levels, we opted to use the broadband method to cut back on required exposure time and to maximize the S/N.
A galactic contamination of the observed H emission in extragalactic sources is feasible in principle, specifically for targets in areas of the sky close to the galactic plane. For details on the galactic H emission we refer to the emission line surveys such as WHAM (Haffner et al., 2003), the Virginia Tech Spectral-Line Survey (http://www.phys.vt.edu/halpha/) and SHASSA (Gaustad et al., 2001). Galactic emission could occur, in that [N II] emission from the Milky Way falls in the HST filter passband. However, this is unlikely to be a problem. We are discussing a very small region of the sky, and the Galactic emission could only make NGC 891 appear diffuse if it were structured exactly such that it appeared concentrated towards NGC 891’s disk, which is what we see in the HST and ground-based data. That would seem to be a rather unlikely situation. However, we like to mention that there is at least one reported case (ESO209-9), where this can be an issue (Rossa & Dettmar, 2003b). We note that ESO209-9 is closer to the Milky Way galactic plane in projection, and also the passband of the narrow filter used in that study was much larger than the current one of our WFPC2 study.
It should be noted that we cannot make a determination of the total extend of the NGC 891 emission due to the relatively small field of view covered by the WFPC2 observation. For the same reason, we cannot determine the zero level background from our data. This can be better addressed by ground-based imaging and long-slit investigations (e.g., Dettmar, 1990; Rand et al., 1990; Rand, 1997; Hoopes et al., 1999).
| Identifier | x | y | Dimensions | Classification | |
|---|---|---|---|---|---|
| Fil-WFi-j | [′′] | [′′] | [pc] | [pc pc] | |
| Fil-WF3-1 | 21975 | filament | |||
| Fil-WF3-2 | 19675 | filament | |||
| Fil-WF3-3 | 5 | filament | |||
| Fil-WF3-4 | 5 | filament | |||
| Fil-WF3-5 | 5 | filament | |||
| WF4-EH2 | 5 | extraplanar H II region | |||
| Arc-WF4-1 | 5 | arc | |||
| Arc-WF4-2 | 12715 | arc | |||
| Fil-WF3-6 | 5 | filament | |||
| Fil-WF3-7 | 13685 | filament | |||
| Fil-WF3-8 | 12575 | filament |
5.2 Broadband imaging
The broadband (F675W) images of NGC 891 were obtained for two purposes. The primary aim was to subtract the continuum emission from the on-band images. They also allow a comparison of extraplanar dust features with eDIG filaments. These two physically distinct phases (see Howk & Savage, 2000) of the ISM can be studied in detail, to search for possible correlations between the two extraplanar ISM constituents. To better enhance the contrast between the dust structures and the background light from the galaxy, we have constructed unsharp-masked versions of our broadband images. These were obtained by dividing the broadband images by a smoothed version of the broadband images. The latter ones were created by using a Gaussian filtering technique.
6 RESULTS
6.1 Extraplanar diffuse ionized gas (eDIG)
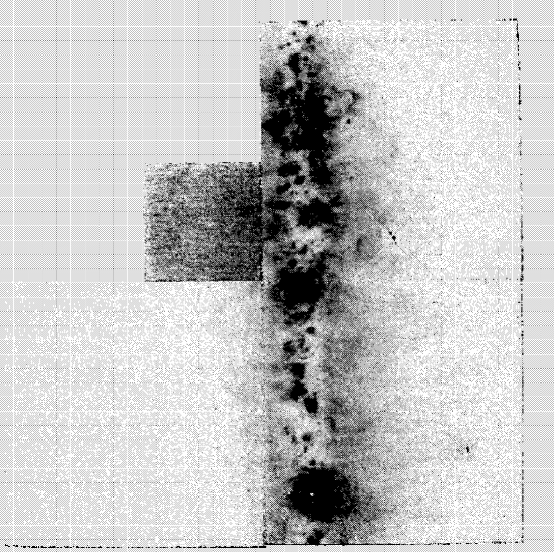
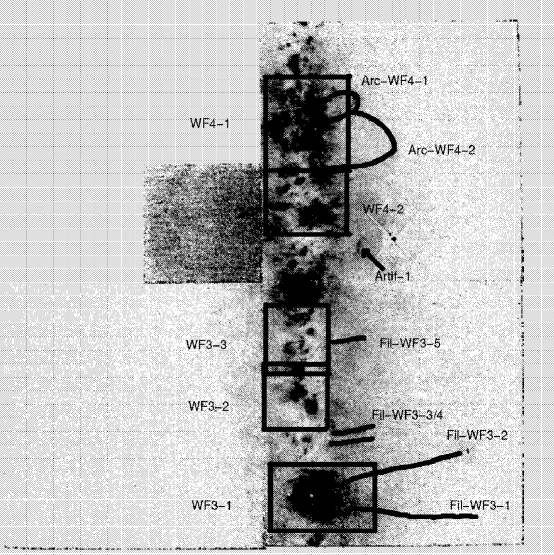
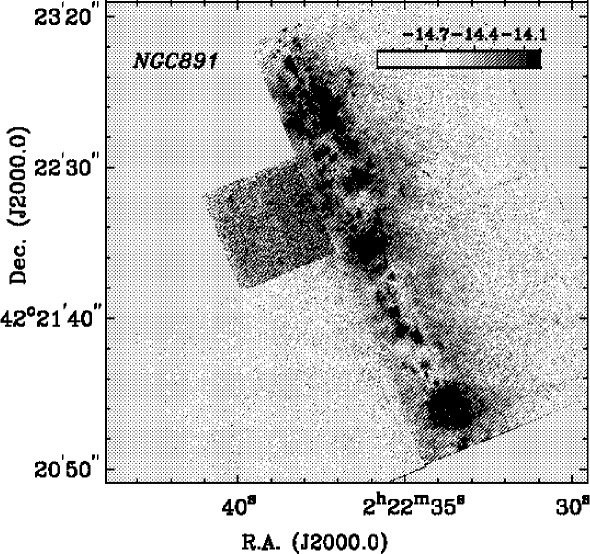
The overall distribution of eDIG in the northern part of NGC 891, as derived from our WFPC2 observations, shows a very smooth pattern (see Figure 2). These narrowband HST observations offer the highest spatial resolution of eDIG studied in external non-starburst galaxies to date, with a spatial resolution of 4.6 pc at the distance to NGC 891. Whereas the majority of the high- H emission is clearly diffuse, several filaments, however, can be discerned as well. A description of the various eDIG/DIG features (e.g., filaments, plumes / bubbles, H II regions, supershells) including the sizes, distances from the galactic midplane, are summarized in Table 2 and Table 3. The nomenclature of our identified eDIG filaments is in the following format: Fil-WF field + No., and selected fields. The brightest filaments are marked in Figure 3. The positional offsets x and y (in arcseconds), relative to the center of the PC field, are listed as well. The coordinates for the filaments refer to the observed position from which they seem to originate. For the two arcs the positional offsets refer to the outermost extension of each arc. As the arcs are irregular in shape, we list the distance to the outermost detected emission, rather than defining a radius, which would be difficult to assess, due to their observed morphology. In Figure 4 we show the calibrated image in a logarithmic stretch and with a coordinate grid.
6.2 Morphology of eDIG
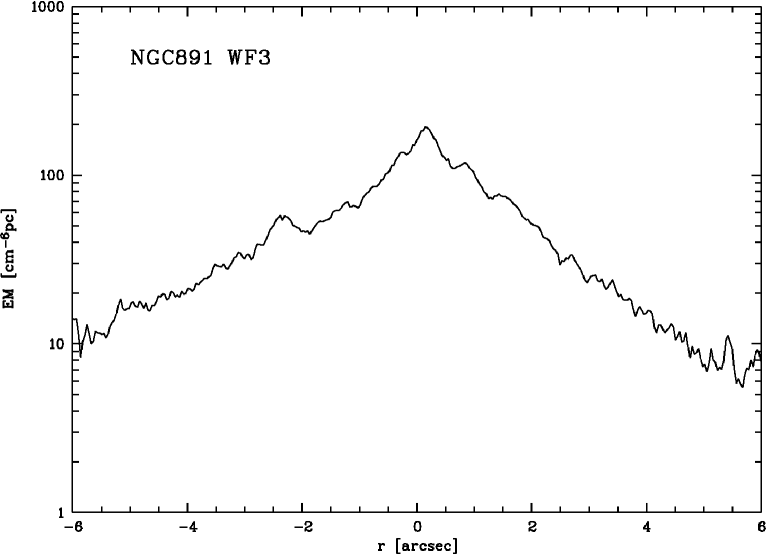
On the larger scale the H emission is observed mostly in diffuse emission. The eDIG can be detected out to kpc above the galactic midplane. We are actually limited by the field size of the WFPC2 and sensitiviy. Given the position of NGC 891 onto the WFPC2 chip, the field size is about 2.5-4.5 kpc from the midplane to the border of the chip on the western/eastern side. The intensity of the DIG is brightest above the most active disk star forming regions (e.g., supergiant shells). A few bright filaments and arcs are protruding from the regions, where supershells are located into the halo. The two giant arcs which emanate from the bright emission complex in the WF4 field (containing the supershell WF-4-SS1) out to 1.3 kpc, connect on either side with bright emission regions in the disk region. In several cases we detected smaller filaments which appear to be originating from regions deep within the disk, where no bright emission regions are detected. However, this may be an effect of local extinction, as we cannot determine at which depth the filaments are actually connected to the the disk. There can be bright supershells, embedded in regions of higher extinction or these regions can be located in deeper layers within NGC 891’s disk. Due to the extinction effects we cannot judge which of the both scenarios is true. However, the presence of filaments appearing at pc clearly shows the decreasing influence of extinction at higher galactic latitudes. Scattered light from H II regions contributes only a minor part of the observed DIG emission, as it has been shown from modeling, that the contribution at pc falls to about 10 % (Ferrara et al., 1996). A profile of the H emission at the central part emission region, perpendicular to the disk of NGC 891, is shown in Figure 5, where the intensity in EM () is plotted as a function of the spatial distance from the midplane.
Two bright arcs are visible in the WF4 field of the WFPC2, where the larger one reaches a distance of kpc. In the WF3 field two super-thin filaments protrude from the disk, and north of them three prominent and thicker filaments are clearly recognizable. On the other side of the disk several fainter filaments emanate from the disk, which are not as straight as the brightest filaments already mentioned.
In a general sense there is a good correlation of filaments with SF regions in the disk observed. Not only the very thin and long filaments, which seem to protrude from the supershells, have connections with SF regions in the disk. For instance, there are two bright arcs in the WF4 field (see Figure 2), which are connected with and actually trace back to the disk, indicative of a galactic fountain scenario. Many of the smaller filaments also seem to originate from bright SF regions within the disk. However, it should be noted that extinction eludes us from making firm conclusions on a clear connection in several cases.
6.3 Small scale structure of eDIG
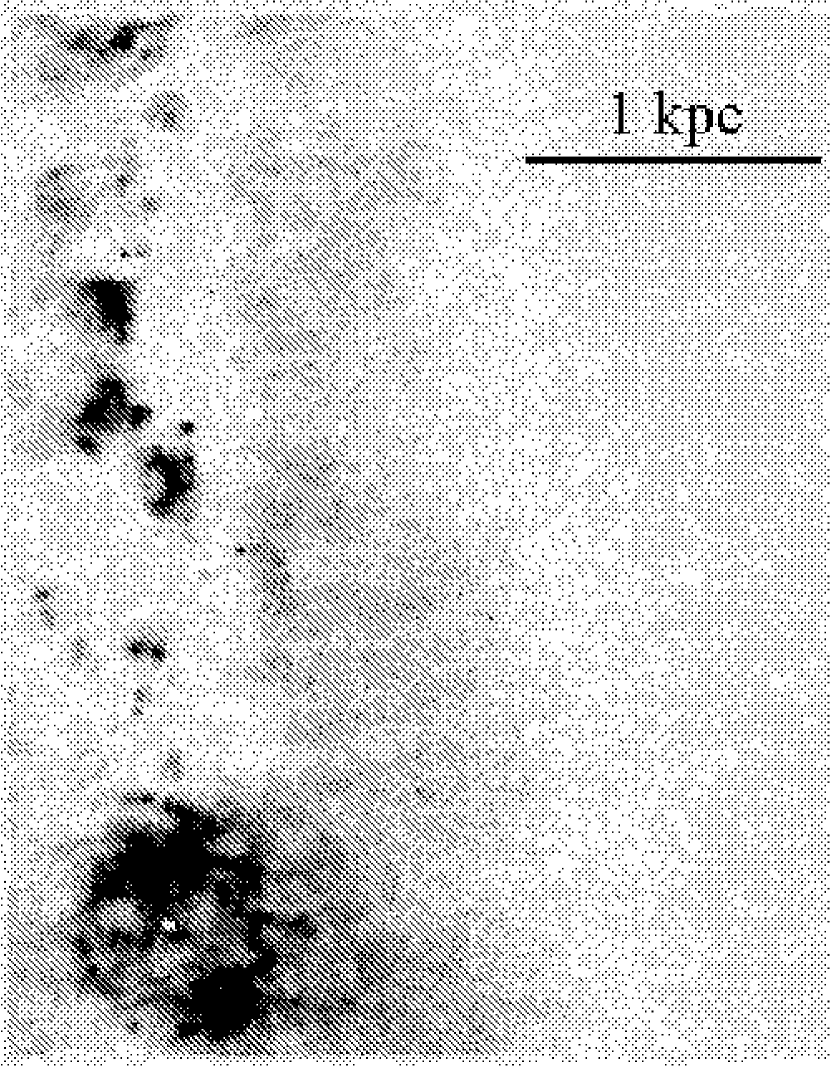
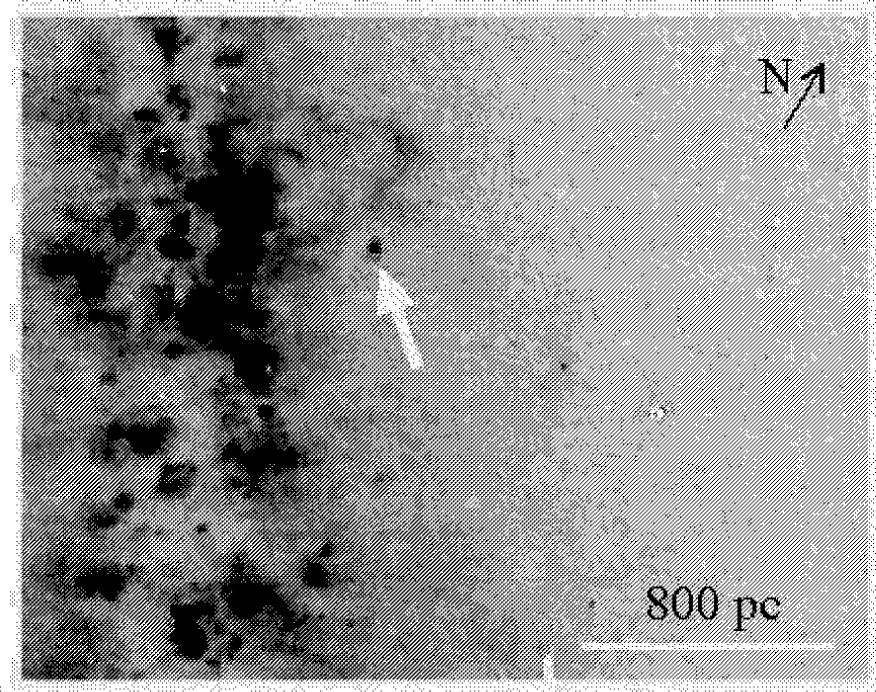
Although the eDIG distribution in NGC 891 is mostly truly diffuse, numerous filaments and arcs are superimposed onto the extended DIG layer. The small scale structure of these filaments can be investigated down to sizes of about 5 pc. There is no intricate filamentary network observed on the very smallest scales. From the sensitivities obtained we can conclude that a breakup of the diffuse emission can only occur below (rms per pixel) into individual filaments. On the other hand, there are some surprisingly long and super-thin (collimated) filaments visible in the WF3 field (see Figure 1 and Figure 2), which are slightly bent and very collimated even out to very high galactic latitudes. These filaments are barely resolved in ground-based images and have widths of 15 pc to 50 pc. The one filament (Fil-WF3-2) is coincident with the one previously identified by Howk & Savage (2000) in ground-based WIYN images, which they have dubbed +026+035. From our HST observations we have estimated sizes that are a factor of two larger in length and a factor of three smaller in width. However, we note that our measurement refers to a mean width, as this filament does not have a constant width as a function of . The curved feature marked in Figure 3 as Artif-1 on the WF4 chip is an artifact caused by the nearby star. In Figure 6 we show an enlargement of the WF4 field, where the two arcs can be seen in more detail. An extraplanar H II region in the disk-halo interface (thick disk) at pc is detected, which is indicated by an arrow in Figure 7 (see Section 6.6).
6.4 Structure of DIG features in the galactic midplane
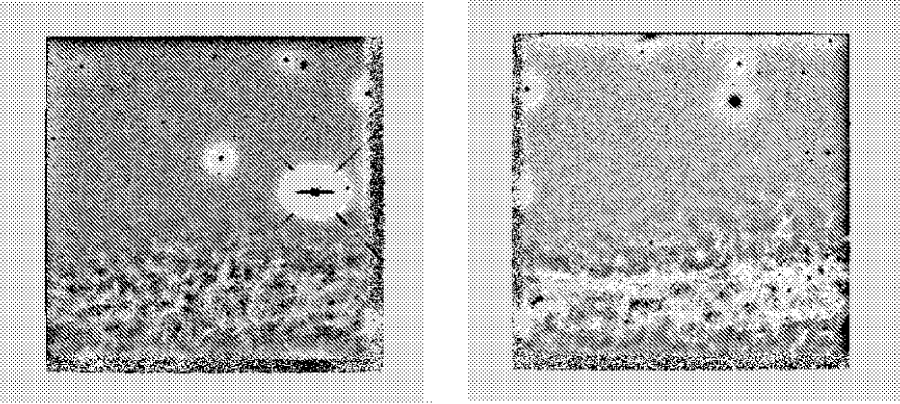
Although NGC 891 bears a rather prominent and extended dust lane which runs across the galactic midplane (see Figure 8), several emission regions which are located in areas not severely influenced by extinction (e.g., individual shells, supergiant shells, H II regions, and SNRs) are visible in our continuum subtracted H images (Figure 6 and Figure 7). The most spectacular feature in the galactic midplane is the supergiant shell WF3-1-SS1, which measures (see Figure 6). It is similar in size and shape as the supergiant shells found in the LMC (e.g., Meaburn, 1980). A super-thin ( pc) filament is protruding from this supergiant shell into the halo, and reaches a distance of kpc. A listing of the most prominent emission features in the midplane is given in Table 3, where information on the position within NGC 891 and the physical sizes is given. Individual H II regions are discerned (e.g., Figure 1), and a superbubble (see Figure 6) can be identified. In Figure 6 and Figure 7 we have used different greyscale cuts to accentuate the inner structure more clearly.
In the continuum subtracted WFPC2 image (Figure 2) there are local regions (i.e. between the two supershells) which show a less pronounced SF activity, compared to most other regions. However, this could be attributed to either less SF, or the emission regions are embedded in deeper layers, and hence are more affected by extinction. Several filaments emerge from the disk at intermediate distances of about 400 pc above the disk, and this might be suggestive that there are strong local inhomogeneities in the dust absorption.
| Identifier | x | y | Dimensions | Classification | |
|---|---|---|---|---|---|
| WF-+Ident. | [′′] | [′′] | [pc] | [pc pc] | |
| WF3-1-SS1 | 1345 | supergiant shell | |||
| WF3-3-SS2 | 555 | supergiant shell | |||
| WF3-SB-1 | 1105 | superbubble | |||
| WF3-H2-1 | 375 | H II region | |||
| WF3-H2-2 | 415 | H II region | |||
| WF3-H2-3 | 1345 | H II region | |||
| WF4-SS-1 | 1705 | supershell |
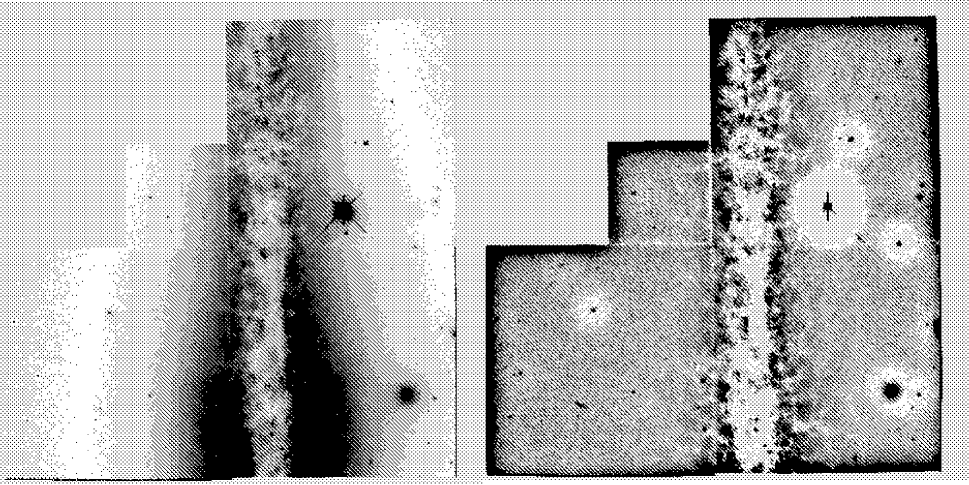
6.5 Extraplanar dust
The extraplanar dust in NGC 891 reveals an intricate network of dusty filaments, which reach extraplanar distances of kpc. These dusty filaments and features are best visible in our unsharp-masked broadband image (Figure 8). In Figure 9 we show a more detailed view of the individual dust patches in the two WFPC2 fields (WF3 + WF4), as the dust lane is covered in these two fields. As already studied with ground-based telescopes under exceptional good seeing conditions of , Howk & Savage have mapped the extraplanar dust in NGC 891 before in the B-band and V-band (Howk & Savage, 1997, 2000) using the WIYN 3.5m telescope. We can confirm their results, and we detect basically the same structure for the extraplanar dust, although our observations were made in the R-band (F675W), which is somewhat more transparent to dust as their B- and V-band. However, the resolution of the WFPC2 is better by a factor of six, and therefore our dust filaments are better resolved. The structure of the smallest visible dust features on a scale of less than 5 pc can be resolved. The dust filaments show a pronounced sub-structure that is not well resolved in the WIYN images by Howk & Savage (2000). Interestingly, the high- dust shows basically two different alignments at various scale heights. The very extended high- dust at kpc is aligned parallel to the galactic plane, while the dust features at intermediate distances kpc are preferentially aligned perpendicular to the disk, although generally a superposition of various directions is observed. As Howk & Savage (1997, 2000) have already given an extensive analysis of the individual extraplanar dust features in NGC 891, we refrain here from discussing all further details again, as our main focus is on the DIG.
6.6 Extraplanar H II regions and halo PNe
An interesting side aspect of the detection of H emission in the disk-halo interface of spiral galaxies is the search for possible extraplanar H II regions giving rise to star formation far above the galactic disk. Over the last couple of years a few detections of extraplanar and intracluster H II regions in and surrounding spiral galaxies have been reported (e.g., Ferguson et al., 1996a; Gerhard et al., 2002; Tüllmann et al., 2003; Ryan-Weber et al., 2004). Specifically, for NGC 891 Howk & Savage (1997) reported a detection of a H II region in the disk-halo interface, which we also identify in our WFPC2 data, dubbed WF4-EH2. It is located at about pc above the galactic plane (see Figure 7). We identify a double morphology, with one knot being much brighter. The size we measured is approximately 45 pc. We note that the knot is much smaller, with some extended diffuse emission around it. We derive a luminosity of , which is slightly less than the luminosity of the Orion nebula (e.g., Kennicutt, 1988). There is a somewhat fainter blotch at a similar distance from the galactic midplane visible in that same figure just south of WF4-EH2, which is probably another H II region. All these observations of extraplanar H II regions establish a low level of star formation at high galactic latitudes. This should be considered in discussing the existence of early-type stars in the Milky Way halo (e.g., Kilkenny et al., 1995; Hambly et al., 1996). However, it should be mentioned that the occurrence of these H II regions is a relatively rare phenomenon, hence they are unlikely to contribute much, if any, to the ionization of DIG above the disk. Considering that some or all of the H II regions are due to runaway O-stars is very unlikely. A runaway O-star would no longer have an associated H II region anymore.
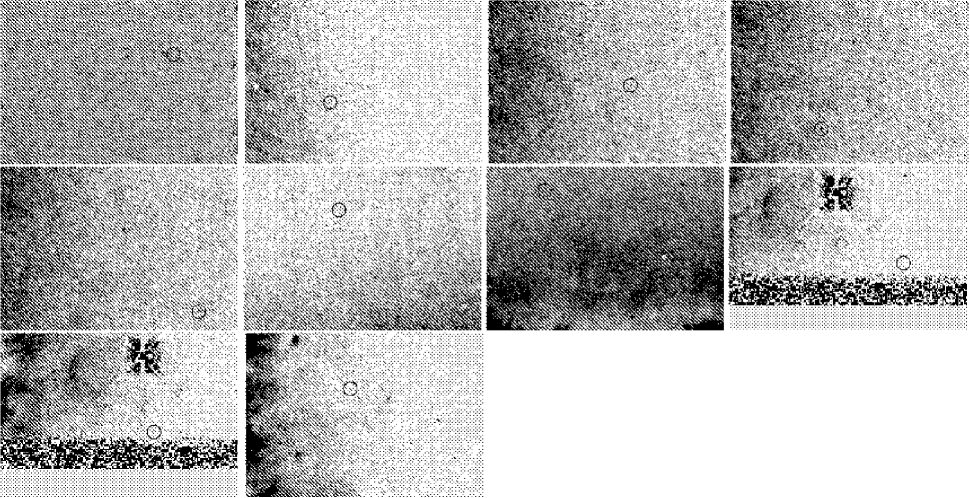
Another source of H emission in the halo are planetary nebulae (PNe). Ciardullo et al. (1991) detected in their ground-based study of NGC 891 a total of 33 PNe in the halo. Of these, 10 PNe are located in our WFPC2 field of view. We show our individual WFPC2 image sections with the candidate PNe marked by circles in Figure 10.
Although the detections by Ciardullo et al. (1991) were based on the [O III] emission line flux, which is usually the strongest emission line in PNe, those species often also exhibit a considerable amount of H emission. We list the properties of the PNe in Table 4, including identifier, position, size and distance from the midplane. The identifier is a combination of the WF/PC field and the running order sorted in R.A. for each of the four WF/PC fields. Of the 10 candidate PNe we marginally detected six PNe, with only two clear detections. From one of those two (PN-WF2-4) we estimated the flux in an aperture with a radius of pixels, which yielded a magnitude of mag, which corresponds roughly to the limiting magnitude of a point source we reached in our H observation.
| Identifier | R.A.(J2000.0) | Dec.(J2000.0) | size | detect. | alternate name | |
|---|---|---|---|---|---|---|
| [hh mm ss.ss] | [° ′ ″] | [pc] | ||||
| PN-PC-1 | 02 22 38.96 | +42 22 25.5 | 1105 | … | no | CJH91#33 |
| PN-WF2-1 | 02 22 29.67 | +42 22 21.9 | 1161 | unresolved | yes | CJH91#20 |
| PN-WF2-2 | 02 22 37.81 | +42 21 26.7 | 1520 | unresolved | yes | CJH91#26 |
| PN-WF2-3 | 02 22 37.90 | +42 21 48.7 | 1161 | unresolved | yes | CJH91#01 |
| PN-WF2-4 | 02 22 39.20 | +42 21 42.5 | 1934 | unresolved | yes | CJH91#04 |
| PN-WF3-1 | 02 22 31.80 | +42 21 46.7 | 1879 | … | no | CJH91#11 |
| PN-WF3-2 | 02 22 33.71 | +42 22 03.3 | 1216 | … | no | CJH91#03 |
| PN-WF4-1 | 02 22 33.08 | +42 22 20.6 | 1838 | unresolved | yes | CJH91#24 |
| PN-WF4-2 | 02 22 33.73 | +42 22 17.1 | 1442 | … | no | CJH91#25 |
| PN-WF4-3 | 02 22 35.56 | +42 22 49.7 | 1133 | unresolved | yes | CJH91#13 |
7 COMPARISON WITH OTHER MULTIFREQUENCY HIGH SPATIAL RESOLUTION DATA
7.1 Optical versus NIR narrowband imagery
The detailed investigation of the connection between the superbubbles and the filaments, that are driven by outflows, can be achieved by NIR narrowband observations, which trace the star formation such as the Br or Pa line. We have looked at the HST archival NICMOS Pa observation of NGC 891 for a detailed analysis of the disk-halo interface in NGC 891. These observations were part of the wide field Pa snapshot survey of nearby galaxy nuclear regions (P.I.: W. Sparks), and have previously been published by Böker et al. (1999). The field of view of the NICMOS image is substantially ( a factor of nine) smaller (), compared to our WFPC2 image of NGC 891. Unfortunaltely, the offsets of the image centers between the NICMOS and WFPC2 observations amount to and , and hence show only a very marginal overlap.
The Pam line observations trace the regions deep within the disk that are almost obscured at optical wavelengths due to the prominent dust lane. The image shows only a few brighter star-forming regions within the disk, and a moderately bright nuclear region. There is still a considerable amount of dust visible as well. As this pointing traces the nuclear part of NGC 891, where already a substantial decrease in H emission is visible from ground-based images, this confirms that there is much less star formation happening at and surrounding the nuclear regions, compared to the brighter emission regions in the northern part of NGC 891 (e.g., Dettmar, 1990; Rand et al., 1990).
7.2 A detailed comparison with Chandra X-ray data
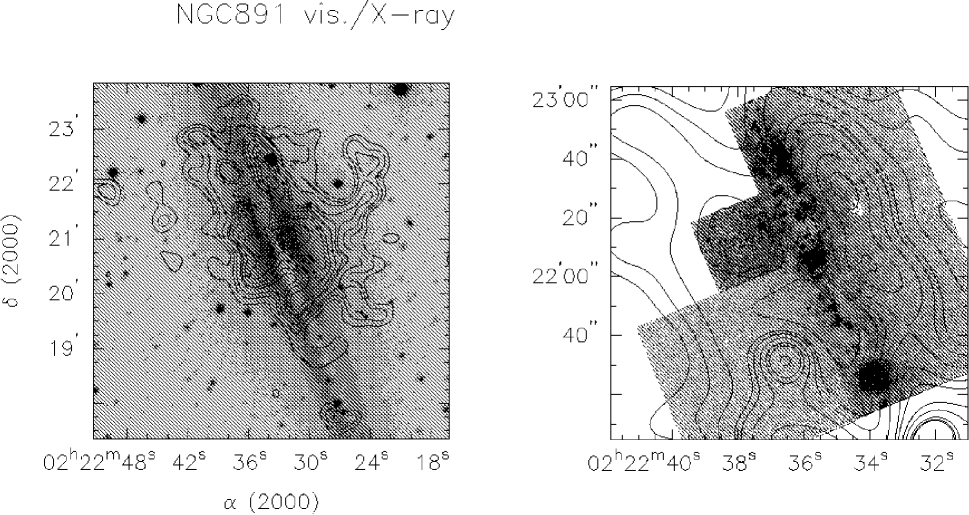
NGC 891 has been studied in the X-ray regime with ROSAT (Bregman & Pildis, 1994), where an extended X-ray halo has been detected. More recently, within a sample of star-forming disk galaxies, the spatial and spectral properties of NGC 891 have been thoroughly investigated (Strickland et al., 2004a, b). We used the Chandra ACIS image of Strickland et al. (2004a) to compare the small scale structure of the hot ionized medium with the warm ionized medium. In Figure 11 we show the superposition of the two ISM constituents. The left panel shows the DSS image of NGC 891 superimposed with the contours of the Chandra ACIS observation. The Chandra image shows the soft X-ray emission in the 0.3-2.0 keV band, which has been background subtracted and adaptively smoothed to achieve a better S/N ratio. The point sources have been removed as well. For further details on the X-ray observations and reductions we refer to Strickland et al. (2004a). In the right hand panel we show the superposition of our WFPC2 H image, again with the Chandra ACIS soft 0.3-2.0 keV band. The global distribution of the X-ray emission follows the N-S asymmetry which was also observed in H (e.g., Dettmar, 1990; Rossa & Dettmar, 2003b) and in the radio continuum (e.g. Dahlem et al., 1994).
The disk of NGC 891 lacks strong X-ray emission, although it is embedded in a pervasive soft X-ray layer. However, two local maxima in the 0.3-2.0 keV band were detected in the northwestern halo region, above strong supershells in the disk. This is also the halo region (1 kpc), where our diffuse H emission is brightest. The pipeline processed XMM-Newton EPIC pn-image shows more or less the same global structure as the Chandra image.
8 DISCUSSION
The general eDIG morphology of previous ground-based observations of the disk-halo interface in NGC 891 is recovered (e.g., Dettmar, 1990; Rand et al., 1990). However, our high spatial resolution observation reveals an interesting sub-structure that has eluded ground-based observations. There is a pervasive eDIG layer detected. The observed H morphology in NGC 891 is mostly diffuse, suggesting that a break-up of the homogeneous layer may only occur at very faint intensities with associated emission measures of less than 20 . Several faint filaments are detected, which reach very high galactic latitudes kpc. Some of these filaments are very collimated, and show no considerable broadening towards high-. This may indicate, that magnetic fields have a strong influence on those features, and in turn can play a vital role for the transport mechanism. Since we do not see much evidence for the chimney scenario, other mechanisms have to be considered. As dust is also detected at high-, though not spatially correlated with the eDIG on a one to one basis, soft mechanisms for the transport of the dust are favored such as photolevitation (Franco et al., 1991; Ferrara et al., 1991), or possibly magnetic field instabilities (Parker, 1992; Shchekinov et al., 2001). However, which of the processes act as the actual transport of the dust features is not known yet. Whereas the eDIG morphology is smoothly distributed, the dusty ISM phase shows much more sub-structure and is generally very clumpy. In fact, a very intricate network of dust features is observed which shows an irregular pattern. The detected ionized structures (i.e. the supergiant shells) in the galactic midplane - in contrast to the high- dusty filaments - are comparable in size and shape to the Milky Way analogons (e.g., Heiles, 1984; Koo et al., 1992).
One of the key results of our study is that the DIG does not break up into many chimneys at the heights above the disk where we can see it. More specifically, this is true for our spatial resolution and sensitivity limits (5 pc width and a surface brightness above 20 cm-6 pc). This can have various reasons. It is possible that the medium is intrinsically too unorganized (i.e. inhomogeneous) for organized structures like chimneys to survive or to be formed in the first place. That is, the outflow of hot gas occurs mostly through an irregular medium, maybe fractal in nature (e.g., Elmegreen, 1998), such that the energy can get out quickly enough that the expected formation of walls is not happening at all. It has been argued that only in starbursts sufficient energy is produced locally that matter may be piled up in chimneys (Wills et al., 1999).
The lack of correlation of dust and H filaments may also point to a much more chaotic medium than could be modeled in the chimney scenario. On the other hand, the dust appears more filamentary than the H. This could be due to the difference in morphology. We are likely seeing preferentially denser dust features and not the diffuse dust.
Given the sensitivity limit of EM = 20 cm-6 pc, we can roughly estimate to what kind of chimney wall, seen edge-on, this would correspond to. Our spatial resolution limit is 5 pc. For an assumed 20 pc long chimney wall, one needs a medium with a density of = 1 cm-3. This is not regarded as a very dense medium. If the density is to be much higher, the chimney wall would have to be much thinner or the pathlength along it has to be much less than 20 pc. Alternatively, the chimneys might indeed be there, but only closer to the disk, where we cannot see them, possibly due to heavy dust obscuration.
The outflow, as in a starburst galaxy, is dominated by a few major complexes, which we indeed also see below the few longer filaments in NGC 891. These could be chimney walls or remnants of chimney walls. Alternatively, the larger filaments could indicate some large scale magnetic field topology, in which the magnetic field would be responsible for the organization of matter in them, not necessarily the chimneys. In order to vindicate or refute this conjecture, much higher spatial resolution and higher sensitivity radio continuum observations are mandatory.
8.1 Collimated filaments - magnetically confined?
Quite surprisingly, there are these few very narrow filaments discerned, which are well collimated, even at high galactic latitudes. The chimney structures, or at least the walls of chimneys, which would be observationally visible as dust pillars, would show a widening with increasing distance from the galactic midplane. However, we do not see such structures in our H image. Instead, these very collimated long filaments seem to originate from the bright superbubbles in the galactic midplane. In a Milky Way study Haffner et al. (1998) found two very collimated long filaments based on sensitive observations carried out with the Wisconsin H Mapper (WHAM). One of the two faint filaments they discovered is 80° long (corresponding to a length of about 1.2 kpc above the midplane). It has a nearly constant H intensity profile of EM. Although the origin of the filaments is not quite clear, a jetlike ejection from the CMa R1/OB1 association has been speculated, but other mechanisms seem possible too (Haffner et al., 1998). So it may well be that the filaments seen in the Milky Way and those identified by us in NGC 891 have a similar, yet unknown origin.
In a study of NGC 891 by Scarrott & Draper (1996) they used optical polarization measurements and they found vertical magnetic fields in the halo region above the inner part (i.e. the bulge region). They speculated about an optical spur like the North Galactic Spur known in the Milky Way (Mathewson & Ford, 1970). However, optical polarization measurements faces challenges, as it might be difficult, if possible at all, to disentangle whether the polarization is due to grain alignment or by dust scattering. Quite interestingly, the maximum polarization vector (perpendicular to the disk) in these observations (Scarrott & Draper, 1996) is close to the position above our detected supergiant shell, from which the collimated features rise into the halo.
9 SUMMARY
We have presented new high spatial resolution narrowband observations of eDIG in the nearby edge-on galaxy NGC 891, obtained with the WFPC2 on-board HST. A region 6.9 kpc kpc in size, centered on the northeastern part of NGC 891, was investigated. An extraplanar layer with an extension of at least 1.8 kpc above/below the galactic midplane was found. Superimposed onto this eDIG layer are several filaments and arcs, reaching extraplanar distances of about kpc. A few superthin, and collimated filaments were detected which have a surprisingly high length/width ratio of up to ! Most part of the H emission is diffuse, however, several discrete emission features are detected. Whereas the observed global morphology is validating the results of previous ground-based observations, the high spatial resolution observations reveal local structures that have not been resolved or detected by ground-based optical observations. The mechanisms of the gas and energy transport into the halo cannot be verified without ambiguity, however, the chimney scenario is most likely not responsible for the transport, as no clear structures representing individual chimneys (i.e. the walls of chimneys) have been detected. The highly collimated gaseous filaments suggest an influence by magnetic fields. We have furthermore presented results of yet another constituent of the ISM, in the disk-halo interface of NGC 891, the dust.
Extraplanar dust was detected, and has been analyzed from the unsharp-masked broadband image. The observations reveal extraplanar dust at high galactic latitudes, as previously reported by (Howk & Savage, 1997, 2000). We detected dusty filaments, up to kpc above the galactic midplane. Although there is a correlation observed between the two different ISM constituents, as both constituents are detected in the halo of NGC 891, however, generally no one to one correlation between individual filaments and dust filaments are observed. The dust morphology is twofold. Many dust filaments are aligned perpendicular to the galactic disk, indicating that magnetic fields may play a key role in transporting the dust into the disk-halo interface. Other dusty filaments, however, located mostly at the highest galactic latitudes, are aligned parallel to the disk, which may represent a temporal equilibrium of the dusty ISM phase, possibly transported by soft mechanisms (e.g., photolevitation) into the galactic halo.
The spatial distribution of the soft X-ray emission in the halo of NGC 891, as revealed by Chandra, is in good agreement with our H observations. There are two local maxima of X-ray emission in the halo, where also the diffuse H emission is strongest.
References
- Alton et al. (1998) Alton, P. B., Bianchi, S., Rand, R. J., Xilouris, E. M., Davies, J. I., & Trewhella, M. 1998 ApJ, 507, L125
- Birk et al. (1998) Birk, G.T., Lesch, H., & Neukirch, T. 1998, MNRAS, 296, 165
- Böker et al. (1999) Böker, T., Calzetti, D., Sparks, W., Axon, D., Bergeron, L. E., Bushouse, H., et al. 1999, ApJS, 124, 95
- Bregman & Pildis (1994) Bregman, J. H., & Pildis, R. A. 1994, ApJ, 420, 570
- Cecil et al. (2001) Cecil, G., Bland-Hawthorn, J., Veilleux, S., & Filippenko, A. V. 2001, ApJ, 555, 338
- Cecil et al. (2002) Cecil, G., Bland-Hawthorn, J., & Veilleux, S. 2002, ApJ, 576, 745
- Ciardullo et al. (1991) Ciardullo, R., Jacoby, G. H., & Harris, W. H. 1991, ApJ, 383, 487
- Chevalier & Clegg (1985) Chevalier, R. A., & Clegg, A. W. 1985, Nature, 317, 44
- Collins et al. (2000) Collins, J. A., Rand, R. J., Duric, N., & Walterbos, R. A. M. 2000, ApJ, 536, 645
- Dahlem et al. (1994) Dahlem, M., Dettmar, R.-J., & Hummel, E. 1994, A&A, 290, 384
- de Avillez (2000) de Avillez, M. A. 2000, MNRAS, 315, 479
- Dettmar (1990) Dettmar, R.-J. 1990, A&A, 232, L15
- Dettmar & Schulz (1992) Dettmar, R.-J., & Schulz, H. 1992, A&A, 254, L25
- Domgörgen & Mathis (1994) Domgörgen, H., & Mathis, J. S. 1994, ApJ, 428, 647
- Dove & Shull (1994) Dove, J. B., & Shull, J. M. 1994, ApJ, 430, 222
- Elmegreen (1998) Elmegreen, B. G. 1998, PASA, 15, 74
- Ferguson et al. (1996a) Ferguson, A. M. N., Wyse, R. F. G., & Gallagher, J. S. 1996a, AJ, 112, 2567
- Ferguson et al. (1996b) Ferguson, A. M. N., Wyse, R. F. G., Gallagher, J. S., & Hunter, D. A. 1996b, AJ, 111, 2265
- Ferrara et al. (1996) Ferrara, A., Bianchi, S., Dettmar, R.-J., & Giovanardi, C. 1996, ApJ, 467, L69
- Ferrara et al. (1991) Ferrara, A., Ferrini, F., Barsella, B., & Franco, J. 1991, ApJ, 381, 137
- Franco et al. (1991) Franco, J., Ferrini, F., Barsella, B., & Ferrara, A. 1991, ApJ, 366, 443
- Fruchter & Hook (2002) Fruchter, A. S., & Hook, R. N. 2002, PASP, 114, 144
- García-Burillo et al. (1992) García-Burillo, S., Guélin, M., Cernicharo, J., & Dahlem, M. 1992, A&A, 266, 21
- Gaustad et al. (2001) Gaustad, J. E., McCullough, P. R., Rosing, W., & Van Buren, D. 2001, PASP, 113, 1326
- Gerhard et al. (2002) Gerhard, O., Arnaboldi M., Freeman, K. C., & Okamura, S. 2002, ApJ, 580, L121
- Gonzaga et al. (1998) Gonzaga, S., Biretta, J., Wiggs, J. C., Hsu, J. C., Smith, T. E., Bergeron, L., & the STScI WFPC2 group, 1998, The Drizzling Cookbook, Instrument Science Report WFPC2 98-04, STScI
- Haffner et al. (1998) Haffner, L. M., Reynolds, R. J., & Tufte, S. L. 1998, ApJ, 501, L83
- Haffner et al. (2003) Haffner, L. M., Reynolds, R. J., Tufte, S. L., Madsen, G. J., Jaehnig, K. P., & Percival, J. W. 2003, ApJS, 149, 405
- Hambly et al. (1996) Hambly, N. C., Wood, K. D., Keenan, F. P., Kilkenny, D., Dufton, P. L., & Miller, L., et al. 1996, A&A, 306, 119
- Heiles (1984) Heiles, C. 1984, ApJS, 55, 585
- Hoopes et al. (1999) Hoopes, C. G., Walterbos, R. A. M., & Rand, R. J. 1999, ApJ, 522, 669
- Howk & Savage (1997) Howk, J. C., & Savage, B. D. 1997, AJ, 114, 2463
- Howk & Savage (1999) Howk, J. C., & Savage, B. D. 1999, AJ, 117, 2077
- Howk & Savage (2000) Howk, J. C., & Savage, B. D. 2000, AJ, 119, 644
- Kennicutt (1988) Kennicutt, R. C., Jr. 1988, ApJ, 334, 144
- Keppel et al. (1991) Keppel, J. W., Dettmar, R.-J., Gallagher, J. S., III, & Roberts, M. S. 1991, ApJ, 374, 507
- Kilkenny et al. (1995) Kilkenny, D., Luvhimbi, E., O’Donoghue, D., Stobie, R. S., Koen, C., & Chen, A. 1995, MNRAS, 276, 906
- Koo et al. (1992) Koo, B.-C., Heiles, C., & Reach, W. T. 1992, ApJ, 390, 108
- Korpi et al. (1999) Korpi, M. J., Brandenburg, A., Shukurov, A., Tuominen, I., & Nordlund, Å. 1999, ApJ, 514, L99
- Lehnert & Heckman (1995) Lehnert, M. D., & Heckman, T. M. 1995, ApJS, 97, 89
- Mathewson & Ford (1970) Mathewson, D. S., & Ford, V. L. 1970, MmRAS, 74, 139
- Mathis (1986) Mathis, J. S. 1986, ApJ, 301, 424
- Meaburn (1980) Meaburn, J. 1980, MNRAS, 192, 365
- Miller & Veilleux (2003) Miller, S. T., & Veilleux, S. 2003, ApJS, 148, 383
- Miller & Cox (1993) Miller, W. W., III, & Cox, D. P. 1993, ApJ, 417, 579
- Norman & Ikeuchi (1989) Norman, C. A., & Ikeuchi, S. 1989, ApJ, 345, 372
- O’Dell & Doi (1999) O’Dell, C. R., & Doi, T. 1999, PASP, 111, 1316
- Parker (1992) Parker, E. N. 1992, ApJ, 401, 137
- Pildis et al. (1994) Pildis, R. A., Bregman, J. N., & Schombert, J. M. 1994, ApJ, 427, 160
- Rand (1996) Rand, R. J. 1996, ApJ, 462, 712
- Rand (1997) Rand, R. J. 1997, ApJ, 474, 129
- Rand (1998) Rand, R. J. 1998, ApJ, 501, 137
- Rand (2000) Rand, R. J. 2000, ApJ, 537, L13
- Rand et al. (1990) Rand, R. J., Kulkarni, S. R., & Hester, J. J. 1990, ApJ, 352, L1
- Reynolds (1984) Reynolds, R. J. 1984, ApJ, 282, 191
- Reynolds et al. (2001) Reynolds, R. J., Sterling, N. C., Haffner, L. M., & Tufte, S. L. 2001, ApJ, 548, L221
- Rossa & Dettmar (2000) Rossa, J., & Dettmar, R.-J. 2000, A&A, 359, 433
- Rossa & Dettmar (2003a) Rossa, J., & Dettmar, R.-J. 2003a, A&A, 406, 493
- Rossa & Dettmar (2003b) Rossa, J., & Dettmar, R.-J. 2003b, A&A, 406, 505
- Rupen (1991) Rupen, M. P. 1991, AJ, 102, 48
- Ryan-Weber et al. (2004) Ryan-Weber, E. V., Meurer, G. R., Freeman, K. C., Putman M. E., Webster, R. L., & the SINGG team 2004, AJ, 127, 1431
- Scarrott & Draper (1996) Scarrott, S. M., & Draper, P. W. 1996, MNRAS, 278, 519
- Shapiro & Field (1976) Shapiro, P. R., & Field, G. B. 1976, ApJ, 205, 762
- Shchekinov et al. (2001) Shchekinov, Yu. A., Dettmar, R.-J., Schröer, A., & Steinacker, A., 2001, Astron. and Astrophys. Transact., 20, 237 (see also astro-ph/0102164)
- Slavin et al. (1993) Slavin, J. D., Shull, J. M., & Begelman, M. C. 1993, ApJ, 407, 83
- Strickland et al. (2004a) Strickland, D. K., Heckman, T. M., Colbert, E. J. M., Hoopes, C. G., & Weaver, K. A. 2004a, ApJS, 151, 193
- Strickland et al. (2004b) Strickland, D. K., Heckman, T. M., Colbert, E. J. M., Hoopes, C. G., & Weaver, K. A. 2004b, ApJ, 606, 829
- Swaters et al. (1997) Swaters, R. A., Sancisi, R., & van der Hulst, J. M. 1997, ApJ, 491, 140
- Thilker et al. (2002) Thilker, D. A., Walterbos, R. A. M., Braun, R., & Hoopes, C. G. 2002, AJ, 124, 3118
- Tüllmann et al. (2000) Tüllmann, R., Dettmar, R.-J., Soida, M., Urbanik, M., & Rossa, J. 2000, A&A, 364, L36
- Tüllmann et al. (2003) Tüllmann, R., Rosa, M. R., Elwert, T., Bomans, D. J., Ferguson, A. M. N., & Dettmar, R.-J. 2003, A&A, 412, 69
- van den Bergh (1992) van den Bergh, S. 1992, PASP, 104, 861
- Wada (2001) Wada, K. 2001, ApJ, 559, L41
- Wada & Norman (1999) Wada, K., & Norman, C. A. 1999, ApJ, 516, L13
- Wada & Norman (2001) Wada, K., & Norman, C. A. 2001, ApJ, 547, 172
- Walterbos & Braun (1994) Walterbos, R. A. M., & Braun R. 1994, ApJ, 431, 156
- Wang et al. (2001) Wang, Q. D., Immler, S., Walterbos, R. A. M., Lauroesch, J. T., & Breitschwerdt, D. 2001, ApJ, 555, L99
- Wills et al. (1999) Wills, K. A., Redman, M. P., Muxlow, T. W. B., & Pedlar, A. 1999, MNRAS, 309, 395