Deep near-infrared spectroscopy of submillimetre-selected galaxies
Abstract
We present the results of deep near-infrared spectroscopy of seven submillimetre-selected galaxies from the SCUBA 8-mJy and CUDSS surveys. These galaxies were selected because they are too faint to be accessible to optical spectrographs on large telescopes. We obtain a spectroscopic redshift for one object, and likely redshifts for two more, based on a combination of marginal emission line detections and the shape of the continuum. All three redshifts broadly agree with estimates from their radio/submm spectral energy distributions. From the emission line strengths of these objects, we infer star formation rates of 10–25 M, while the lack of detections in the other objects imply even lower rates. By comparing our results with those of other authors, we conclude it is likely that the vast majority (more than 90 per cent) of the star formation in these objects is completely extinguished at rest-frame optical wavelengths, and the emission lines originate in a relatively unobscured region. Finally, we look at future prospects for making spectroscopic redshift determinations of submm galaxies.
keywords:
galaxies: distances and redshifts – galaxies: evolution – galaxies: formation – galaxies: starburst – cosmology: observations – infrared: galaxies1 Introduction
The resolution of the majority of the extragalactic submillimetre (submm) background into individual sources (Blain et al. 1999) has made it possible, in principle, to study the redshift distribution of these sources and hence investigate the history of obscured star formation in the Universe. Such investigations are important to compare the star formation which occurs in obscured sources with that which takes place apparently unobscured, e.g., in the Lyman break galaxies identified by Steidel, Pettini & Hamilton (1995). Although the similar strengths of the extragalactic optical and submm backgrounds suggest that obscured and unobscured star formation occur in roughly equal quantities (Hauser et al. 1998), the more detailed relationship between the populations of galaxies within which these processes occur is unclear. Are they coeval populations, or are each of them the dominant mode of star formation at a particular cosmic epoch?
Spectroscopy of submm-selected sources has proven difficult and time-consuming, and has led to the emergence of an industry to estimate redshifts using template SEDs which cover the wavelength range from the far-infrared to the radio. Since the initial work by Carilli & Yun (1999, 2000), the technique has been adapted by Dunne, Clements & Eales (2000), Rengarajan & Takeuchi (2001), Yun & Carilli (2002), and Hughes et al. (2002). Often these estimates disagree strongly, however (see, e.g., Section 5 of this paper), due to differences in the assumed spectral energy distribution templates, and this only increases the need for spectroscopic measurements.
There are two main issues which make it difficult to obtain spectroscopy of these objects. The first of these arises because the spatial resolution of the Submillimetre Common User Bolometer Array (SCUBA) is rather poor ( FWHM), leading to a number of optical/infrared counterparts within the source error circle. The case of HDF 850.1, the brightest submm source in the Hubble Deep Field, serves as a good example (Hughes et al. 1998; Downes et al. 1999; Dunlop et al. 2004). To obtain an accurate position requires sensitive observations with an interferometer at millimetre or centimetre wavelengths in order to achieve the arcsecond resolution necessary to make an unambiguous identification.
The second difficulty arises after an accurate position has been determined. In many cases, the correct identification is extremely faint and may require deep imaging observations to be identified. Ivison et al. (2002; hereafter I02) report the optical/IR continuum characteristics of a relatively bright submm sample, having refined most of their positions via deep radio imaging. A large fraction was shown to be sufficiently bright for spectroscopy on large telescopes, as later demonstrated using the LRIS-B UV/optical spectrograph on the Keck telescope (Chapman et al. 2003). The tendency for the optical/IR counterparts to be diffuse and/or multiple (“composite red/blue galaxies”; I02) means that the fraction of light transmitted by a spectroscopic slit is low compared to, say, a Lyman-break galaxy of similar magnitude. Continuum magnitudes are not a reliable indicator of likely success, however, if targets display strong emission lines, as many have been shown to do, including several with (we use Vega magnitudes throughout). Nevertheless, the ability to detect continuum emission with a reasonable signal-to-noise ratio is essential if emission lines are weak or lie outside the available wavelength coverage, and conclusions about the underlying stellar population can only be drawn if there is sufficient signal-to-noise ratio in the continuum to detect breaks and/or stellar absorption feautures. Given the optical faintness and frequent red colours of these sources, sensitive near-infrared spectroscopy may prove to be a fruitful avenue for sources where optical spectroscopy has proven unsuccessful.
In this paper, we present the results from deep near-IR spectroscopy of a sample of submm galaxies, made with the extremely sensitive OHS instrument on Subaru Telescope. The format is as follows. In Section 2, we describe the selection of our sample and our observations, and in Section 3, we detail the careful data reduction procedures required to extract maximum sensitivity from these faint objects. Section 4 presents our results, while in Section 5 we describe the spectra of individual objects in detail. We discuss our results in Section 6, and speculate on future prospects for obtaining complete spectroscopic redshifts for submillimetre samples in Section 7. Finally, we summarize our results and conclusions in Section 8. Throughout this paper, we adopt , , and .
2 Sample selection and observations
Our sample of targets was taken from the SCUBA 8-mJy Survey of the Lockman Hole East and ELAIS N2 fields (Scott et al. 2002; Fox et al. 2002) and the Canada–UK Deep Submillimetre Survey (CUDSS) 14-hour field (Eales et al. 2000; Webb et al. 2003). We selected only targets which had been securely identified through follow-up radio observations which were able to provide sufficient astrometric accuracy to isolate a single object111ELAIS N2 850.12 was not formally detected in the radio, though I02 note that the combination of its red colour and the presence of several 3 radio peaks makes the identification reasonably secure.. Furthermore, we selected targets for which the identification had very red optical/IR colours (see I02), so as to exclude galaxies for which optical spectroscopy might be expected to be more successful. The sample is therefore by no means complete, and was constructed to test the limits of the most sensitive near-infrared spectrograph currently available on any telescope and assess the likely success of future IR spectroscopy.
Galaxies were observed with the OH-airglow suppressor (OHS; Iwamuro et al. 2001) and the Cooled Infrared Spectrograph and Camera for OHS (CISCO; Motohara et al. 2002) on Subaru Telescope during the period UT 2002 May 20–24. OHS is a spectroscopic filter which eliminates 224 strong OH airglow lines in the and bands from a region of sky and outputs an undispersed beam which is then fed to CISCO to enable images or spectra to be taken. The broad-band sky background in this suppressed region (the ‘dark lane’) is reduced by a factor of , enabling the acquisition of extremely faint targets. Conditions were clear for all the observations presented here, and the optical seeing was measured to be 0.5–0.7 arcsec from the auto-guider camera.
Each target was observed in an identical manner. First, a nearby offset star was acquired and centred in the OH-suppressed ‘dark lane’, using CISCO in imaging mode with an -band filter. The telescope was then moved according to the offset between this star and the target, as measured from existing near-IR images. The location of the target on the array was then determined by nodding the telescope along the slit and taking images at each position, the number and length of which depended on the expected magnitude of the target. The images were combined to remove the sky background and allow the target to be seen. If the target was not within the dark lane, an appropriate telescope offset was applied and the process repeated until an accurate centroid could be determined. A small offset was then applied using the autoguider camera to move the target into the centre of the dark lane. The spectrograph slit was then closed to 1 arcsec and aligned with the dark lane, and the JH grism inserted into the light path. Eight exposures were then taken in two quads using the standard ‘ABBA’ technique (e.g. Eales & Rawlings 1993), with exposure times of 900 or 1000 seconds per position. The offset between positions was usually 10 arcsec, although we chose to align the slit to include any nearby objects and a smaller offset was used if the the standard value would cause confusion between the beams. In some cases, a small offset along the slit was applied between the two quads. When these exposures had finished, the telescope was slewed to a nearby atmospheric ratioing standard which was acquired without opening the slit by making small telescope movements perpendicular to the slit position angle until the count rate from the star was sufficiently high. The stars used were HIP 52256, HIP 71078, and HIP 80419 (Perryman et al. 1997) for the Lockman Hole, CUDSS 14-h, and ELAIS N2 fields, respectively. Eight exposures (of 5–10 seconds each) were taken in a single quad with two frames per position.
Observations were also made of argon and neon calibration lamps and the planetary nebula NGC 7027, to provide wavelength calibration and to measure the spectral resolution of the instrument. These observations were made with a 0.5-arcsec slit to more allow a more accurate determination of the locations of the emission lines. No shifts were found in the location of any spectral features, or in the locations of the unsuppressed night-sky lines, during the course of the run. An observing log is presented in Table 1.
| PA | Exposure (s) | |||
|---|---|---|---|---|
| Name | UT Date | (∘) | Imaging | Spectroscopy |
| LE 850.1 | 2002 May 23 | 167 | ||
| LE 850.3 | 2002 May 20 | 43 | ||
| CUDSS 14.1 | 2002 May 20 | 90 | ||
| CUDSS 14.3 | 2002 May 24 | 118 | ||
| CUDSS 14.9 | 2002 May 21 | 63 | ||
| ELAIS N2 850.2 | 2002 May 23 | 30 | ||
| ELAIS N2 850.12 | 2002 May 24 | 82 | ||
3 Data reduction
The low level of signal coming from the extremely faint targets (we stress that our targets are producing detector signals of about 1 electron per pixel per minute, which is less than the detector dark current) makes it imperative to remove all detector artefacts. To do this, we first subtracted one image from each pair from the other to remove the contribution from the dark current. Next, any differences in bias level between the four quadrants of the detector were removed by determining the signal in unexposed regions of each quadrant and subtracting this constant value from all the pixels in that quadrant. Variance images for each combined pair were constructed based on the raw pixel values in the original images and the detector read noise. Residual sky lines were removed by fitting a low-order function to the columns of the images, excluding any regions contaminated by objects. The two pairs in each quad were then combined, by a straight average if the pixel values in each pair were consistent at the level, or by the value closest to zero if they were not. Next, the image was shifted by an amount equal to the offset between the positive and negative beams and this shifted image was subtracted from the original, with further rejection of deviant pixels. The variance images were combined in a statistically-appropriate manner. Then the two quads were combined and spectra of all objects extracted in 1-arcsec (9-pixel) apertures. The pixel-by-pixel uncertainty on this spectrum was determined from the variance image, although this is likely to underestimate the true noise level in regions of strong sky emission where the sky level may not be accurately determined.
Spectra of the atmospheric ratioing standards were obtained by simply averaging all the spectral images taken in the ‘A’ position and subtracting the average of the spectral images taken in the ‘B’ position. This image was shifted to align the two beams and subtracted from the original version of itself. A spectrum was extracted in a 1-arcsec aperture.
A quadratic wavelength solution was determined from the arc and planetary nebula spectra and applied to all the spectra. The r.m.s. deviation of the individual emission lines from the fit was Å (approximately 1 pixel). Model spectra of the standard stars were constructed assuming they could be described by blackbodies with effective temperature and -band magnitudes determined from the -band magnitudes and spectral types listed in the HIPPARCOS catalogue (Tokunaga 2000). Spectra of the targets in flux units were then determined by dividing each target spectrum by the appropriate atmospheric standard spectrum and multiplying by the model blackbody. Since the standard stars were chosen to be close in the sky to the targets, their airmasses at the time of observation are similar to those of the target at the end of its observation, rather than an average target airmass. This may result in imperfect removal of atmospheric absorption features.
The absolute flux calibration of the targets was determined from the acuqisition imaging. Images at each of the two positions were combined and then subtracted from each other. This image was then shifted to align the two beams and subtracted from the original version of itself. Photometry was performed in a 1-arcsec square aperture and therefore the flux scale of the final spectra represents the amount of light in the extraction aperture. The uncertainty in the photometry was estimated by fitting separate Gaussians to sigma-clipped, logarithmically-scaled histogram of the pixel values both inside and outside the dark lane. The instrumental zeropoint of the photometry was tied to observations of the UKIRT Faint Standards FS 27 and FS 146 (Hawarden et al. 2001), taken at the end of the last night. Any systematic uncertainties in the absolute calibration introduced by only taking such images at one point during the run are likely to be dwarfed by the 10–20 per cent random uncertainties in the target photometry. In cases where more than one object was in the spectrograph slit, the flux scale was tied to the brightest object.
Inevitably, we expect some spurious features from ‘warm’ pixels which are not rejected by our rejection algorithm, since this algorithm needs to be conservative to avoid throwing out a large amount of good data (in addition, the rejection limits need to be loose enough to not flag a change in the signal which is the result of changes in the seeing and/or atmospheric transparency). The reduced two-dimensional spectra are therefore used to determine the veracity of any putative emission lines, by determining whether they arise from only one of the two beams.
4 Results
The fwhm of the arc lamp and planetary nebula lines was measured to be 35–40 Å, indicating that the object spectra will have a spectral resolution of . This is consistent with directly-made measurements of the resolution obtained with a 1-arcsec slit (e.g. Willott et al. 2003), and means that any emission lines will be unresolved. The low resolution of the spectrum allows us to reject as spurious some features which might at first glance appear real (especially in the smoothed spectra presented in Fig. 1). This is important because the large number of pixels means that we have a per cent chance of finding a ‘emission line’ simply by chance. This probability is reduced by a factor of about 2 by excluding those ‘lines’ where the flux is dominated by a small number of errant pixels. On the other hand, it is almost inevitable that each spectrum will contain at least one emission feature which is formally significant at the level, and we must treat such marginal ‘detections’ with extreme caution.
We can therefore only consider redshifts to be plausible if they are determined from a single, highly significant line, or from two or more less significant detections whose relative wavelengths correspond to a plausible pair of features. To detect such features, we use a 51-pixel running median to estimate the continuum level, and then search for groups of 9 pixels (i.e. Å, or approximately the resolution FWHM) whose total deviation from this continuum has a signal-to-noise ratio larger than a certain threshold, which was set at 2.2 after some experimentation. Once features had been detected in this manner, the 2D spectrum was examined to ensure that they were not the result of poor sky subtraction or low-level cosmic rays which had not been removed by the rejection algorithm. Not all detections are listed therefore in Table 2, where we summarize the results of our analysis, although we only exclude those features which are clearly spurious. The detections are described in detail on an object-by-object basis in the next section. It is important to note that the uncertainties quoted for the line fluxes are derived solely from the detector read noise and photon shot noise, and do not take into consideration the effects of improper sky subtractor or the placement of the continuum. Incorrectly determining the continuum by as little as (see Fig. 1) will cause the measured line flux to be in error by , which is typically 20–40 per cent of the flux. We therefore warn against any interpretation of line ratios, which are often substantially different from those expected. Even though in some cases the median appears by eye to be wrong (and will always be slightly biased by the presence of the detected line), any ‘by eye’ estimate is likely to be just as wrong, so we choose to fix the continuum at the level derived by the running median, which at least has the advantage of being non-subjective. The line centres are determined from a simple centroiding of those pixels above the continuum level, and typically have an accuracy of –20 Å which, when combined with the residuals from the wavelength solution fit, imply uncertainties of in each individual redshift measurement.
Given the marginal nature of our line detections, we investigate the probability of obtaining false redshifts from our data. We first produce 100 artificial spectra from each of the ten noise spectra (seven objects, plus three companions), by multiplying the noise spectrum by a spectrum of random numbers drawn from a Normal distribution. We apply our line detection algorithm to each of these spectra, again rejecting those detections which are not consistent with unresolved lines. Using the detection threshold, we find that most spectra produce one or two spurious features, but there is a pronounced tail, and 3 per cent of our spectra produce five features. While this may seem like cause for alarm, the fact that we require more than half of the detected features to correspond to plausible lines (and be absorption or emission features as appropriate) makes it extremely unlikely that we will derive a redshift from five randomly-located lines.
We investigate two distinct ways in which we can derive an erroneous redshift. First, the redshift can be produced from entirely spurious lines. This is not possible unless there are at least two lines, and in this case the redshifts derived from their identifications must agree to within 0.015 (for the case of three spurious lines, we require that the redshifts from any pair agree, while for the cases of four or five spurious lines, we require that consistent redshifts are derived from a triplet). These probabilities can be calculated directly from our 1000 spectra, and amount to 10 per cent. Second, an erroneous redshift can be produced from a single real line, plus one or more spurious lines. To calculate this probability requires a priori knowledge of the probability of there being a genuine feature at a given wavelength. If we assume that the genuine emission line has an equal probability of appearing at any point in the spectrum, then the probability of an erroneous redshift is 20 per cent, multiplied by the a priori probability that there is a genuine line in the or bands. The most likely cause of an erroneous redshift arises from cases where three lines are detected, and a pair of them correspond to plausible features.

| Flux | ||||
| Object | () | () | Identification | |
| LE 850.1 | 1.1544 | |||
| 1.2440 | ||||
| 1.5998 | ||||
| LE 850.3 | 1.1627 | [O ii] 3727 | 2.120 | |
| 1.5993 | spurious | |||
| CUDSS 14.1 | 1.2994 | |||
| 1.6675 | See text | |||
| 1.7227 | for discussion | |||
| 1.7543 | ||||
| CUDSS 14.3 | Nothing detected | |||
| CUDSS 14.9 | 1.5216 | Ca K? | 2.869 | |
| 1.5374 | Ca H? | 2.874 | ||
| N2 850.2 | 1.2889 | [O ii] 3727 | 2.458 | |
| 1.5637 | spurious | |||
| 1.5751 | spurious | |||
| 1.6777 | H | 2.451 | ||
| 1.7091 | [O iii] 4959 | 2.446 | ||
| 1.7304 | [O iii] 5007 | 2.456 | ||
| N2 850.12 | 1.5722 | spurious | ||
| 1.6678 | H | 2.431 | ||
| 1.7125 | [O iii] 5007 | 2.420 | ||
| Companion objects | ||||
| CUDSS 14.3 | Nothing detected | |||
| N2 850.2 | 1.1700 | |||
| N2 850.12 | Nothing detected | |||
5 Notes on individual objects
In this section, we describe our redshift determinations based on the data in Table 2. We list all plausible emission lines, even if they do not provide a definitive redshift measurement, so that our data may be of use if an independent redshift determination supports the reality of these lines. We deliberately refrain from making subjective comments on the relative believability of any lines in a given spectrum.
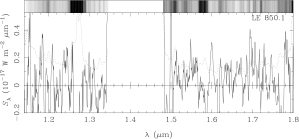
5.1 LE 850.1
Due to the extremely faint and diffuse nature of this source, it took a substantial amount of imaging on the night of UT 2002 May 21 to make a firm imaging detection. Although by the time we had done so, the hour angle of the source was no longer favourable, we confirmed the offsets from a nearby star as being 11.6 arcsec west and 5.2 arcsec south. We returned to LE 850.1 two nights later, and used our previous imaging to hasten the acquisition. Since the distance between the target and offset star is larger than the OHS field of view, we first located the bright star near the end of the field of view, and made a small (2 arcsec) movement of the telescope by altering the location of the centroiding box on the autoguider camera. The success of this technique depends on the accuracy to which the plate scales of CISCO and the AG camera are known, and we estimate the error to be no more than 0.2 arcsec. Since we were unable to obtain reliable photometry from our acquisition image, we applied the same flux scaling factor for LE 850.1 as was applied for LE 850.3; from the flux in the ‘clean’ part of our -band spectrum (1.60–1.70 m), we estimate in our extraction aperture.
Three emission lines are suggested by our line-finding algorithm, although all are extremely marginal. No pair of these lines corresponds to plausible features, and so we must conclude that at least two, and possible all three, of the lines are spurious. However, given that it is three times more likely for there to be only two spurious lines, rather than three, we consider it probably that one of the lines is real. The redshift estimate of (model ‘le2’ of Aretxaga et al. 2003; hereafter A03) suggests that either of the bluest two lines could be [O ii] (at or ), but we are unable to assign a redshift from our data.
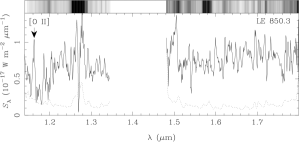
5.2 LE 850.3

This source is the brightest of our targets in the -band ( in our extraction aperture) and has relatively good signal-to-noise in the clean parts of the spectrum. Our detection algorithm produces two emission lines, both at marginal () significance. The lines do not correspond to any plausible pair of transitions, but we note the presence of a clear continuum break at m. We confirm the reality of this break by subtracting the spectrum of blank sky at a distance of 1.5 arcsec along the slit (extracted in an identical 1-arcsec aperture). If we identify this break as the Balmer jump, then the bluer of the two emission lines is [O ii] at , consistent with the radio–submm estimate of I02).
Fig. 3 shows the near-IR spectrum of LE 850.3 (shifted to the rest frame), overlaid with a synthetic starburst model (from the PEGASE code of Fioc & Rocca-Volmerange 1997). This model has an decaying star-formation rate with an -folding time of 100 Myr and is seen at an age of 250 Myr. It has been reddened by , according to Pei’s (1992) parametrization of the Milky Way extinction law. Although this is not a fit, it provides a reasonable description of the observed continuum. The presence of a strong Balmer jump requires that the rest-frame 4000-Å light be dominated by yr-old stars, although this may be because younger stars are more heavily obscured (rather than because the star-formation rate is decaying with time, as in our simple model). The reasonable fit that this model provides to the spectrum gives us confidence in assigning a redshift of to this source, even though it is rather inconsistent with the estimate of of A03.
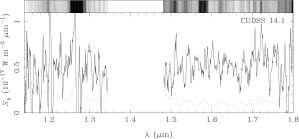
5.3 CUDSS 14.1
This source (also known as CUDSS 14A) was the subject of intense study by Gear et al. (2000). High-resolution Hubble Space Telescope and ground-based (Canada–France–Hawaii Telescope) adaptive optics images reveal it to be a red, compact galaxy. Deep near-IR JHK spectroscopy by Gear et al. failed to detect any emission lines to a level of 1–. Our new spectroscopy pushes this limit almost an order of magnitude fainter, but fails to find any significant () lines. We detect four features (three emission lines, and one absorption line) of marginal significance, however.
The measured wavelengths of the bluest and reddest emission lines are consistent with being H and H, respectively, at . In this interpretation, the third emission line and the absorption line are artefacts. Alternatively, these two lines could be [O ii] at and [O iii] 5007 at ; although this redshift discrepancy is large, it is not implausible given the low signal-to-noise ratios of the detections. With these identifications, the third emission line could be 4959 at , which is barely consistent with the redshift from the other two lines, while the absorption feature is, again, spurious. The lower redshift is consistent with both the photometric redshift estimate of and the radio–submm redshift estimate of (Clements et al. 2004; hereafter C04). We note, however, that A03 suggest a much higher redshift of , which is just consistent (at the 90% level) with both the above sets of line identifications. If this redshift is correct, then one of the -band emission lines could be [O ii] at , while the remaining three features would be artefacts (possibly the 1.2994-m line could be Mg ii 2798 at if the 1.7227- line is [O ii] at , but Mg ii is not expected unless there is an AGN present). Ultimately, we decide against assigning a spectroscopic redshift to this object.
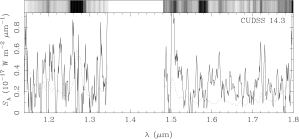
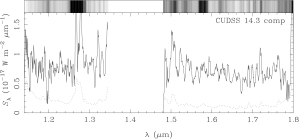
5.4 CUDSS 14.3
Apart from a spurious peak due to poor subtraction of the unsuppressed OH lines in the range 1.50–1.52 m, there are no significant features in the spectrum of this faint () object. A brighter, slightly bluer object is located approximately 2 arcsec west and slightly north of CUDSS 14.3 (fig. 4 of Webb et al. 2003), whose spectrum is similarly featureless (Fig. 2). We are unable to obtain a redshift for either object. We note that both the photometric and radio–submm redshift estimates of C04 are , at which redshift no strong emission lines would lie within our spectral coverage (H would fall between the and spectroscopic windows). A03 obtain a much higher redshift estimate (), which would place the [O ii] line somewhere between the 1.27-m O2 night sky emission and the long-wavelength end of our spectral coverage, and it could therefore easily fall between the and windows, or near the blue end of the -band where the poor sky subtraction affects our sensitivity.
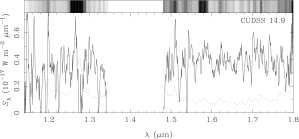
5.5 CUDSS 14.9
The spectrum of CUDSS 14.9 () bears a remarkable similarity to that of LE 850.3, with an apparent break in the continuum around m. However, the spectrum is noisier and the break is weaker – if we make an ad hoc definition od the break strength as , we measure for CUDSS 14.9, compared to for LE 850.3 (or after removal of the [O ii] line).
Two lines are detected by our algorithm; absorption features at 1.5216 and 1.5374 m with observed equivalent widths of Å and Å, respectively. The wavelengths of these lines are consistent with the Ca H+K lines at . We are hesitant about assigning this redshift, however, since there is no clear continuum break associated with the absorption lines (although there is insufficient coverage to the blue of them to make an accurate measurement of the continuum level) and the redder of the two features is affected by a night sky emission line. Furthermore, this redshift is inconsistent with C04’s photometric and radio–submm estimates of and , respectively, although it agrees with A03’s estimate of . If our spectroscopic measurement is correct, however, none of the strong rest-frame optical emission lines associated with star formation (H, H, [O ii]) would lie within a spectroscopic window.
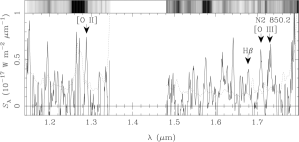
5.6 ELAIS N2 850.2
The identification for this source is extremely faint ( in our spectroscopic aperture) and the continuum is only seen in our 2D spectrum after substantial smoothing. The location of the extraction apertures were determined from the acquistion image. Five plausible emission features (one of which is detected at ) and one absorption feature are detected by our algorithm, although the absorption feature is close to one of the emission lines and may result from imperfect subtraction of the 1.58-m sky emission. The other four emission lines, however, are consistent with a redshift . This redshift is consistent with tha lack of formally-detected continuum in the -band, since the 4000-Å break will lie between the and atmospheric windows, and also with the redshift estimates of I02 and A03. It also agrees well with the optical redshift of 2.454 (Chapman et al., in preparation).
Our spectroscopic slit was aligned to pass through a galaxy 2 arcsec south–southeast of ELAIS N2 850.2 (fig. 2 of I02). This source shows faint continuum in the clean part of the -band (m; the continuum is more clearly seen in the smoothed 2D spectrum than in Fig. 2) but this does not rule out its being at the same redshift as the submm source, since it is brighter ( in our aperture). There is a single marginally-detected emission line at 1.1700 m; if real, this would mean that the ‘companion’ is not physically associated with the submm source, since it does not correspond to any known emission line at the redshift of the submm source.
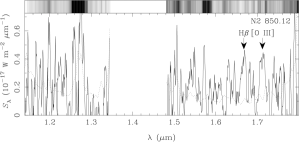
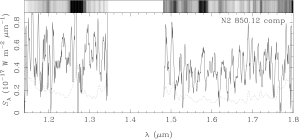
5.7 ELAIS N2 850.12
This identification for this source is also very faint () and the signal-to-noise ratio of our spectrum is low. However, we find three emission lines, of which we identify two as H and [O iii] 5007 at (the absence of detectable [O iii] 4959 is simply due to its low flux). This redshift is also consistent with the lack of continuum at the red end of the -band, since it places the 4000-Å break at m (we note, however, that continuum is detected at the level in the ‘clean’ part of the -band (1.20–1.25 m). At this redshift, the [O ii] 3727 emission line would lie at m, where our sensitivity is low () due to the O2 night-sky emission; its non-detection is therefore not at odds with a ratio [O ii]/H (e.g. Kennicutt 1998), especially if there is some reddening. We note that this redshift is unexpectedly low, given the high ratio of submm to radio flux, though this inconsistency can be understood if the handful of 3 radio peaks noted by I02 are the relics of a diffuse radio source. Since this redshift is derived from two of three detected lines, it should be treated with caution, although it gains some support from the fact that there is positive flux at the expected position of [O ii] (formally, the value is ), and from the relatively high significance of the line at 1.7125 m ().
Our spectroscopic slit was aligned to pass through a second object located approximately 7 arcsec west of N2 850.12 (on the edge of the postage stamp shown in fig. 2 of I02). This object is brighter () and bluer and our algorithm failed to detect any emission lines in its spectrum (see Fig. 2). We cannot say whether it is physically associated with the submm galaxy.
6 On the absence of emission lines
Given the extreme star-formation rates implied by the submm luminosities of these objects and our extensive wavelength coverage, the lack of strong emission lines is perhaps a surprise. A star-formation rate of (typical of these objects; Ivison et al. 1998; Gear et al. 2000) corresponds to an H luminosity W (Kennicutt 1998), and we assume H/H (Case B; e.g. Osterbrock 1989) and H/[O ii (Kennicutt 1992). These lines should all be well above our detection threshold (see Fig. 4). In fact, in the absence of any extinction, our 2-hour integrations should be sensitive to star-formation rates as low as out to , although there is a gap in our coverage between when [O ii] lies in the gap between the and atmospheric windows. This gap could be significant since it lies close to the peak in the redshift distribution, , presented by Chapman et al. (2003), based on optical spectroscopy of bluer radio-detected submm galaxies.

We have redshifts for only three of our seven targets. Taken at face value, the measured line fluxes of LE 850.3, N2 850.2, and N2 850.12 correspond to star-formation rates of , , and , respectively, well below the estimates from the radio–submm data (I02). Such large discrepancies are not unusual; for example, in the extremely red object HR 10 (Hu & Ridgway 1994), the raw (i.e. uncorrected for extinction) H-derived star-formation rate is a factor of lower than that derived from the submm flux (Cimatti et al. 1998; Dey et al. 1999). The two rates can be reconciled by appealing to substantial quantities of dust which severely attenuate the observed line emisison. In all three cases, the emission-line-derived star-formation rate can be rectified with the submm–radio-derived SFR if the emission lines are extinguished by –4 mag (compared to the mag needed in HR 10222Dey et al. (1999) claim that a simple foreground dust screen is inapproriate because it would imply an intrinsic ratio of [O ii]/H, which they claim is “at the extreme limit of observed values for local star-forming galaxies (e.g., Kennicutt 1992).” However, Fig. 12 of Kennicutt (1992) indicates that this ratio is quite normal, since the data plotted are uncorrected for reddening (a correction factor of ) or [N ii] contamination ().). Slit losses are unlikely to account for more than a factor of about 2 in our line fluxes since our slit width corresponds to a linear size of 8 kpc, which is large for a starburst region (Smail et al. 2003). Furthermore, the radio emission is not observed to be extended on scales much larger than this.
Arguing against a foreground screen hypothesis is the detection of Ly emission in submillimetre galaxies (Chapman et al. 2003). The measured fluxes correspond to star formation rates of , broadly in line with our measurements, while a foreground screen with would produce at least four orders of magnitude of extinction at Ly and completely suppress the line. The consistency between the UV and optical star formation diagnostic lines therefore suggests that we are seeing a small fraction ( per cent) of the star formation in a relatively unobscured way, while the vast majority is completely extinguished at optical/UV wavelengths. Some obscuration is still required since a SFR at produces an observed (Leitherer, Robert, & Heckman 1995), which is brighter than our targets (I02; C04). This picture is quite reasonable, since massive stars are formed in the local Universe inside the cores of dense molecular clouds, and the Myr it takes for these stars to disperse their parent clouds is longer than the lifetimes of stars with –20 M⊙ (see discussion in Jimenez et al. 2000). Jimenez et al. suggest that the observed flux of far-ultraviolet photons represents only about one-sixth of the total star formation, and the observed line emission should also underestimate the true star formation rate by a similar factor if the massive stars are heavily obscured. Larger discrepancies are possible if the starburst is younger than 15 Myr since even the longer-lived stars are embedded in their parent clouds.
An alternative hypothesis which warrants investigation is that the star formation rates derived from the submm observations are substantially overestimated. The most likely reason for this would be erroneously high assumed dust temperatures. For a dust emissivity index , the bolometric luminosity per unit dust mass is proportional to , while the dust mass for a given monochromatic submm luminosity is inversely proportional to the dust temperature. Therefore, for a source with a known redshift and measured 850-m flux, the inferred bolometric dust luminosity (and hence star formation rate) is proportional to (e.g. Blain et al. 2002). This suggests that very large errors could be introduced by an incorrect estimate of the dust temperature. However, the expression is only accurate at low redshift, where ( being the frequency at which the observed 850-m radiation is emitted), and the possible error is more modest at , where a factor of 2 uncertainty in dust temperature corresponds to a factor of 10 uncertainty in luminosity (e.g. Hughes, Dunlop & Rawlings 1997; Eales et al. 2000).
I02 adopt K, which is near the hot end of the distribution found for ultraluminous infrared galaxies (Dunne et al. 2000; Farrah et al. 2002). In principle, therefore, the star formation rates of could be an order of magnitude too high if the temperature of the dust is . The ratio of 850-m to 450-m flux is a relatively sensitive function of dust temperature for , as the shorter wavelength point approaches the peak of the emission. Eales et al. (2000) claim an average upper limit of for the CUDSS sources, which appears to rule out dust if the median source redshift is 2. However, Fox et al. (2002) only constrain this ratio to be for sources from the 8-mJy survey, which is low enough to allow hotter dust. In principle, the radio flux should provide an alternative estimate of the SFR if the redshift is known, since the tight radio–FIR correlation provides a way to derive the total FIR luminosity without having to assume the dust temperature. Systematically overestimated SFRs should result in high values of (i.e. steeper spectral indices) whereas there appears to be a strong tendency for the observations to produce shallower spectra (e.g. C04). The cause of this is unclear, and it seems that this issue will only be unequivocally resolved with shorter wavelength detections which can constrain the shape of the SED near the peak of the thermal emission. For now, we believe we are justified in claiming that it is highly improbable that the submm-derived SFRs are reconcilable with our spectroscopically-derived estimates unless most of the star formation is heavily obscured. We are unable to determine whether this obscured fraction is 90 per cent or 99 per cent of the total star formation.
7 Comparison with other spectroscopic studies and future prospects
Near-infrared spectroscopy of submm galaxies has been rather limited to date. Ivison et al. (2000) presented -band spectra of two sources behind the lensing cluster Abell 1835, SMM J14011+0252 and SMM J14010+0253, which both showed H emission but lacked the strong [N ii] emission characteristic of an AGN. Using near-infrared spectrographs on larger telescopes, Frayer et al. (2003) presented a spectrum of SMM J04431+0210, while Smail et al. (2003a,b) observed SMM J17142+5016 (in the protocluster around LBDS 53W002) and ELAIS N2 850.4, respectively. All three of these galaxies showed strong emission lines indicative of the presence of an AGN, which Smail et al. suggest is a common feature of these objects. All the emission lines in these objects are brighter than our upper limits, by an order of magnitude in the cases of SMM J17142+5016 and N2 850.4. The spectra of our targets are dramatically different from those of the (few) objects in the literature. However, this fact may be readily explicable by the fact that our targets were selected to be optically faint, and are therefore perhaps biased towards more heavily extinguished objects. On the other hand, previously observed objects already had known redshifts from optical spectroscopy, and must therefore have had bright Ly emission, and/or sufficiently bright optical continua to allow the detection of absorption lines. Either case implies that the objects with near-IR spectra in the literature are lightly extinguished.
In support of this idea, Eisenhauer et al. (2003) recently obtained a high-quality near-infrared spectrum of the submm source SMM J14011+0252. They found that the rest-frame optical continuum of this object is dominated by stars with ages of a few hundred Myr, similar to our estimate for LE 850.3 (the only object in which we detect an age-sensitive stellar feature) although, unlike LE 850.3, the continuum of SMM J14011+0252 appears to be unreddened, which presumably explains its unusually bright rest-frame UV spectrum (Ivison et al. 2001). Such an age is perhaps larger than expected, since a constant star formation rate of can form a massive galaxy in only .
The most serious difficulty which arises when attempting to understand the nature of submm galaxies as a class comes from a lack of clarity in the criteria with which submm galaxies are selected for spectroscopy by different groups. This difficulty is almost certainly compounded by the likelihood that spectra are only published where firm redshifts are obtained (i.e., objects with luminous emission lines, or those with bright enough continua to allow the detection of absorption features). This leads to the presence of strong and uncertain selection effects in the literature samples, and makes generalized statements about the properties of the population as a whole unreliable.
Nevertheless, almost 100 spectroscopic redshifts for submm galaxies have been obtained, and there is little reason to believe that the redshift distribution obtained from these objects is significantly different from that of the class as a whole (Chapman et al. 2003; but see also Dannerbauer et al. 2004). It is therefore clearly time for the study of these important objects to progress from simple redshift determination and basic classification (AGN, starbust, composite) to more detailed analyses. The difficulties posed by the presence of large quantities of dust and the existence of multiple components point to the need for spectroscopy over a long wavelength baseline, covering rest-frame wavelengths from Ly to H.
The most interesting new instrument for this purpose is FMOS, the Fibre Multi-Object Spectrograph (Maihara et al. 2000; Kimura et al. 2003) which is scheduled to be commissioned on Subaru Telescope in late 2005. This instrument will provide OH-suppressed spectroscopy with increased sensitivity, spectral resolution, and wavelength coverage (0.9–1.8m) compared to OHS, using 400 fibres across a 30-arcminute field of view (this corresponds to the source density at a flux level of ; e.g., Borys et al. 2003). The ability to take many spectra simultaneously enables much longer exposures than we were able to undertake here and, coupled with the increased sensitivity of the new instrument, it should be relatively straightforward to probe a further order of magnitude below our current detection limits. Our emission line sensitivities will therefore correspond to star formation rates of , and it would be remarkable if a significant number of targets failed to display emission lines. Furthermore, the increased sensitivity to the continuum emission will allow more accurate modelling of the galaxies’ stellar populations. As a demonstration of the likely data quality we can expect from FMOS, we simulated the spectrum of N2 850.2 using the FMOS Spectral Simulator developed by Naoyuki Tamura333The FMOS Spectrum Simulator can be found at http://elvira.phyaig.dur.ac.uk/naoyuki.tamura/simulator.html (Fig 5). Our input spectrum assumes fluxes for the H, [O ii], and [O iii] 5007 lines given in Table 2, superimposed on a continuum of a 3-Gyr-old elliptical, reddened by . All emission lines are assumed to have , and an exposure time of 7 hours was adopted, representing the maximum likely on-source integration time possible in a single night’s observing.

A major caveat to this lies in the infrared “spectroscopic desert” at . Here, [O ii], the Balmer jump, and the 4000-Å break are redshifted between the and windows; H and [O iii] are redshifted between and ; and H is redshifted beyond the band. Although this is a relatively small redshift range, it is close to the peak of the redshift distribution and may include more than 10 per cent of sources from a flux-limited sample (Chapman et al. 2003). Without the reddening-insensitive age measurements provided by the Balmer jump and/or 4000-Å break, and with the low spectral resolution of FMOS, detailed stellar population analysis of these targets is unlikely to prove fruitful.
For now, further infrared spectroscopy is still worthwhile as a precursor to the above observations. Many submm sources display optical emission lines and, regardless of whether these are powered by a starburst or an AGN, there will be associated nebular lines redshifted into the near-infrared. The relative strengths of these lines (in objects whose redshifts are suitable for near-infrared spectroscopy) will test our idea that they come from a relatively unobscured region comprising only a small fraction of the total starburst.
8 Summary
We have presented the results of deep near-IR spectroscopy of seven galaxies selected from the SCUBA 8-mJy and CUDSS submm surveys. We have obtained spectroscopic redshifts for three of these objects, two of which (LE 850.3 and ELAIS N2 850.2) agree well with the prior estimates from radio–submm data, while the other (ELAIS N2 850.12) is unexpectedly low. These redshifts are based on marginal () detections of emission lines, although in all cases they come from more than one spectral feature, and in one instance (N2 850.2) there are four emission lines, and the derived redshift agrees with the (as yet unpublished) Ly and CO redshifts. In all three cases, the star-formation rates derived from the emission-line luminosities are much lower than those derived from the radio–submm data. By comparing the bulk properties of our sample with those observed at optical wavelengths, we suggest that we are seeing a small fraction of the total starburst through low extinction. Further infrared spectroscopy of sources with secure optical redshifts are required to test this hypothesis.
Acknowledgments
This paper is based on data collected at Subaru Telescope, which is operated by the National Astronomical Observatory of Japan. The authors are grateful to the staff of Subaru Telescope for their help with the observations, and to the anonymous referee for his/her comments. CS and JSD thank the Particle Physics and Astronomy Research Council for funding in the form of an Advanced Fellowship and Senior Research Fellowship, respectively.
References
- [1] Aretxaga I., Hughes D. H., Chapin E. L., Gaztañaga E., Dunlop J. S., Ivison R. J., 2003, MNRAS, 342, 759 (A03)
- [2] Blain A. W., Kneib J.-P, Ivison R. J., Smail I., 1999, ApJ, 512, L87
- [3] Blain A. W., Smail I., Ivison R. J., Kneib J.-P., Frayer D. T., 2002, Phys. Rep., 369, 111
- [4] Borys C., Chapman S., Halpern M., Douglas S., 2003, MNRAS, 344, 385
- [5] Carilli C. L., Yun M. S., 1999, ApJ, 513, L13
- [6] Carilli C. L., Yun M. S., 2000, ApJ, 530, 618
- [7] Chapman S. C., Blain A. W., Ivison R. J., Smail I., 2003, Nat, 422, 695
- [8] Cimatti A., Andreani P., Röttgering H., Tilanus R., 1998, Nat, 392, 895
- [9] Clements D., et al., 2004, MNRAS, in press (astro-ph/0312269) (C04)
- [10] Dannerbauer H., Lehnert M. D., Lutz D., Tacconi L., Bertoldi F., Carilli C., Genzel R., Menten K., 2004, ApJ, 573, 473
- [11] Dey A., Graham J. R., Ivison R. J., Smail I., Wright G. S., Liu M. C., 1999, ApJ, 519, 610
- [12] Downes D., et al., 1999, A&A, 347, 809
- [13] Dunlop J. S., et al., 2004, MNRAS, in press (astro-ph/0205480)
- [14] Dunne L., Clements D., Eales S. A., 2000, MNRAS, 319, 813
- [15] Eales S., Rawlings S., 1993, ApJ, 411, 67
- [16] Eales S., Lilly S., Webb T., Dunne L., Gear W., Clements D., Yun M., 2000, AJ, 120, 2244
- [17] Eisenhauer F., et al., 2003, ESO Messenger, 113, 17
- [18] Farrah D., Serjeant S., Efstathiou A., Rowan-Robinson M., Verma A., 2002, MNRAS, 335, 1163
- [19] Fioc M., Rocca-Volmerange B., 1997, A&A, 326, 950
- [20] Fox M. J., et al., 2002, MNRAS, 331, 839
- [21] Frayer D. T., Armus L., Scoville N. Z., Blain A. W., Reddy N. A., Ivison R. J., Smail I., 2003, AJ, 126, 73
- [22] Gear W. K., Lilly, S. J., Stevens J. A., Clements D. L., Webb T. M., Eales S. A., Dunne L., 2000, MNRAS, 316, L51
- [23] Hauser M. G., et al., 1998, ApJ, 508, 25
- [24] Hawarden T. G., Leggett S. K., Letawsky M. B., Ballantyne D. R., Casali M. M., 2001, MNRAS, 325, 563
- [25] Hu E. M., Ridgway S. E., 1994, AJ, 107, 1303
- [26] Hughes D. H., Dunlop J. S., Rawlings S., 1997, MNRAS, 289, 766
- [27] Hughes D. H., et al., 1998, Nat, 394, 241
- [28] Hughes D. H., et al., 2002, MNRAS, 335, 871
- [29] Ivison R. J., Smail I., Le Borgne J.-F., Blain A. W., Kneib J.-P., Bézecourt J., Kerr T. H., Davies J. K., 1998, MNRAS, 298, 583
- [30] Ivison R. J., Smail I., Barger A. J., Kneib J.-P., Blain A. W., Owen F. N., Kerr T. H., Cowie L. L., 2000, MNRAS, 315, 209
- [31] Ivison R. J., Smail I., Frayer D. T., Kneib J.-P, Blain A. W., 2001, ApJ, 561, L45
- [32] Ivison R. J., et al., 2002, MNRAS, 337, 1 (I02)
- [33] Iwamuro F., Motohara K., Maihara T., Hata R., Harashima T., 2001, PASJ, 53, 355
- [34] Jimenez R., Padoan P., Dunlop J. S., Bowen D. V., Juvela M., Matteucci F., 2000, ApJ, 532, 152
- [35] Kennicutt R. C., 1992, ApJ, 388, 310
- [36] Kennicutt R. C., 1998, ApJ, 498, 541
- [37] Kimura M., et al., 2003, in Iye M., Moorwood A. F., eds, Proc. SPIE 4841. SPIE, Bellingham, p. 974
- [38] Leitherer C., Robert C., Heckman T. M., 1995, ApJS, 99, 173
- [39] Maihara T., et al., 2000, in Iye M., Moorwood A. F., eds, Proc. SPIE 4008. SPIE, Bellingham, p. 1111
- [40] Motohara K., et al., 2002, PASJ, 54, 315
- [41] Osterbrock D. E. 1989, Astrophysics of Gaseous Nebulae and Active Galactic Nuclei (Mill Valley: University Science Books)
- [42] Pei Y. C., 1992, ApJ, 395, 130
- [43] Perryman M. A. C., et al., 1997, A&A, 323, L49
- [44] Rengarajan T. N., Takeuchi T. T., 2001, PASJ, 53, 433
- [45] Scott S. E., et al., 2002, MNRAS, 331, 817
- [46] Smail I., Ivison R. J., Gilbank D. G., Dunlop J. S., Keel W. C., Motohara K., Stevens J. A., 2003a, ApJ, 583, 551
- [47] Smail I., Chapman S. C., Ivison R. J., Blain A. W., Takata T., Heckman T. M., Dunlop J. S., Sekiguchi K., 2003b, MNRAS, 342, 1185
- [48] Steidel C. C., Pettini M., Hamilton D., 1995, AJ, 110, 2519
- [49] Tokunaga A. T., 2000, in Cox A. N. ed., Allen’s Astrophysical Quantities (4th Edition). Springer, Berlin, p. 151
- [50] Webb T. M. A., Lilly S. J., Clements D. L., Eales S., Yun M., Brodwin M., Dunne L., Gear W. K., 2003, ApJ, 597, 680
- [51] Willott C. J., et al., 2003, MNRAS, 339, 397
- [52] Yun M. S., Carilli C. L., 2002, ApJ, 568, 88