eurm10 \checkfontmsam10 \pagerange1–8
Galaxy evolution in clusters from to
Abstract
The XMM–LSS project is detecting distant clusters of low mass, quite comparable in mass to the ones in the local universe. This allows a direct comparison of galaxy properties at different redshifts in “similar” clusters. We present here first results on the evolution of the reddest galaxies in clusters/groups at and for the whole galaxy population in the same clusters. The emerging picture from the current study is that the counterparts of present day clusters tend to show two or more distinct populations : a relatively old () population evolving passively together with a younger population, ostensibly responsible for the apparent brightening of the characteristic magnitudes, .
1 Introduction
The nature and the time scale of the processes that shape galaxies properties in clusters and groups is still unclear, in spite of significant progress in the past years.
The window opened by the redshift dependence of the galaxies properties has been used to give constraints on the time scales of the processes (e.g. Butcher & Oemler 1984; Dressler et al. 1997; Stanford, Eisenhardt & Dickinson, 1998; Treu et al. 2003). However, many of the clusters compared at different redshifts have different masses (or X-ray luminosities), in such a way that in some occasions “we are comparing unripe apples to ripe oranges in understanding how fruit ripens” (Andreon & Ettori 1999). Furthermore, many of intermediate redshift clusters are optically selected, with a risk of biasing the optical properties of galaxies (see, for example, Andreon, Lobo & Iovino, 2004). Finally, rich clusters are rare environments where evolution is thought to be accelerated (Kauffman 1996).
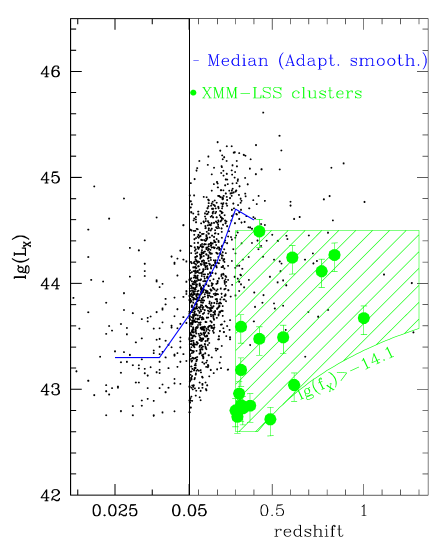
There is therefore a compelling need to study galaxy properties of low mass (much below Coma) clusters at intermediate redshift (). They have masses similar to common clusters in the local universe. Selecting them independently from the optical will limit the risk of bias. This is one of the aims of the XMM–Large Scale Structure collaboration333see http://vela.astro.ulg.ac.be/themes/spatial/xmm/LSS/ (Pierre et al. 2004, Andreon, Pierre et al. 2003) that takes advantage from the multiwavelengh observations in progress on XMM, CTIO, CFHT Legacy Survey, UKIDSS, Spitzer, Galex and other facilities. Figure 1 shows individual X–ray luminosities of more than 1300 clusters of galaxies (black points) drawn from literature (and listed in the BAX database444http://bax.ast.obs-mip.fr/ ). Their median X-ray luminosity (spline) increases with redshift, as shown in Andreon & Ettori (1999) for the Butcher & Oemler (1984) sample. There is, instead, a good match in X–ray luminosity between XMM–LSS clusters (the region at ) and the clusters in the local Universe (considered, say, in the morphology–density paper by Dressler 1980 or in the Butcher–Oemler paper by Butcher & Oemler 1984).
In a single deg2 area XMM–LSS has currently spectroscopically observed some 70 clusters at , the most distant being at for the time being555A true color image with X-ray contours of the latter can be inspected at the URL http://www.brera.mi.astro.it/andreon/g04_06trico.png. A high redshift () cluster sample is also being assembled, characterized by extended X–ray emission associated with faint or absent optical galaxies and significant galaxy overdensity in deep NIR images. The sample it is currently composed by at least six clusters.
Here we report results for clusters at . Most of them are X–ray selected, with intermediate–low mass (as measured by their X–ray luminosity) and low richness , as measured on the Abell (1958) scale. In addition, we have included a few, more massive clusters drawn from literature, and a few clusters below the X-ray detection limit but color detected with our own version of the Gladders & Yee (2000) method (see Andreon 2003 for an early application to SDSS data) in the same XMM-LSS sky area. This analysis allow us to check the impact of the X–ray selection. More details can be found in Andreon et al. (2004).

2 The colour–magnitude relation
Figure 2 shows the colour evolution of the red envelope of the red sequence, defined as the median colour of the three brightest galaxies on the red sequence. Several model predictions are indicated555Throughout this paper we assume , and kms-1 Mpc-1.. The top (long dashed) curve neglects ageing of the stellar population. The additional models are more physically motivated. Passive stellar ageing and chemical evolution are described employing the model of Kodama & Arimoto (1997) and assume a formation redshift, , and a total stellar mass. The two continuous green curves indicate and a total stellar mass of and . The expectation for a mass of and two lower formation redshifts ( and ) are plotted as dotted and short dashed curves, respectively. The colour of the envelope of the red sequence is reproduced well by models where the stars in the oldest galaxies in the clusters form at in good agreement with the findings of Stanford et al. (1998) and Kodama et al. (1998) based on a set of richer clusters located within a comparable redshift range, and with Andreon et al. (2003) for a sample of low redshift clusters of low richness. At the difference of previous works, our observations are quite uniform (virtually all photometric data were obtained at the same telescope+instrument in one single observing run). Furthermore, the cluster sample is mainly selected independently of the optical properties and avoids a potentially circular analysis between optically selected clusters and the properties of the red sequence. Finally, many of the clusters have low mass, right the mass where current predictions regarding the assembly of bright, red galaxies (e.g. Kauffmann 1996 and Eggen, Lynden-Bell & Sandage 1962) display the greatest divergence.
Therefore, in these clusters, including the low mass ones, the color magnitude relation zero–point evolves passively, i.e. these galaxies must have formed the bulk of their stellar mass at .
3 The luminosity function
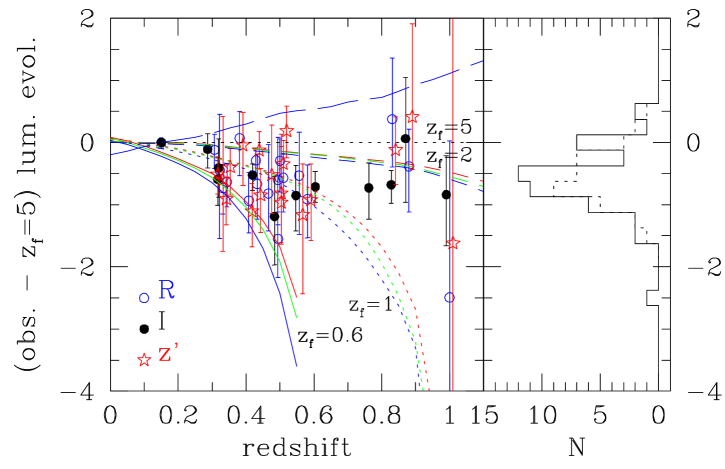
But what about the whole galaxy population, including blue galaxies? To this end, we measured the luminosity function in the standard way, and we fit a Schechter (1978) function of fixed slope to the data, hence determining and their error. Figure 3 displays the redshift dependence of 47 values at (two calibrating points are also plotted, each one being the average of 21 X–ray selected clusters). To highlight the possible effects of active luminosity evolution upon , the distance modulus and passive luminosity evolution terms were removed employing a –redshift evolution term computed for a passively evolving stellar population formed at using the model of Kodama & Arimoto (1997) previously employed to compute the colour of the red sequence. The model predictions are normalized to the observed at . The data points are systematically brighter than a model based upon an old, passively evolving stellar population (horizontal line). A non–evolving model is also strongly ruled out (rising line). The clusters presented in Figure 3 require a secondary star formation episode at in order to generate an values brighter than the passive evolution model. The same conclusion can be drawn by considering the right panel of Figure 3 (solid line) which displays the histogramme of values marginalized over redshift. The resulting distribution is approximately 1 magnitude wide and is offset from zero toward bright magnitudes
The additional curves in Figure 3 indicate the expected evolution for stellar populations formed at successively lower redshifts. In order to account for the bright values observed at redshifts a formation redshift as low as would be required, although, by adopting such a low formation redshift, the predicted value at a redshift would be 0.2 magnitudes brighter than that reported by GMA99. The LF data points are not well described by any formation model based upon a single episode of star formation and a more complex scenario should be considered. The last (in cosmic time) star formation event should brighten average values by up to 1 mag (right panel of Figure 3). Such secondary star formation activity may be related to the Bucther–Oemler effect (Bucher & Oemler 1984), although the evidence for the latter is not compelling (Andreon & Ettori 1999; Andreon, Lobo, Iovino 2004). A Bucther–Oemler analysis of the present sample of clusters is presently in progress.
4 Conclusions
We are at last observing the high redshfit counterparts of the well studied low redshift clusters. The emerging picture from the current study is that even low mass clusters at intermediate redshift are composed by two or more distinct galaxy populations : a relatively old population formed at and evolving passively together with a younger population, ostensibly responsible for the apparent brightening of the characteristic LF magnitudes. The determination of the nature of this secondary activity (e.g. the time scale and the relationship with the cluster properties) is within the reach of the XMM–LSS project, since the redshift regime is to be ultimately sampled by several hundreds of X–ray or color selected clusters, with supporting multi-color and spectroscopic observations.
Acknowledgements.
SA thanks the whole XMM-LSS collaboration for the numerous discussions. SA wormly thanks A. Dressler for useful suggestions. This work has received support from MURST-COFIN n. 2003020150-005References
- [Abell(1958)] Abell, G. O. 1958, ApJS, 3, 211
- [Andreon(2003)] Andreon, S. 2003, A&A, 409, 37
- [Andreon & Ettori(1999)] Andreon, S. & Ettori, S. 1999, ApJ, 516, 647
- [] Andreon, S., Lobo, C., Iovino A., 2004, MNRAS, 349, 889
- [Andreon, Pierre, & the XMM-LSS collaboration(2003)] Andreon, S., Pierre, M., & the XMM-LSS collaboration 2003, Societa Astronomica Italiana Memorie Supplement, 3, 188
- [] Andreon, S., Willis, J., Quintana, H., Valtchanov, I., Pierre, M., 2004, MNRAS, submitted
- [Butcher & Oemler(1984)] Butcher, H. & Oemler, A. 1984, ApJ, 285, 426
- [Dressler et al.(1997)] Dressler, A., et al. 1997, ApJ, 490, 577
- [Gladders & Yee(2000)] Gladders, M. D. & Yee, H. K. C. 2000, AJ, 120, 2148
- [Eggen, Lynden-Bell, & Sandage(1962)] Eggen, O. J., Lynden-Bell, D., & Sandage, A. R. 1962, ApJ, 136, 748
- [Kauffmann(1996)] Kauffmann, G. 1996, MNRAS, 281, 487
- [Kodama & Arimoto(1997)] Kodama, T. & Arimoto, N. 1997, A&A, 320, 41
- [] Pierre et al. 2004, PASP, submitted (astro-ph/0305191)
- [Schechter(1976)] Schechter, P. 1976, ApJ, 203, 297
- [Stanford, Eisenhardt, & Dickinson(1998)] Stanford, S. A., Eisenhardt, P. R., & Dickinson, M. 1998, ApJ, 492, 461
- [Treu et al.(2003)] Treu, T., Ellis, R. S., Kneib, J., Dressler, A., Smail, I., Czoske, O., Oemler, A., & Natarajan, P. 2003, ApJ, 591, 53