Imaging chemical differentiation around the low-mass protostar L483-mm
This paper presents a millimeter wavelength aperture-synthesis study of the spatial variations of the chemistry in the envelope around the deeply embedded low-mass protostar L483-mm on 1000 AU (5″) scales. Lines of 8 molecular species including CN, C18O, CS, C34S, HCN, H13CN, HCO+ and N2H+ have been observed using the Owens Valley Radio Observatory Millimeter Array. Continuum emission at 2.7-3.4 millimeter is well-fit by an envelope model based on previously reported submillimeter continuum images down to the sensitivity of the interferometer without introducing a disk/compact source, in contrast to what is seen for other protostellar objects. A velocity gradient in dense material close to the central protostar is traced by HCN, CS and N2H+, and is perpendicular to the large-scale CO outflow, with a pattern consistent with rotation around a 1 central object. Velocity gradients in the propagation direction of the outflow suggest a clear interaction between the outflowing material and “quiescent” core. Significant differences are observed between the emission morphologies of various molecular species. The C18O interferometer observations are fit with a “drop” abundance profile where CO is frozen-out in a region of the envelope with temperatures lower than 40 K and densities higher than 1.5 cm-3, which is also required to reproduce previously reported single-dish observations. The N2H+ emission strongly resembles that of NH3 and is found to be absent toward the central continuum source. This is a direct consequence of the high CO abundances in the inner region as illustrated by a chemical model for the L483 envelope. The observed CN emission forms a spatial borderline between the outflowing and quiescent material probed by, respectively, HCO+ and N2H+, and also shows intermediate velocities compared to these two species. A scenario is suggested in which CN is enhanced in the walls of an outflow cavity due to the impact of UV irradiation either from the central protostellar system or related to shocks caused by the outflow.
Key Words.:
individual objects: L483-mm, stars: formation, ISM: molecules, ISM: abundances, astrochemistry1 Introduction
The chemistry of star-forming regions shows a richness and complexity reflecting large variations in the physical conditions found in these environments. For example, the thermal evolution of the pre- and protostellar cores results in evaporation and freeze-out of molecules illustrating the important interplay between the solid-state and gas-phase chemistry. Recent single-dish surveys of low-mass protostars (Jørgensen et al., 2002, 2004c; Schöier et al., 2002; Maret et al., 2004) have illustrated that the chemistry may be severely affected by the thermal history of cores, with radial variations of the temperature due to the heating from the central protostar. This paper presents high-resolution millimeter wavelength aperture-synthesis observations of a wide range of different molecules toward the embedded low-mass protostar L483-mm. In combination with a detailed radiative transfer model (Jørgensen et al., 2002, 2004c) these high-resolution observations make it possible to resolve and address the spatial variation of the chemistry in the protostellar envelope on 1000 AU (5″) scales. Only a few protostars have previously been studied in this chemical detail and the combination with line radiative transfer models and information about the larger scale structure from single-dish observations makes a unique discussion about the chemical differentiation at varying temperatures and densities possible.
Recent single-dish continuum studies of embedded protostars have proved useful to establish the physical structure of the protostellar envelopes. A detailed description of the density and temperature variation is crucial for calculations of the molecular excitation and for the interpretation of the chemical small-scale structure from high resolution interferometer observations. Typically the envelope density and temperature structure can be constrained from radiative transfer modeling of submillimeter continuum observations (e.g., Jørgensen et al., 2002; Shirley et al., 2002) or from infrared extinction measurements (e.g., Alves et al., 2001; Harvey et al., 2001). The detailed profiles can subsequently be used as input for Monte Carlo radiative transfer modeling of single-dish line emission to constrain the molecular abundances (e.g., Bergin et al., 2002; Jørgensen et al., 2002, 2004c; Schöier et al., 2002). The models can also be used to predict images of both continuum and line emission that can be directly compared to interferometer observations constraining the envelope structure down to scales of a few hundred AU (e.g., Jørgensen et al., 2004a; Schöier et al., 2004). The caveat of the single-dish studies is their low spatial resolution of 10-15″ or worse, which is why these observations predominantly are sensitive to material on larger scales (2000 AU) unless high-excitation lines are observed. Recent interferometric studies of millimeter continuum emission around low-mass protostars (e.g., Hogerheijde et al., 1999; Looney et al., 2000; Harvey et al., 2003; Jørgensen et al., 2004a; Schöier et al., 2004) have illustrated the potential for probing the small-scale physical structure of the envelopes and constrain the presence of unresolved emission, possibly originating in circumstellar disks in these deeply embedded stages.
Images of molecular line emission at similar resolutions can be used to discuss the detailed envelope chemical structure. For example, Jørgensen et al. (2004a) reported high-resolution observations of a range of molecular species toward the class 0 protostar, NGC~1333-IRAS2A. The 3-6″ (600-1200 AU) observations were interpreted in the context of envelope models constrained by single-dish continuum maps and multi-transition line observations from the survey by Jørgensen et al. (2002, 2004c). It was found that the single-dish envelope model could be successfully extrapolated to the smaller scales, lending further credibility to the approach and derived physical and chemical properties.
L483-mm (IRAS~18148-0440; in the following just L483) is similar to NGC~1333-IRAS2A being a deeply embedded, low-mass protostar with a low bolometric temperature of K. In contrast to NGC~1333-IRAS2A, it shows a remarkable, asymmetric structure in the SCUBA maps. This asymmetry is likely to be the cause of the rather flat density distributions () found in radiative transfer modeling of the continuum emission by Jørgensen et al. (2002) () and Shirley et al. (2002) (). The envelope parameters for L483 are given in Table 1.
| Distance, | 200 pc |
|---|---|
| 9 | |
| 50 K | |
| Envelope parameters: | |
| Inner radius ( K), | 9.9 AU |
| Outer radius, | 1.0 AU |
| Density at 1000 AU, (H2) | 1.0 cm-3 |
| Slope of density distribution, | 0.9 |
| Mass, | 4.4 |
Park et al. (2000) reported BIMA observations of HCO+ 1–0 and C3H2 toward L483. They found two characteristic velocity gradients in the two species: an east-west velocity gradient in HCO+ coincident with the larger scale CO outflow and a north-south velocity gradient in C3H2 which they associated with global contraction of an envelope of a few thousand AU size. L483 has also been mapped in NH3, most recently by Fuller & Wootten (2000) who presented NH3 maps from the VLA. They found that the overall asymmetry observed with SCUBA also shows up in the NH3 maps, but with NH3 lacking emission close to the protostar, which they ascribed to optical depth effects. They also noted a characteristic velocity pattern across the maps and suggested the presence of infall close to the central protostar.
In addition to clear signatures in CO emission (Fuller et al., 1995; Hatchell et al., 1999; Tafalla et al., 2000), an outflow driven by L483 is also seen through near-infrared emission, possibly caused by scattered emission in the outflow cavities (Hodapp, 1994; Fuller et al., 1995). The absence of significant enhancements of CH3OH and SiO, as found in other outflows, led Tafalla et al. (2000) to suggest that the L483 outflow is more evolved than those from other class 0 objects. Since the driving source itself appears deeply embedded (Fuller et al., 1995; Fuller & Wootten, 2000), Tafalla et al. therefore suggested that L483 is in transition from the class 0 to the class I stage.
This paper presents high resolution 3 mm interferometer observations of a wide range of molecular species toward L483. The main objective is to address whether the observed trends in the single-dish survey by Jørgensen et al. (2004c) can be related to the variations in the chemistry in the L483 envelope. The paper is laid out as follows: Sect. 2 describes the details of the observations. Sect. 3 discusses the continuum maps of L483 and compares to the predictions from the envelope model based on the SCUBA observations from Jørgensen et al. (2002). Sect. 4 presents the line observations. Sect. 5 brings together the results for the line emission and discusses the implications for the chemistry in the environment of L483.
2 Observations
L483-mm (, ) was observed using the Owens Valley Radio Observatory (OVRO) Millimeter Array111The Owens Valley Millimeter Array is operated by the California Institute of Technology under funding from the US National Science Foundation (grant no. AST-9981546). from October 2001 to February 2003 in three settings including HCN, H13CN and HCO+ (3.4 mm), N2H+, CS and C34S (3.2 mm), and C18O and CN (2.7 mm) as summarized in Table 2. Each of the settings was observed in the C and E configurations providing projected baselines ranging from 3 to 45 k. Compared to the BIMA HCO+ maps presented by Park et al. (2000), the coverage of the tracks in this paper includes longer baselines but not the shortest spacings. These observations are therefore less sensitive to extended emission but provide higher resolution. The correlator gives spectral resolutions of 0.15-0.2 km s-1 over 128 channels covering each line with RMS noise levels of 0.1 Jy beam-1 per channel. The complex gains were calibrated by regular observations of the nearby quasar, j1743-038, approximately every 20-25 minutes. The bandpass was calibrated by observations of strong quasars, the fluxes using the same quasars as secondary calibrators and Uranus and Neptune as primary calibrators. Calibration of the data was performed using the MMA reduction package (Scoville et al., 1993).
| Molecule | Transition | Frequency |
|---|---|---|
| H13CN | 1–0a | 86.3402 |
| HCN | 1–0a | 88.6318 |
| HCO+ | 1–0 | 89.1885 |
| N2H+ | 1–0a | 93.1737 |
| C34S | 2–1 | 96.4129 |
| CS | 2–1 | 97.9810 |
| C18O | 1–0 | 109.7822 |
| CN | 1–0a | 113.4910 |
Notes: aHyperfine splitting observed.
3 Continuum emission
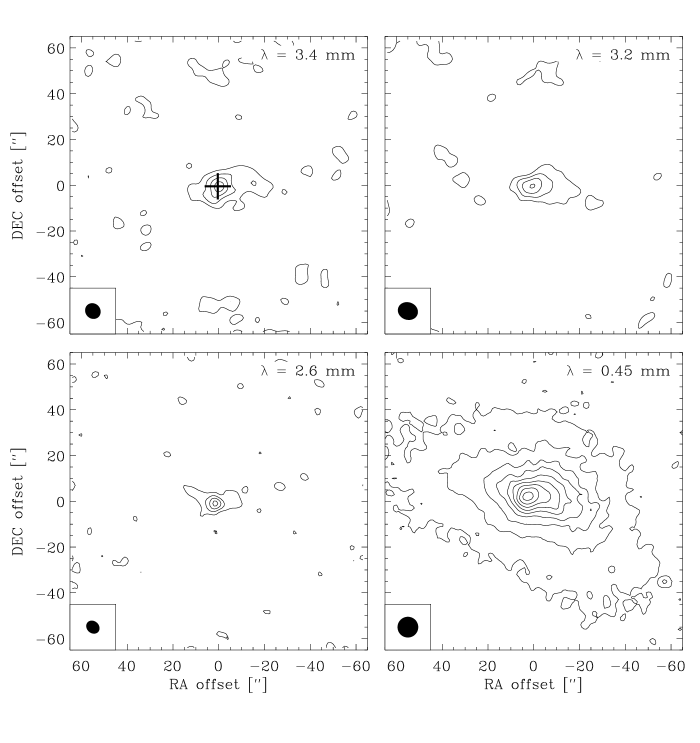
The continuum maps clearly show the central protostar close to the phase center (Fig. 1). The emission appears resolved and roughly follows the morphology from the larger scale SCUBA maps. Results of Gaussian fits to the visibility data are given in Table 3. The envelope model of Jørgensen et al. (2002) predicts total integrated fluxes ranging from 0.16 to 0.32 Jy at wavelengths from 3.4 to 2.6 mm. Fig. 2 shows that the envelope model reproduces the observed fluxes on all the baselines, but the total flux recovered in the interferometer maps is only 5-10% of the total model flux. This is likely due to the lack of sensitivity in the interferometer observations to extended emission.
From Fig. 2 it is also evident that very little emission is picked up on baselines longer than 20-25 k (i.e., at scales less than 10″). Fig. 3 shows the fitted point source fluxes after subtracting the envelope model (, listed in Table 3). It can be seen that the emission is consistent with the zero-expectation level (the expected amplitude signal due to noise alone in the absence of source emission) within 1 (3.2 and 3.4 mm observations) and 2 (2.6 mm). This contrasts the situation for NGC~1333-IRAS2A (Jørgensen et al., 2004a) and IRAS~16293-2422 and L1448-C (Schöier et al., 2004) which show compact emission not explained by the envelope models. In fact the upper limit to the compact flux at 2.6 mm restricts the mass of a possible disk to 0.04 assuming a temperature of 30 K and optically thin emission. Radio measurements of L483 at centimeter wavelengths (Beltrán et al., 2001) show a central source of 0.20 mJy (6 cm) and 0.31 mJy (3.6 cm). These radio observations are compared to the millimeter data from this paper in the insert in Fig. 3. As can be seen, a spectral index consistent with optically thin emission cannot simultaneous explain the millimeter and centimeter observations; however, a flat, positive spectral index would be consistent with the emission at centimeter wavelengths and the limits on the millimeter observations. This would be the case if the flux from centimeter to millimeter wavelengths is from thermal free-free emission as suggested by Beltrán et al. (2001).
| Wavelength [mm] | 3.4 | 3.2 | 2.6 |
|---|---|---|---|
| RMS [mJy beam-1] | 0.5 | 0.9 | 0.8 |
| Beam size (HPBW) [″] | 7.16.5 | 8.87.6 | 6.25.2 |
| [mJy] | 13 | 12 | 11 |
| X-offset [″] | –0.5 | 0.1 | 1.5 |
| Y-offset [″] | –0.9 | –0.3 | –0.9 |
| a [mJy] | (2.0) | (5.2) | (4.5) |
aFitted emission from a compact source after subtraction of the model prediction for the envelope emission. The numbers in parentheses indicate the zero-expectation level, i.e., the expected amplitude signal due to noise alone in the absence of any source.


4 Line emission
4.1 Morphology
Maps of the total integrated emission of each of the observed lines are shown in Fig. 4. All species are detected toward the continuum position and most are stretched in the east-west direction of the elongated core from the SCUBA maps.
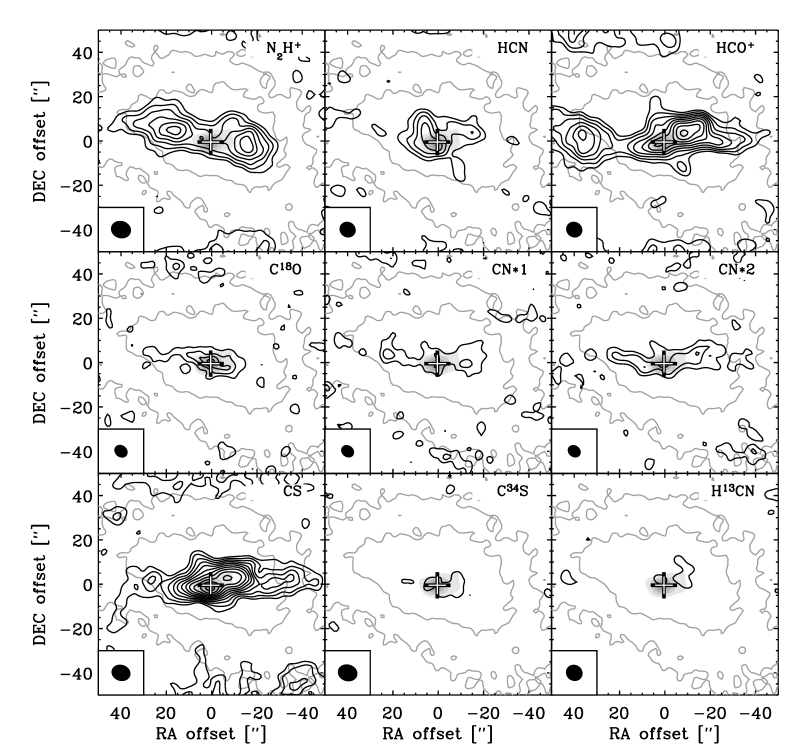
The N2H+ emission is seen to follow the contours of the dust emission from the SCUBA continuum maps closely, except toward the position of the central star where the emission appears suppressed. This gives N2H+ emission a unique “peanut-shape” compared to the remaining species, with the strongest emission at two lobes, respectively east and southwest of the continuum peak position. C18O in contrast is mainly seen very closely confined to the region around the central protostar. The emission is resolved and interestingly shows an almost triangular shape similar to that found in the SCUBA maps (e.g., lower right panel of Fig. 1): the two shortest sides in the north-south direction on the western side of the core and in the east-west direction on the northern side of the core, and the longest side stretching from the northeast to the southwest.
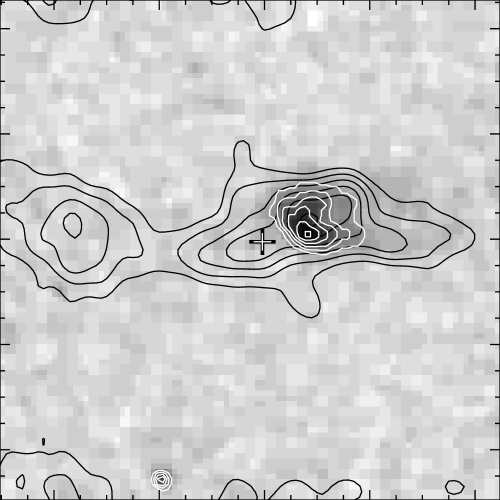
HCO+ shows the most extended emission. It has a slightly curved structure around the central protostar, being almost anti-correlated with the N2H+ emission. A similar “twist” can be seen in the single-dish CO maps of Hatchell et al. (1999) and Tafalla et al. (2000) and in general the HCO+ appears closely correlated with the outflow, as was also concluded based on the BIMA HCO+ maps by Park et al. (2000). Fig. 5 compares the 2MASS All-Sky Quicklook222The Two Micron All Sky Survey (2MASS) is a joint project of the University of Massachusetts and the Infrared Processing and Analysis Center/California Institute of Technology, funded by the National Aeronautics and Space Administration and the National Science Foundation. The presented image was obtained from the NASA/IPAC Infrared Science Archive, which is operated by the Jet Propulsion Laboratory, California Institute of Technology, under contract with the National Aeronautics and Space Administration. image of L483 with the observed HCO+ emission. Near-perfect overlap is seen between the infrared and HCO+ emission in the western outflow lobe. This in agreement with the suggestion by Fuller et al. (1995) that the infrared emission is light from the central protostar scattered off the outflow cavity walls. The HCN and CS emission appear to be more centrally concentrated around the central protostar but do show traces of the same elongated east-west feature. In addition a north-south feature perpendicular to the main elongation is seen in both species extending over 20″. Their weaker isotopic species, C34S and H13CN, only show unresolved emission around the central continuum peak.
CN shows a very narrow feature elongated in the east-west direction. Toward both N2H+ lobes the CN emission makes a twist as seen in the HCO+ maps, but for CN the emission is much narrower. In fact CN is found to trace the boundary between the N2H+ and HCO+ emission (see Sect. 5.2). The two CN hyperfine components otherwise show similar structures indicating quite homogeneous excitation conditions along the main elongation.
As found for the continuum observations, the interferometer picks up only a fraction of the line emission seen by the single-dish telescope. Fig. 6 compares the single-dish spectra from the Onsala 20 m telescope (Jørgensen et al., 2002, 2004c) with those from the interferometer datacubes convolved with Gaussians similar to the size of the single-dish beam. The interferometer spectra recover only a fraction of the emission close to the systemic velocity of the cloud ( km s-1) whereas that in the wings agrees better, i.e., is less subject to resolving out.
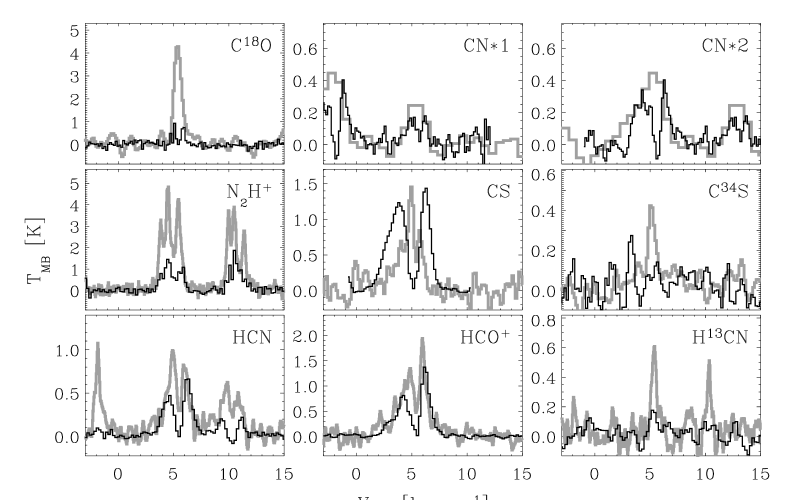
The large degree of resolving out, together with the asymmetry of the source, naturally complicates the interpretation of the line observations and, in particular, renders direct calculations of, e.g., column densities based on the absolute values of the interferometer observations impossible. The interferometer observations do, however, give the location and sizes of the brightest emission and one can thereby utilize comparisons between the maps of the different species to address the spatial variations of the chemistry. Also, predictions from the line radiative transfer model can be used for comparison to the interferometer observations, especially for species that show a relatively simple structure such as C18O (see discussion in Sect. 5.1).
4.2 Velocity field
Velocity gradients are seen for a number of species toward L483 as illustrated in channel maps of the lines of HCO+, HCN, CS and N2H+ in Fig. 7. The HCO+ maps clearly show the twist of the outflow toward the east for the red-shifted lobe, with distinct cores at offsets (15″,-5″) at 6.6 km s-1 and the edge of the channel maps at 6.6 km s-1. The first of these two clumps are also clearly seen in the CS channel maps at the same velocity. This core is merging with the central protostellar core at offsets (3″,-3″) seen toward all four species. In the maps of the blue-shifted emission the northern part of the central core is also seen at (0″,5″) for velocities around 4.2 km s-1. The outflow emission is less obvious in the blue-shifted lobe. A last feature is a red-shifted core at (-15″,0″) in HCN, HCO+ and CS at velocities of 6.3 km s-1. The two peaks of the N2H+ emission are seen to be unrelated to emission in the other maps and peak at respectively 5.1 and 6.3 km s-1.


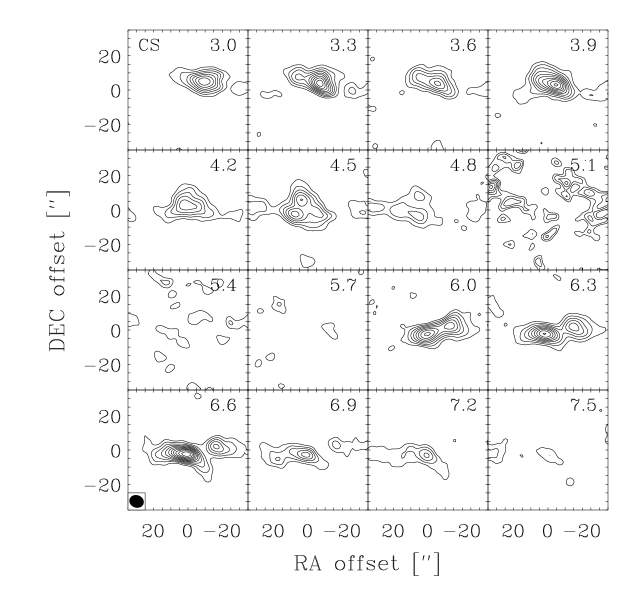

As discussed by Jørgensen et al. (2004a), it may be somewhat problematic directly inferring velocity gradients from interferometer maps with missing short-spacings since the interferometer is predominantly sensitive to material at the more extreme velocities. As can be seen from Fig. 6, the emission in the line wings is indeed least subject to resolving out compared to the emission close to the systemic velocity, but in general the observed line profiles appear similar from both single-dish and interferometer observations indicating that they are still probing much the same material.
For N2H+, the hyperfine splitting further complicates the interpretation of the velocity field. As was also found for NGC~1333-IRAS2A, however, each component is rather narrow, not affected by the outflow, and well-represented by single Gaussians. To derive the velocity field probed by N2H+, the emission from the 7 hyperfine components was therefore fit simultaneously to the spectra in each pixel. The linewidths for the individual hyperfine components were taken to be constant and fit together with the systemic velocity field, the overall normalization of the entire hyperfine group and the relative intensities of the hyperfine components. The fitted velocity field is illustrated in Fig. 8. An overall red-blue asymmetry is found between the eastern and western lobes. Toward the source position it is seen that the velocity gradient is directed toward the north-south as in the cases of HCN and CS.
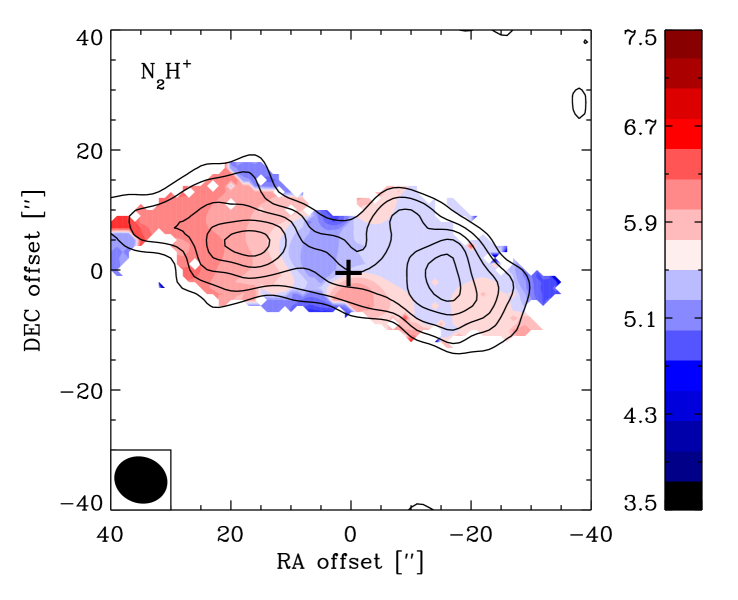
The very characteristic two lobes in N2H+ are also seen in NH3 by Fuller & Wootten (2000), who furthermore found that the NH3 emission shows a two velocity component structure with the NE lobe red-shifted to 5.5-5.6 km s-1 and the SW lobe blue-shifted to 5.3-5.4 km s-1. This is exactly what is found for our N2H+ data, indicating that the NH3 and N2H+ emission probe the same material. Both Fuller et al. (1995) and Tafalla et al. (2000) proposed L483 as a core being broken up by the action of the outflow resulting, for example, in the bipolar near-infrared nebulosity. The velocity field seen in N2H+ and NH3 and its similarities with the outflow velocity pattern would suggest that such an interaction in fact is ongoing although these species are not directly probing the outflowing gas.
Fuller & Wootten (2000) found the most blue-shifted emission toward the central star with velocities of 5.1-5.3 km s-1, and suggested that the more blue-shifted emission toward the central star is a result of infall. In our N2H+ maps it is also seen that the emission has its most blue-shifted peak about 5″ northwest of the protostellar mm/cm source. However, an accompanying red-shifted component is present on the other side of the central source (i.e., to the southeast). This is further supported by our HCN and CS maps which show a similar velocity pattern around the central protostar, also seen by Park et al. (2000) in C3H2 maps. A tempting suggestion for this velocity gradient is rotation around the central protostellar object and the propagation axis of the outflow. The CS and HCN lines have rather high critical densities and appear to probe only the densest gas on small scales close to the central protostar. Likewise C3H2 is typically only found in the dense envelope material not affected by the outflow (e.g., Bachiller & Pérez Gutiérrez, 1997; Tafalla & Myers, 1997).
Fig. 9 shows the position-velocity diagram for the CS emission. The coordinate system has been rotated to have the Y-axis in the direction of the north-south velocity gradient around the central protostar (i.e., 12∘ from north through east) and the X-axis in the direction of the outflow perpendicular to this. The largest velocity gradient is seen in the north-south direction of the CO outflow. At velocities 1 km s-1 from the systemic velocity the gradient is found to be consistent with linear expansion of 0.27 km s-1 arcsec-1 or 2.6 km s-1 pc-1 at the distance (200 pc) of L483.
A clear velocity gradient is also observed in the north-south direction: plotted on top of the position-velocity diagram is the predicted rotation curve for Keplerian rotation around a 1.2 central object. This velocity gradient fits the data at large velocities compared to the systemic velocity, but at velocities of 4.5-5 km s-1 the emission appears to stretch southwards in contrast to the prediction for Keplerian rotation. The cause of this is the offset in the north-south direction between the red and blue-shifted lobes of the outflow. Alternative explanations to the pure Keplerian rotation (e.g., a combination of rotation and infall such as suggested for another embedded low-mass YSO, TMC1, by Hogerheijde, 2001) cannot be ruled out based on the data presented in this paper, since the confusion with the outflow around L483 complicates the interpretation.


5 Discussion
5.1 Thermal structure, depletion of CO and resulting chemistry
The most striking feature in the maps of the integrated emission in Fig. 4 is the characteristic “peanut-shaped” N2H+ maps, with N2H+ being absent from the gas-phase close to the central protostar. This likely reflects destruction of N2H+ by reactions with CO, as suggested to be the case in protostellar environments by, e.g., Bergin et al. (2001) and Jørgensen et al. (2004a, c). Jørgensen et al. (2004c) found a clear anti-correlation between the abundances of CO and N2H+, which was suggested to be caused by CO depletion, and thereby less N2H+ destruction, in the cold part of the envelope. It is therefore interesting to compare the N2H+ and CO maps presented in this paper: as further illustrated in Fig. 10, the N2H+ and C18O peaks are clearly anti-correlated with CO being present towards the central protostar. This supports the claim that the C18O maps peak toward the regions where CO has evaporated from the grain mantles whereas N2H+ peaks away from the central continuum position where CO is frozen-out.

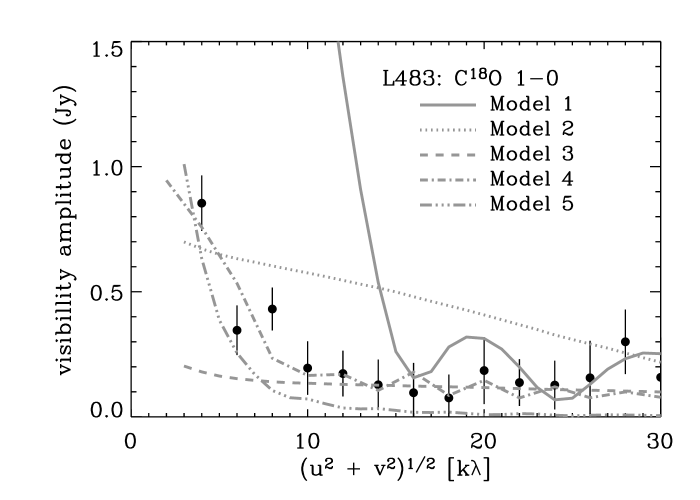
As discussed in Sect. 4.1, a significant fraction of the line emission is resolved out. Since the structure of the C18O emission appears relatively simple, we can calculate the emission from the envelope adopting the physical structure and CO abundances from Jørgensen et al. (2002) as shown in Fig. 11. This model is compared to “jump” models where the CO abundance increases at radii where the temperature is above a given threshold mimicking evaporation of CO. As can be seen from Fig. 11, the constant abundance model provides a better fit to the interferometer data: the “jump” models either overproduce the observed emission at intermediate baselines (models with K and 30 K) or do not produce a large increase at the shortest baselines (model with K). As discussed in Jørgensen et al. (2002, 2004c), however, although the constant CO abundance and jump models can successfully explain the intensities of the higher and CO lines, they generally under-produce the low emission. It is therefore not unexpected that such models have problems explaining the radial variation of the observed CO emission.
As an alternative, Jørgensen et al. (2004b, c) suggest a “drop” model where CO is frozen out only in regions where the temperature is lower than the evaporation temperature , while at the same time the density is higher than a given density, , so that the depletion timescale is shorter than the age of the core. This is similar to the case seen for pre-stellar cores (e.g., Caselli et al., 1999; Tafalla et al., 2002; Lee et al., 2003) where CO is frozen out towards the core center where the density high, and the corresponding timescale for depletion thereby shorter than the lifetime of the core. Such “drop” models can explain both high and low CO lines, and the difference in abundances between more and less massive envelopes seen in Jørgensen et al. (2002), and they work very well in describing the radial variations of molecules such as H2CO (Schöier et al., 2004).
Models for the single-dish CO emission were calculated for L483 and compared to the line intensities reported in Jørgensen et al. (2002). A drop model with cm-3 and K, an undepleted CO abundance of 2.7 and depletion in the drop region by a factor 50 was found to provide good fits to the observed single-dish emission as indicated by the reduced for the fit as given in Table 4. This model has been compared to the interferometer data in Fig. 11 and is found to give a good fit to the observed C18O 1–0 emission at practically all baselines. Freeze-out up to a temperature of 40 K is needed in order not to produce too much emission at the intermediate baselines and the inclusion of an outer low density region, where the CO abundance increases, nicely reproduces the observed trend at the shortest baselines.
| Model | a | b | |
|---|---|---|---|
| 1: | Jump = 20 K | 221 | 478 |
| 2: | Jump = 30 K | 18.9 | 8.0 |
| 3: | Jump = 40 K | 10.8 | 4.7 |
| 4: | Drop = 40 K; = 1.5 cm-3 | 1.5 | 1.3 |
| 5: | Constant | 8.0 | 3.1 |
aReduced for fits to single-dish line intensities. bReduced for fits to interferometer data as shown in Fig. 11.
5.1.1 Chemical implications
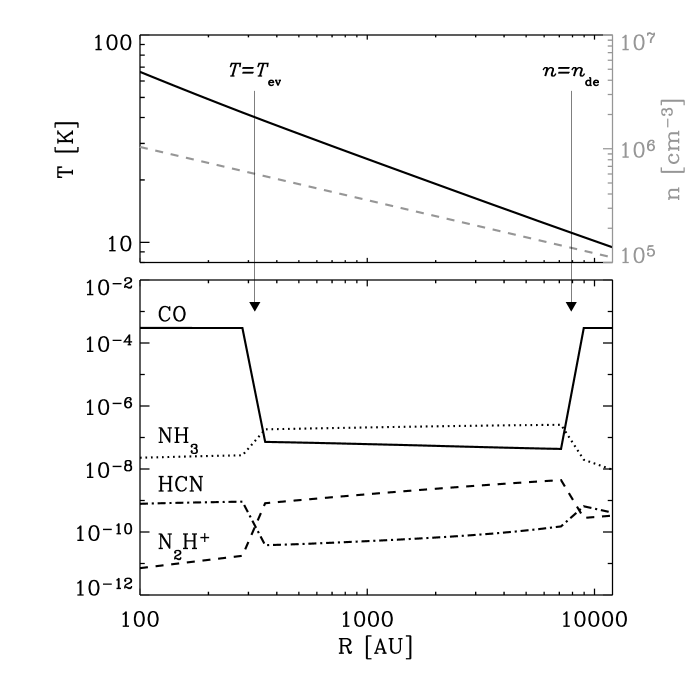
The CO abundance structure has important chemical implications. As described above, distinct zones with and without depletion of CO also account for the characteristic shape of the N2H+ emission. In their NH3 maps Fuller & Wootten (2000) found a very similar structure with a “valley” devoid of emission in the north-south direction through the position of the protostar but otherwise following the large scale dust continuum emission from the SCUBA maps. Caselli et al. (2002) likewise suggested a close correlation between emission seen in N2H+ and NH3 based on a large single-dish survey of N2H+ emission toward dense cores. The precursor for both N2H+ and NH3 is N2 which due to its low binding energy does not deplete unless at very high ages and densities (e.g. Bergin & Langer, 1997; Bergin et al., 2002). NH3 maintains a balance with the overall chemical network of N-bearing species, including N2H+, predominantly through reactions with NH, and at low (depleted) CO abundances these species establish a closed network. At “standard” CO abundances, reactions between C+ and NH3, however, drive the nitrogen into H2NC+ and from there to CN, HNC and HCN, whereas the N2H+ is destroyed through reactions with CO.
These trends are illustrated with a chemical model for the L483 envelope using the chemical network and approach described in Doty et al. (2002, 2004) and adopting the physical structure from Jørgensen et al. (2002) with CO depleted in the zone constrained by the single-dish and interferometer observations above. As shown in Fig. 12 this gives exactly an increase in N2H+ and NH3 over the region where the CO is depleted. Note that although the CO abundance goes up again in the outermost part of the envelope and the NH3 and N2H+ abundances consequently drop, this occurs at distances of 8000 AU corresponding to 40″ from the compact source in Fig. 4, which is close to the boundary of the N2H+ emission. This is, however, probably not the main reason for the outer edge to the N2H+ emission: it is more likely caused by the critical density of the N2H+ 1–0 transition which is cm-3, a density which is also reached at this distance from the central source. The N2H+ emission is therefore not sensitive to the outer region with low density material where CO is undepleted.
Of course a detailed radiative transfer model for the N2H+ and NH3 emission could address some of these issues in more detail, such as it was done for the CO emission. The problem is, however, that the spherical model clearly breaks down for the scales probed by the N2H+ emission. In fact the asymmetry may well be the reason that N2H+ is seen in so clearly distinct zones away from the central protostar in the L483 case, since N2H+ becomes marginally optically thick toward the source center in an entirely spherical core. Therefore N2H+ will not be sensitive to the innermost region where the CO comes off the dust grains in the symmetric case.
5.2 UV irradiation of outflow cavity walls
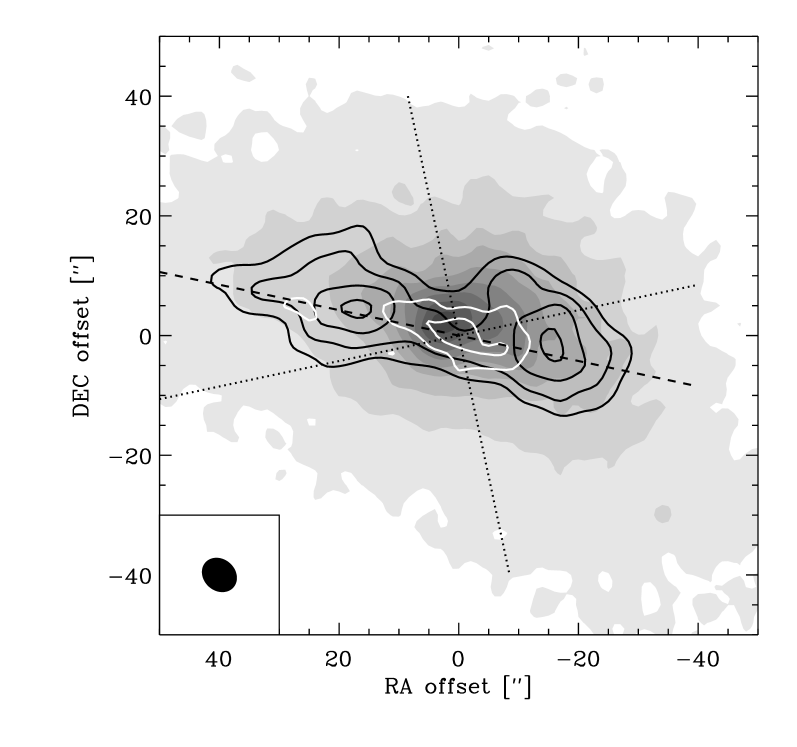
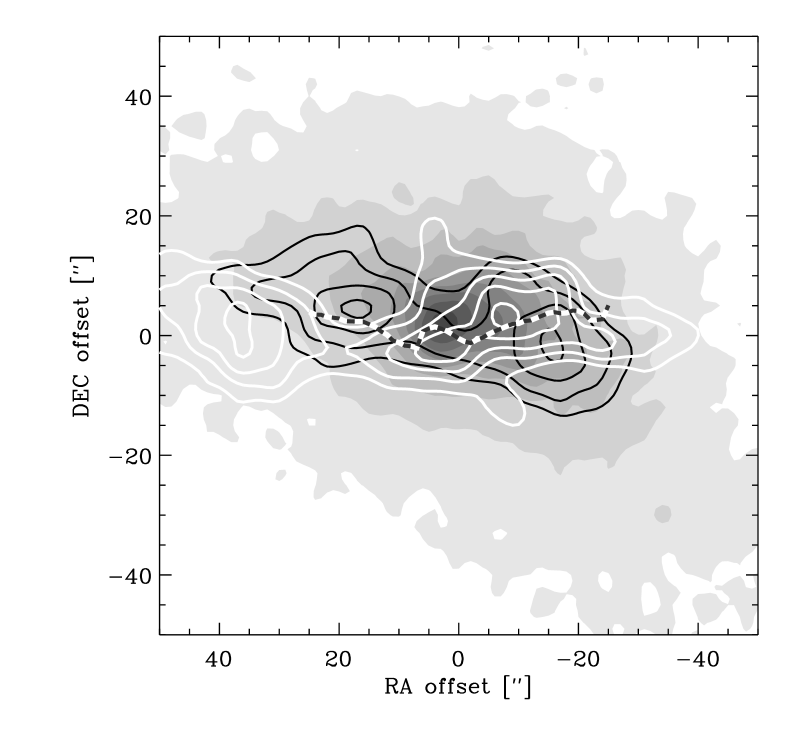
HCO+ is found to be most prominent towards the outflow as is typically seen at large and small scales (e.g., Hogerheijde et al., 1998), whereas the N2H+ emission probes the cold part of the quiescent cloud. As illustrated in Fig. 13, the CN emission appears in a boundary region between HCO+ and N2H+, i.e., between the outflowing and quiescent cloud material. A possible explanation for this “borderline property” of the CN emission could be that CN is enhanced in the walls of an outflow cavity probed by the HCO+ emission.

Jørgensen et al. (2004c) found a clear trend between the CN abundances and CS/SO abundance ratio and suggested that this might reflect the strength of ultraviolet radiation in the protostellar envelope. L483 is the source in the sample of Jørgensen et al. (2004c) with the highest ratio of CN abundances in the inner region relative to the outer region of the envelope (i.e., [CN]32/[CN]10, where [CN]32 and [CN]10 are the CN abundances inferred from the high excitation 3–2 lines at 340.24 GHz and low excitation 1–0 lines at 113.49 GHz, respectively). For most sources in the sample this ratio is less than 1 indicating that the CN abundances are enhanced predominantly in the low density material in the outermost region of the envelope. For L483, the ratio is 2.5 indicating a higher CN abundance in the denser material. If the CN abundances are probing the strength of the UV field, this argues in favor of an internal source of the UV radiation in the case of L483.
Such correlations between the CN abundances and UV field have been suggested to be present in gaseous disks around more evolved class I/II objects (Dutrey et al., 1997; Qi, 2001; Bergin et al., 2003; van Zadelhoff et al., 2003; Thi et al., 2004) which are known to be strong emitters of UV radiation resulting from the ongoing accretion. In the deeply embedded stages, however, the UV radiation cannot escape far out into the envelope due to the large extinctions. This will prevent direct detection of any UV flux from the central star-disk system, but this emission may still be dominant at small scales close to the central protostar. It is therefore of high interest to search for specific chemical probes that may be used to address the impact of UV in the inner envelope and thereby potentially also the ongoing accretion.
The UV radiation field may furthermore be of large importance in cavities cleared by outflows. Spaans et al. (1995), for example, suggested that the presence of high CO lines toward embedded protostars is related to heating of material in the outflow cavity walls by the UV radiation escaping from the central protostar. The near-infrared nebulosity toward L483 (Fig. 5 and Fuller et al. (1995)) suggests that such a cavity is present. Alternatively the enhanced UV radiation could be a result of the shocks associated with the L483 outflow which are directly probed by the H2 emission (Hodapp, 1994; Buckle et al., 1999). Molinari et al. (2001) suggested that recombination in the post-shocked gas could illuminate outflow cavities behind Herbig-Haro objects producing a PDR resulting in diffuse C+ emission seen by ISO (Molinari et al., 2001; Molinari & Noriega-Crespo, 2002).
To get a handle on this possibility a simple estimate of the extent of the CN emitting region can be made: the CN emission is unresolved in its transverse direction, meaning that the extent of the emission must be 5″. In the model for the L483 envelope from Jørgensen et al. (2002) the density at 20″ from the protostar is . Introducing the extent of the CN emission as , an upper limit to the column density of the CN emitting region can be estimated:
| (1) |
or a visual extinction, . Models of photon dominated regions (e.g., Jansen et al., 1995; Sternberg & Dalgarno, 1995) indicate that this is the extinction range over which CN would be enhanced predominantly due to photodissociation of HCN. Alternative explanations such as excitation effects appear less likely, since CN is the only molecule showing this peculiar morphology.
If CN in fact is tracing the interface region between the outflow and the quiescent core probed by HCO+ and N2H+, respectively, this should also be reflected in the observed velocity field of the three species. As discussed above the velocity field probed by N2H+ shows a red-blue spatial asymmetry aligned with that seen in HCO+, suggesting that the “quiescent” material probed by N2H+ is being accelerated by the outflow. Fig. 14 compares the velocity field in the eastern lobe of the three species along the flattened direction of the core (dashed line in Fig. 10). The HCO+ does indeed show the largest velocity gradient across the region with less steep increases in CN and N2H+ toward the lower densities in the core. Again CN is seen to be intermediate between the outflowing and quiescent material in support of the suggested scenario.

6 Conclusions
We have presented an analysis of the physical and chemical properties of the class 0 protostar L483-mm on 500-1000 AU scales. This paper demonstrates how the 1D envelope model derived from single-dish continuum and line data can be applied to the interpretation of the millimeter interferometer observations. The main conclusions are as follows:
-
1.
The continuum emission at 3 mm is well-fit by the envelope model from Jørgensen et al. (2002). In contrast to the case for other recently studied class 0 objects (e.g., NGC~1333-IRAS2A, L1448-C and IRAS~16293-2422; Jørgensen et al. (2004a); Schöier et al. (2004)), an additional point source (e.g., a disk) is not needed to fit the observed continuum emission. Assuming an optically thin 30 K disk, this puts an upper limit to the disk mass of 0.04 .
- 2.
-
3.
N2H+ and C18O are found to be clearly anti-correlated, with C18O centered on the central continuum source whereas N2H+ has two distinct peaks away from the central star. This is interpreted as the combined effects of CO freeze-out at low temperatures and destruction of N2H+ by reactions with CO. The N2H+ emission resembles that of NH3, previously reported by Fuller & Wootten (2000), which can be understood if NH3 is destroyed through reactions with C+ when the CO abundance is high, and as clearly illustrated by a chemical model for the L483 envelope.
-
4.
HCN and CS emission probe the dense material close to the central protostar. A velocity gradient perpendicular to the outflow propagation direction, also recognized in previous C3H2 observations by Park et al. (2000), is interpreted as rotation around 1 central protostar.
-
5.
CN is found to trace a boundary between the quiescent material probed by N2H+ and the larger scale outflow seen in HCO+. A possible explanation is that CN probes material in the outflow cavity walls (seen as an infrared nebula in 2MASS images) where its abundance is enhanced as a result of UV irradiation. This is further supported by the observed velocity field: the gradient introduced by the outflow is seen in both HCO+, CN and N2H+, with HCO+ showing the largest velocities relative to the systemic velocity followed by CN (in the cavity walls) and N2H+ (in the core material). This also suggests that a clear interaction between the outflowing and quiescent material around L483 is taking place. Possibly the outflow is in the process of dispersing the protostellar core, causing its characteristic asymmetric shape.
This paper illustrates the potential of high-resolution millimeter interferometer observations for addressing the spatial variations in the chemistry around protostellar objects. In particular, future high resolution observations from the SMA, CARMA and eventually ALMA will confirm or reject the drop abundance model through imaging of the radial structure of the emission from high excitation lines of, e.g., C18O, probing more uniquely the higher temperatures and densities in the envelope. Also high resolution observations of high excitation lines of CN will make it possible to further address the importance of UV radiation in the inner envelope close to the central protostar and confirm the relation between CN abundances and strength of the UV field. In this context direct imaging of lines of, e.g., atomic carbon in the high frequency windows will also be important to understand the specific chemical effects. Such observations will become feasible with the SMA and ALMA. An additional test would be deep mid-infrared Spitzer observations: for example, deep imaging of the thermal emission in the outflow cavities and searches for established probes of the UV field such as the presence and properties of specific emission lines and PAH features, provide complementary information which could be used to establish a more detailed 2D model of complex protostellar sources such as L483.
Acknowledgements.
Ewine van Dishoeck, Michiel Hogerheijde, Fredrik Schöier and Geoff Blake are thanked for fruitful discussions and comments on the manuscript. Michiel Hogerheijde and Floris van der Tak are further acknowledged for making their radiative transfer code publically available. Steve Doty is thanked for the use of his chemical code. This research was funded by a NOVA network 2 Ph.D. stipend.References
- Alves et al. (2001) Alves, J. F., Lada, C. J., & Lada, E. A. 2001, Nature, 409, 159
- Bachiller & Pérez Gutiérrez (1997) Bachiller, R. & Pérez Gutiérrez, M. 1997, ApJ, 487, L93
- Beltrán et al. (2001) Beltrán, M. T., Estalella, R., Anglada, G., Rodríguez, L. F., & Torrelles, J. M. 2001, AJ, 121, 1556
- Bergin et al. (2003) Bergin, E., Calvet, N., D’Alessio, P., & Herczeg, G. J. 2003, ApJ, 591, L159
- Bergin et al. (2002) Bergin, E. A., Alves, J., Huard, T., & Lada, C. J. 2002, ApJ, 570, L101
- Bergin et al. (2001) Bergin, E. A., Ciardi, D. R., Lada, C. J., Alves, J., & Lada, E. A. 2001, ApJ, 557, 209
- Bergin & Langer (1997) Bergin, E. A. & Langer, W. D. 1997, ApJ, 486, 316
- Buckle et al. (1999) Buckle, J. V., Hatchell, J., & Fuller, G. A. 1999, A&A, 348, 584
- Caselli et al. (2002) Caselli, P., Benson, P. J., Myers, P. C., & Tafalla, M. 2002, ApJ, 572, 238
- Caselli et al. (1999) Caselli, P., Walmsley, C. M., Tafalla, M., Dore, L., & Myers, P. C. 1999, ApJ, 523, L165
- Doty et al. (2004) Doty, S. D., Schöier, F. L., & van Dishoeck, E. F. 2004, A&A, 418, 1021
- Doty et al. (2002) Doty, S. D., van Dishoeck, E. F., van der Tak, F. F. S., & Boonman, A. M. S. 2002, A&A, 389, 446
- Dutrey et al. (1997) Dutrey, A., Guilloteau, S., & Guelin, M. 1997, A&A, 317, L55
- Fuller et al. (1995) Fuller, G. A., Lada, E. A., Masson, C. R., & Myers, P. C. 1995, ApJ, 453, 754
- Fuller & Wootten (2000) Fuller, G. A. & Wootten, A. 2000, ApJ, 534, 854
- Harvey et al. (2001) Harvey, D. W. A., Wilner, D. J., Lada, C. J., et al. 2001, ApJ, 563, 903
- Harvey et al. (2003) Harvey, D. W. A., Wilner, D. J., Myers, P. C., Tafalla, M., & Mardones, D. 2003, ApJ, 583, 809
- Hatchell et al. (1999) Hatchell, J., Fuller, G. A., & Ladd, E. F. 1999, A&A, 344, 687
- Hodapp (1994) Hodapp, K. 1994, ApJS, 94, 615
- Hogerheijde (2001) Hogerheijde, M. R. 2001, ApJ, 553, 618
- Hogerheijde et al. (1998) Hogerheijde, M. R., van Dishoeck, E. F., Blake, G. A., & van Langevelde, H. J. 1998, ApJ, 502, 315
- Hogerheijde et al. (1999) Hogerheijde, M. R., van Dishoeck, E. F., Salverda, J. M., & Blake, G. A. 1999, ApJ, 513, 350
- Jansen et al. (1995) Jansen, D. J., Spaans, M., Hogerheijde, M. R., & van Dishoeck, E. F. 1995, A&A, 303, 541
- Jørgensen et al. (2004a) Jørgensen, J. K., Hogerheijde, M. R., van Dishoeck, E. F., Blake, G. A., & Schöier, F. L. 2004a, A&A, 413, 993
- Jørgensen et al. (2002) Jørgensen, J. K., Schöier, F. L., & van Dishoeck, E. F. 2002, A&A, 389, 908
- Jørgensen et al. (2004b) Jørgensen, J. K., Schöier, F. L., & van Dishoeck, E. F. 2004b, A&A, submitted
- Jørgensen et al. (2004c) —. 2004c, A&A, 416, 603
- Lee et al. (2003) Lee, J.-E., Evans, N. J., Shirley, Y. L., & Tatematsu, K. 2003, ApJ, 583, 789
- Looney et al. (2000) Looney, L. W., Mundy, L. G., & Welch, W. J. 2000, ApJ, 529, 477
- Maret et al. (2004) Maret, S., Ceccarelli, C., Caux, E., et al. 2004, A&A, 416, 577
- Molinari & Noriega-Crespo (2002) Molinari, S. & Noriega-Crespo, A. 2002, AJ, 123, 2010
- Molinari et al. (2001) Molinari, S., Noriega-Crespo, A., & Spinoglio, L. 2001, ApJ, 547, 292
- Park et al. (2000) Park, Y., Panis, J., Ohashi, N., Choi, M., & Minh, Y. C. 2000, ApJ, 542, 344
- Qi (2001) Qi, C. 2001, Ph.D. Thesis
- Schöier et al. (2002) Schöier, F. L., Jørgensen, J. K., van Dishoeck, E. F., & Blake, G. A. 2002, A&A, 390, 1001
- Schöier et al. (2004) —. 2004, A&A, 418, 185
- Scoville et al. (1993) Scoville, N. Z., Carlstrom, J. E., Chandler, C. J., et al. 1993, PASP, 105, 1482
- Shirley et al. (2002) Shirley, Y. L., Evans, N. J., & Rawlings, J. M. C. 2002, ApJ, 575, 337
- Spaans et al. (1995) Spaans, M., Hogerheijde, M. R., Mundy, L. G., & van Dishoeck, E. F. 1995, ApJ, 455, L167
- Sternberg & Dalgarno (1995) Sternberg, A. & Dalgarno, A. 1995, ApJS, 99, 565
- Tafalla & Myers (1997) Tafalla, M. & Myers, P. C. 1997, ApJ, 491, 653
- Tafalla et al. (2002) Tafalla, M., Myers, P. C., Caselli, P., Walmsley, C. M., & Comito, C. 2002, ApJ, 569, 815
- Tafalla et al. (2000) Tafalla, M., Myers, P. C., Mardones, D., & Bachiller, R. 2000, A&A, 359, 967
- Thi et al. (2004) Thi, W.-F., van Zadelhoff, G.-J., & van Dishoeck, E. F. 2004, A&A, submitted
- van Zadelhoff et al. (2003) van Zadelhoff, G.-J., Aikawa, Y., Hogerheijde, M. R., & van Dishoeck, E. F. 2003, A&A, 397, 789