A transient high-coherence oscillation in 4U 1820-30
We re-analyzed two Rossi X-Ray Timing Explorer archival observations of the atoll source 4U 1820-30 in order to investigate the detailed time-frequency properties of the source during the intervals when a 7 Hz QPO was detected by Wijnands et al. (1999, ApJ, 512, L39). We find that in both observations, in addition to a QPO signal lasting a couple of minutes as previously reported, there is a much narrower transient oscillation with a life time of only a few seconds. Within this time, the oscillation is consistent with being coherent. Its integrated fractional rms is around 10% and its frequency 7.3 Hz and 5.7 Hz in the two observations. We discuss the possible association of this QPO with other oscillations known both in Neutron-Star and Black-Hole systems, concentrating on the similarities with the narrow 5-7 Hz oscillations observed at high flux in Black-Hole Candidates.
Key Words.:
accretion: accretion disks – stars:neutron – X-rays: binaries1 Introduction
Since its launch in 1995, the Rossi X-ray Timing Explorer (RXTE) has provided a wealth of new information on the timing properties of accreting X-ray binaries (see van der Klis 2004 for a review). In Neutron-Star Low-Mass X-ray Binaries (LMXB), oscillations at frequencies from 1 Hz to more than 1 kHz are now known, although there is no general consensus yet on their origin. The observed phenomenology of these Quasi-Periodic Oscillations (QPO) and of noise components in LMXB systems as observed by RXTE is complex. In particular, in addition to the high-frequency QPOs (with frequencies between a few hundred and 1200 Hz), two types of low-frequency oscillations are observed. One with frequencies that vary between 16 and 70 Hz, associated to a band-limited noise component (called Horizontal-Branch Oscillation, HBO, in bright Z sources), and one with lower frequencies (4-7 Hz) appearing at high accretion rate in Z sources (called Normal Branch Oscillation, or NBO). In most Black-Hole Candidates (BHCs), low-frequency oscillations with frequencies varying between 0.1 and 30 Hz are known to be present in at least in some states (see van der Klis 2004). These QPOs are always associated with a band-limited noise component and their frequency is believed to be positively correlated with mass accretion rate (see e.g Sobczak et al. 2000). They are called “type-C” QPOs although often they are referred to as ‘1-10 Hz QPOs’. A strong connection between the HBO and type-C QPOs described above was found by Wijnands & van der Klis (1999), Psaltis, Belloni & van der Klis (2000), and Belloni, Psaltis & van der Klis (2002), who showed evidence of large scale correlations between their frequencies and the characteristic frequencies of other aperiodic components. These correlations include both Neutron-Star and Black-Hole systems. One of them has been since 2002 extended to White-Dwarf systems (see Mauche 2002, Warner et al. 2003 and references therein).
Two additional classes of low-frequency QPOs in BHC have been identified (see Wijnands et al. 1999b, Homan et al. 2001, Remillard et al. 2002, Nespoli et al. 2003, Casella et al. 2004). The first class, called “type A” is characterized by being very broad (with a quality factor , defined as the centroid frequency divided by the FWHM of the peak in the PDS, of less than 3), The second class, called “type B”, is much narrower (), appears at frequencies around 6 Hz, and is associated to a weak power-law noise component. This type-B oscillation shows erratic variability of its centroid frequency on time scales of 10 s and was observed to appear and disappear rapidly (see Nespoli et al. 2003, Casella et al. 2004). Its frequency is only seen in the rather narrow 5-8 Hz range across a number of sources. The time/phase lag properties of these A-B-C oscillations (and their higher harmonics when present) are also well determined and different across the three classes.
Wijnands et al. (1999a, hereafter W99) reported the discovery of a 7 Hz QPO in the LMXB 4U 1820-30, an Atoll source. The QPO was transient, lasting only 160 s, the corresponding power spectral peak was narrow (FWHM0.5 Hz), and showed erratic shifts in frequency. It was found only when the source was at the highest luminosity in the analyzed data. In a note added in proof, W99 mentioned that a similar oscillation was also present in another dataset which had just recently become public. These authors found an association with BHC QPOs unlikely and concentrated their attention to the similarities to NBOs. In order to examine this oscillation more closely and compare it with recent results on BHCs, we reanalized the 4U 1820-30 data where this oscillation was reported by W99 applying the same procedures used by Nespoli et al. (2003) and Casella et al. (2004).
2 Data analysis
We analyzed two RXTE/PCA observations of 4U 1820-30 from the RXTE public archive (see Table 1). The first observation (observation A) is one RXTE orbit from the observation showing the sharp QPO (see W99). For the second observation (observation B), we produced spectrograms for all observations presented by Zhang et al. (1998) and found the only RXTE orbit mentioned by W99 where the sharp QPO is visible.
| Obs. | Start Date | Start Time | Exp. (s) |
|---|---|---|---|
| A | 1996-May-4 | 17:06 | 3512 |
| B | 1997-jul-16 | 5:12 | 3640 |
In order to investigate the time-frequency behaviour of the time series for each observation, we produced a spectrogram, defined (in its continuous version) as
| (1) |
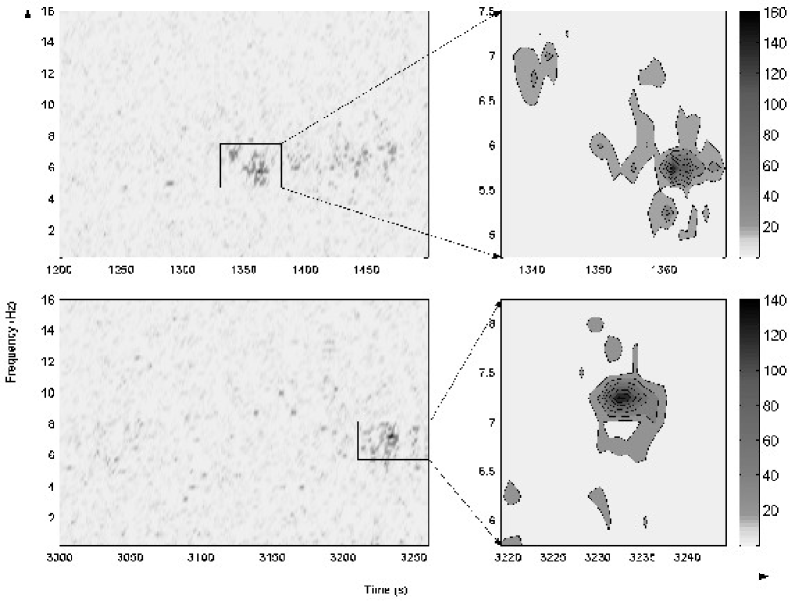
(see Nespoli et al. 2003), where is the signal accumulated over PCA channels 0-35 (corresponding approximately to the energy range 2-13 keV) with a time resolution of 1/32 seconds, and is a window function (in our case a 4-seconds long boxcar window). The spectrogram resolution was chosen to be 1 second, which means that the resulting spectrogram consists of power density spectra from a sliding window with time step 1 second. The spectrograms for the interesting intervals of the two observations (normalized according to Leahy et al. (1983) are shown in gray scale in the left panels of Fig. 1. The right panels show an enlarged contour-plot view of the sections where oscillations are visible. The gray-scale bars indicate that high values of power are present in this region.
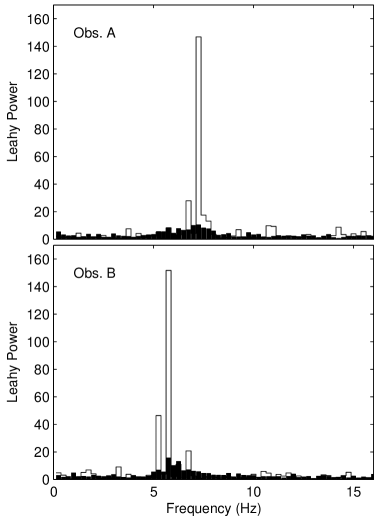
Figure 1 suggests that the signal is composed of two parts: a broad excess and a sharp peak with a very short duration. We produced new spectrograms without overlap between consecutive segments (i.e. with time step 4 seconds) and searched for the highest peak in each of the two observations. A maximum power of 146.8 in Obs. A and 151.7 in Obs B was found. In Fig. 2 we show for each observation the PDS corresponding to these maxima and the average of the four observations before and after. It is clear that each PDS with the maximum power is different and much more peaked than the surrounding ones. Side peaks are visible in both PDS: as their distance is a multiple of 0.5 Hz, they are related to effects of the 4-s window. In order to check whether these strong peaks could be simple statistical deviations from the broad QPO peak in the surrounding spectra, we applied the procedures described by van der Klis (1989, section 3.4.2). From each of the two observations, we averaged the PDS from four intervals before and four after the one containing the sharp peak in order to estimate the local shape of the broad component. We then fitted them with a Lorentzian model (see Table 1), and computed the best-fit power at the frequency of the sharp peak. If is the power of the sharp peak of which we want to test the significance, if the underlying signal is the same, the quantity is distributed as a with two degrees of freedom. The one-trial significance of the sharp peaks for the two observations is then and respectively. W99 detect the broad oscillations for 160 s, while in our second observation significant signal is present for about 100 seconds. Allowing for these numbers of trials, the detected sharp peaks are very significant.
| Obs. | Narrow peak | Broad peak | ||||
|---|---|---|---|---|---|---|
| (Hz) | (Hz) | rms | (Hz) | (Hz) | rms | |
| A | 7.280.03 | 0.160.03 | 10.640.61% | 7.020.09 | 1.970.31 | 7.730.52% |
| B | 5.730.05 | 0.140.05 | 9.211.14% | 6.010.05 | 1.200.16 | 7.010.38% |
We fitted the features shown in Fig. 2 with a Lorentzian model, obtaining the parameters reported in Table 1. As one can see, the FWHM of the narrow peaks is smaller than or compatible with the frequency resolution of 0.25 Hz of the PDS. This indicates that the width of these peaks can be entirely due to windowing effects, and therefore the oscillation is consistent with being coherent within those 4 seconds. Notice that there is little evidence for a red-noise component, as one can also see from Fig. 2 in Wijnands et al. (1999). The short duration of our intervals prevents a sensitive measurement or upper limit to the red noise variability, but W99 estimate a 3.4% upper limit to the 0.1-1 Hz low-frequency noise in Obs. A, consistent with our results.
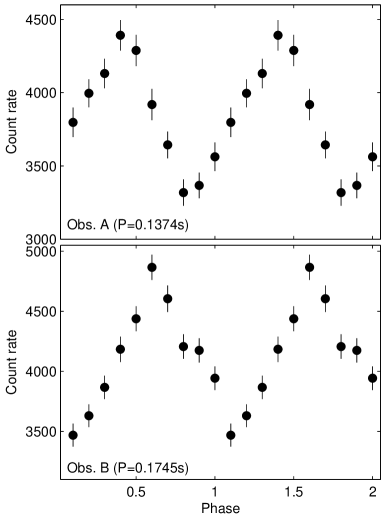
In order to investigate the shape of the oscillation, we folded the 4-s light curves at the best-fit period from Table 2. The folded light curves can be seen in Fig. 3. Their shape is close to sinusoidal. Fits with a sinusoidal function show that a weak second harmonic component (fractional rms 2%) might be present in Obs. A, corresponding to the weak peak observable in Fig. 2. The residuals from a sinusoidal shape for Obs. B are more complex than a simple harmonic peak: a good fit can be obtained only with two additional harmonic components, with a barely significant second harmonic (rms1%) and a stronger third harmonic (rms2.4%) responsible for the bump observable in Fig. 3. Finally, we produced cross spectra for both observations using the energy bands 2.0-6.9 keV and 6.9-18.1 keV for Obs. A, and 2.0-6.5 keV and 6.5-18.1 keV for Obs. B (due to different accumulation modes). From the cross spectra, we estimated the time lag of the hard curve with respect to the soft one to be +2.00.8 ms for Obs. A and -5.64.2 ms for Obs. B (positive lag correspond to the hard curve lagging the soft one). Clearly, the short duration prevents a meaningful determination of the lags. Notice that for Obs. A. we obtain results consistent with those of W99 when we use a larger time interval, therefore including also the broad QPO peak.
We looked for the presence of high-frequency oscillations in correspondence to the short intervals where the 5-7 Hz QPO was detected. In Observation A the highest available frequency for such a search at low energies (where most of the photons are detected) is 256 Hz, while for Obs. B we explored frequencies up to 2048 Hz. We did not find evidence for a high-frequency oscillation, although clearly the short duration of the QPO interval limits rather severely the sensitivity of such a search. We note, however, that Zhang et al. (1998) reported that kHz observations were detected in their observations only when the source was soft, independent of the source state. Our 7 Hz QPO appears when the source is in the hardest region of the color-color diagram see W99).
3 Discussion
As discussed by W99, the two observations analyzed in this work show a signal at a frequency of a few Hertz, lasting only a short time. However, the oscillation reported by W99 corresponds to the black histogram in Fig. 2, due to the limited time resolution of their analysis. We found that in both observations, in addition to the broader signal of W99, a much narrower peak is present in the spectrogram for a shorter period of time. These oscillations are peculiar, in that they last only about four seconds and within that time are highly coherent. A 4-s interval corresponds to 29 and 23 cycles for Obs. A and B respectively. Also, the oscillations are strong, with about a 10% fractional rms.
QPOs with these characteristics have not been observed before in bright Neutron-Star LMXBs. As discussed by W99, in both cases they appear when 4U 1820-30 is in the uppermost region of its banana branch, corresponding to the highest observed luminosity (about 5erg/s, see W99). However, within one single observation in this state, the QPO appears in a section of the light curve that displays no other peculiarities such as e.g. an anomalous flux or color with respect to the surrounding intervals.
W99 discard a possible association with the type-C QPOs observed in BHCs, which at the time were the only ones known, but of course do not discuss the more similar type-B QPOs.
Therefore, they tentatively associate the broad oscillation with the 5-20 Hz QPOs observed in Z sources. However, the properties we detected in the narrow QPOs are not seen in these oscillations from Z sources, although no high time resolution searches have been performed so that similar transient events might have gone unnoticed. Recently, high-coherence oscillations at frequencies between 5 and 8 Hz have been reported from a number of Black-Hole Candidates. These are classified as ’type B’ QPOs by Homan et al. (2001; see also Wijnands et al. 1999b and Remillard et al. 2002). In an observation of GX 339-4 during its 2002 outburst, a 6 Hz QPO was observed: it appeared suddenly in the light curve and, once a random jitter in frequency with a characteristic time scale of 10s was removed, the corresponding PDS peak was very narrow (Nespoli et al. 2003). In this case however, the appearance of the oscillation was accompanied by significant flux, noise and spectral changes. Interestingly, in the interval just before the sudden onset of the QPO, a broad and weaker (in terms of fractional rms) peak was present in the PDS, similar to what we found for 4U 1820-30. The observation where this QPO from GX 339-4 was seen corresponds to the highest-rate interval of Very High State, possibly indicating the highest accretion rate reached during the outburst. Notice that this time also corresponded to the inferred ejection time for relativistic jets in the system (see Fender & Belloni 2004a,b). A similar QPO with variable frequency between 5 and 8 Hz through different observations, was seen in the bright transient XTE J1859+226 (Casella et al. 2004). In that case, a number of sharp transitions were observed, including events when the QPO appeared and disappeared within about 100 seconds. These type-B oscillations have well defined properties and seem to appear in many sources (see also Takizawa et al. 1997, Homan et al. 2001) when the accretion rate is high. Notice that these QPOs are very distinct from the more common ’type-C’ QPOs, the frequency of which is observed to vary between 0.1 and 20 Hz. These are associated to strong band-limited noise and have a very different phase-lag behaviour (see Wijnands et al. 1999b, Casella et al. 2004).
At present, it cannot be ruled out that a similar phenomenon is present in bright Z sources, at their highest inferred accretion rates, i.e. in the flaring branch. The PDS analysis of the light curves of these sources is usually performed over time intervals considerably longer than a few seconds, making it possible that similar features were missed in past studies. This means that a thorough search through the archive might reveal more cases, both in atoll and Z systems.
It is tempting to associate the QPO we detected in 4U 1820-30 with the type-B oscillations in BHCs, as they share many properties (note that due to the short lifetime of the signal, we could not obtain an unambiguous determination of the phase lags). The oscillation presented here are of course of much shorter duration than anything seen so far in BHCs (see above), but what is strikingly similar is the sharp appearance and disappearance of these features, not shared by any other class of QPOs known to date. The main problem is of course that one of the properties they share is the frequency range in which they are observed, i.e. 4-7 Hz. Since BHCs of different (estimated) mass and a NS system show about the same frequency, this means that if these QPOs have the same origin, the dependence of their frequency on the mass must be weak. Of course, it is also possible that more parameters than the mass of the compact object determine the QPO frequency, in which case there might be different dependences that compensate each other. In any case, the appearance of transient high-coherence QPOs in different systems in their brightest state points towards a common mechanism for these.
The physical origin of the oscillation reported here is not clear, in particular in view of the scarce observational information available. Its clear association with a period when a broader oscillation around similar frequencies is observed allows us to suppose that whatever process was at work in broadening the signal might have stopped its action for a few seconds, leading to the detection of a much narrower feature. In a framework of a ‘blob’ model, where the oscillation is produced by the superposition of a number of narrower oscillations caused by blobs of gas at different radii around the compact object, this would correspond to the presence for a limited time of only one of those blobs. This of course would not apply to the type-B oscillations in BHCs, which are observed for a longer time (see Nespoli et al. 2003). In models like that of Psaltis & Norman (2004), where a particular radius in the accretion flow acts as a passband filter, this would correspond either to a single ‘active’ radius, or to a different mode of oscillation, but a more quantitative estimate would be problematic. However, we know that QPOs are not coherent oscillations, which means that there is a physical origin to their observed width. With the current instruments, we are not able to ascertain the nature of this broadening (whether frequency, phase or amplitude modulation), which would give important insight on the physical processes producing the oscillation. In some case, like the one presented here, a more coherent signal is observed for a limited time with properties not compatible with simple random fluctuations. These cases provide good tests for the development of theoretical models.
Acknowledgements.
This work was partially supported by MIUR under CO-FIN grant 2002027145. We thank Luigi Stella for useful discussions and careful reading of the manuscript.References
- (1) Belloni, T., Psaltis, D., van der Klis, M., 2002, ApJ, 572, 392
- (2) Casella, P., Belloni, T., Stella, L., Homan, J., 2004, in preparation.
- (3) Fender, R.P., Belloni, T., 2004a, ARA&A, in press.
- (4) Fender, R.P., Belloni, T., 2004b, in preparation.
- (5) Homan, J., Wijnands, R., van der Klis, M., Belloni, T., van Paradijs, J., Klein-Wolt, M., Fender, R.P., Méndez, M., 2001, ApJSuppl, 132, 377
- (6) Leahy, D.A., Darbro, W., Elsner, R.F., Weisskopf, M.C., Kahn, S., Sutherland, P.G., Grindlay, J.E., 1983, ApJ, 266, 160
- (7) Mauche, C., 2002, ApJ, 580, 423
- (8) Nespoli, E., Belloni, T., Homan, J., Miller, J.M., Lewin, W.H.G, Méndez, M., van der Klis, M., 2003, A&A, 412, 235
- (9) Psaltis, D., Norman., C., 2004, ApJ, in press (astro-ph/0001391)
- (10) Psaltis, D., Belloni, T., van der Klis, M., 2000, ApJ, 520, 262
- (11) Remillard, R.A., Sobczak, G.J., Muno, M.P., McClintock, J.E., 2002, ApJ, 564, 962
- (12) Sobczak, G.J., McClintock, J.E., Remillard, R.A., Cui, W., Levine, A.M., Morgan, E.H., Orosz, J.A., Bailyn, C.D., 2000, ApJ, 531, 537
- (13) Takizawa, M., Dotani, T., Mitsuda, K., Matsuba, E., Ogawa, M., Aoki, T., Asai, K., et al., 1997, ApJ, 489, 272
- (14) van der Klis, M., 1989, in ”Timing Neutron Stars”, Eds. H. Ögelman & E.P.J. van den Heuvel, NATO ASI, C262, p27
- (15) van der Klis, M., 2004, in ”Compact Stellar X-Ray Sources”, eds. W.H.G. Lewin and M. van der Klis, Cambridge University Press, in press
- (16) Warner, B., Woudt, P.A., Pretorius, M.L., 2003, MNRAS; 344, 1193
- (17) Wijnands, R., van der Klis, M., 1999 , ApJ, 514, 939
- (18) Wijnands, R., van der Klis, M., Rijkhorst, E.-J., 1999a, ApJ, 512, L39 (W99)
- (19) Wijnands, R., Homan, J., van der Klis, 1999b, ApJ, 526, L33
- (20) Zhang, W., Smale, A.P., Strohmayer, T.E., Swank, J.H., 1998, ApJ, 500, L171