A giant molecular cloud falling through the heart of Cygnus A: clues to the triggering of the activity
)
Abstract
We present intermediate resolution near-IR long-slit spectroscopic data for the nearby radio galaxy Cygnus A (3C 405) (obtained with the NIRSPEC spectrograph on the Keck II telescope). The data reveal considerable complexity in the near-IR emission line kinematics, including line splittings of 200-350 km s-1 and a mixture of narrow (FWHM 200 km s-1) and broad (FWHM 700 km s-1) components to the emission lines. It is notable that the Pa and H2 emission lines show markedly different kinematics, both on- and off-nucleus. Overall, the data provide evidence for the presence of a giant molecular cloud falling through the heart of the Cygnus A host galaxy, the motion of which is not driven by the AGN itself. We suggest that this cloud may be connected to the triggering of the activity in this highly powerful AGN. We also detect split H2 components on the nucleus that are likely to originate in the circum-nuclear torus.
keywords:
galaxies: active – galaxies: individual: 3C405 – infrared: galaxies – quasars: emission lines – quasars: general1 INTRODUCTION
The prototype radio galaxy Cygnus A (3C 405) is the most luminous extragalactic radio source in the local universe and the only nearby (z=0.0558) radio galaxy of comparable power to 3C sources at z1. In consequence, it is one of the most well-studied radio galaxies. Previous work has concentrated on using Cygnus A to test the unified schemes for powerful radio galaxies (Ueno et al. 1994; Ogle et al. 1997; Young et al. 2002) and to search for signs of the impact of the activity on the host galaxy in the form of AGN-driven outflows (Taylor, Tadhunter & Robinson 2003). Dynamical studies have also led to estimates of the supermassive black hole mass (Tadhunter et al. 2003).
However, despite the large amount of progress that has been made over the last decade in the understanding of Cygnus A and its host galaxy, relatively little is known about the events that triggered the activity. In this paper we present near-IR spectroscopic observations, of higher resolution than previously published near-IR data (Ward et al. 1991; Thornton, Stockton & Ridgway 1999; Wilman et al. 2000), that provide evidence for non-equilibrium gas motions that may have a direct bearing on the triggering of the activity in this poweful AGN.
In order to put our observations in context, we start by summarising our current state of knowledge of the geometry and kinematics of the near-nuclear regions of Cygnus A.
1.1 Geometry and inclination of the near-nuclear regions
HST imaging has revealed an edge-brightened biconical structure on the scale of a few hundred parsecs (Jackson et al. 1998; Tadhunter et al. 1999). This structure is most likely a direct result of the nuclear-driven winds hollowing out ‘ionisation cones’ in the kpc-scale dust lane in which the AGN is embedded. Moreover, the images also show evidence for a starburst ring associated with the dust lane (Fosbury et al. 1999). From these data, the best estimates for the geometry of the biconical structure are opening half-angle 60°and inclination of the cone axis relative to the line-of-sight i 30°with the NW cone oriented towards us and the SE cone oriented away from us (see Tadhunter et al. 2003 for a full discussion). From this geometry we know that we are likely to be viewing Cygnus A very close to the opening angle of the NW cone, but we also know that i (90 - ) as we do not have a direct view of the quasar nucleus at optical wavelengths.
1.2 Kinematic components in the near-nuclear regions
The central regions of Cygnus A show considerable complexity in their emission line kinematics. The various kinematic components can be tied to different processes associated with the AGN as follows:
Gravitational motions
Kpc-scale disc: near-IR Keck II spectroscopic data shows evidence for a rotating disc associated with the 3 kpc scale dust lane. The gas is in Keplerian rotation about a stellar core and an unresolved point mass of (2.5 0.7) 109 solar masses. The rotation axis of the gas is aligned at 9°to that of the large-scale radio axis (Tadhunter et al. 2003).
300pc-radius disc: Higher spatial resolution HST/STIS optical data of Tadhunter et al. (2003) show evidence for a smaller disc structure. The lines from this disc are significantly broadened throughout (FWHM 500-900 km s-1). Although the slit positions closest to the nucleus show evidence for rotation about a central black hole with mass similar to that deduced from the KeckII/NIRSPEC data, there is evidence for deviations from pure circular motions in the NW cone.
Evidence for outflows
Emission line outflows: Intermediate spectral resolution optical data of the [O III]5007 line (Taylor et al. 2003) provide evidence for outflowing gas in the ionisation cones. A 300 km s-1 outflow is detected in the NW cone (blueshifted), whereas a 400 km s-1 outflow is detected in the SE cone (redshifted). These results are consisitent with gas being driven out of the cones by AGN-induced winds.
Extreme outflow: an extreme outflow component is detected in [O III](5007,4949) emission in the NW cone (Tadhunter 1991). This component lies on the radio axis itself and is blueshifted by 1300 - 1800 km s-1; it is likely to represent gas entrained in the outflowing radio plasma.
Scattering outflow: The redshifted [O III]5007 feature detected in polarised light, in both cones and the nucleus, by van Bemmel et al. (2003) is consistent with the presence of a scattering outflow with velocity in the range 150-450 km s-1.
Evidence for inflows
Infalling H I: Two components of H I 21cm absorption are detected in the nuclear regions of Cygnus A (Conway & Blanco 1995). In the rest frame, defined by the narrow component of Pa in the nuclear aperture (see below), these components have redshifts of 227 9 km s-1 and 48 9 km s-1. Since these absorption components are detected against the radio core, and are therefore in the foreground, they must be associated with infalling material.
Although there is now substantial evidence for the gravitational motions and AGN-induced outflows in Cygnus A, the evidence for inflowing material is relatively sparse and rests solely in the H I observations of Conway & Blanco (1995). However, it is the inflow component that is most likely to provide the strongest clues to the triggering of the activity. Therefore it is important to obtain further information about the kinematics and distribution of the inflowing gas. In this context we note that Canalizo et al. (2003) have recently reported the discovery of a red, secondary point source in the nuclear regions, 400pc southwest of the radio nucleus. They argue that this secondary nucleus represents the debris of a minor merger that may be fuelling the AGN activity.
We assume the cosmological parameters of H0=75 km s-1 Mpc-1 and q0=0 throughout this paper. For these parameters 1.00 arcsec corresponds to 1.00 kpc at the redshift of Cygnus A.
2 DATA COLLECTION AND REDUCTION
The K-band near-IR spectra of Cygnus A were taken on 2000 May 22 using the NIRSPEC spectrograph in grating mode on the Keck II telescope at the Mauna Kea complex. Long-slit spectra were obtained with the slit oriented along the radio axis (PA105) and along PA180: in each case the slit was centred on the nucleus. Velocity curves derived from single-Gaussian fits to these data - which provide evidence for a rotating kpc-scale disc - are presented in Tadhunter et al. (2003). In this paper we will be concerned only with the radio axis position angle (PA105). Four exposures of 400 seconds were obtained (at each slit position) with the exposures nodded in an ABBA pattern to facilitate sky subtraction.
The spectra were rectified using purpose-written iraf routines, and wavelength-calibrated in iraf using an argon/neon arc lamp exposure taken at the time of the observations. Following the manual removal of cosmic rays using the clean routine in figaro, the separate exposures for each PA were combined to produce a sky-subtracted two-dimensional spectrum. Telluric features were removed by dividing a high S/N spectrum of the A0 standard star HD203856, which was observed at the same airmass, into the galaxy spectra. Use of the 0.57-arcsec slit resulted in a spectral resolution of 10.9 0.5 Å (140-170 km s-1 for these data), with the observations covering the wavelength range 19100-23000Å. From measurements of stars along the slit, we estimate a plate scale of 0.178 0.004 arcsec pixel-1, and an effective seeing of 0.75 0.05 arcsec (FWHM) for the observations. Measurements of night-sky emission lines in the reduced frames demonstrate that the wavelength scale is accurate to within 0.5 Å ( 8 km s-1) along the full length of the slit.
The exposures of HD203856 were used to flux-calibrate the data, with the assumption that the intrinsic spectral energy distribution (SED) of the star is that of a perfect black-body at T = 9480 K. The magnitude-to-flux conversion was performed with reference to Bessell, Castelli & Plez (1998). The Starlink figaro and dipso packages were used to analyse/reduce the data and fit the spectral lines.
3 RESULTS
| Observed (Å) | Rest (Å) | Species | FWHM (km s-1) | z | Flux (erg s-1 cm-2) |
|---|---|---|---|---|---|
| 19382.5 0.5 | 18358 | H2 =1-0 S(5) | 420 20 | 0.05586 0.00003 | (8.0 0.3)10-16 |
| 19684 | 18639 | He II (6-5) | 420 | assumed 0.056 | (4.61 0.24)10-16 |
| 19737 | 18691 | He I (4F-3D, 3Fo-3D) | 420 | assumed 0.056 | (5.18 0.25)10-16 |
| 19802.3 0.5 | 18756.13 | Pa (Narrow) | 250 6 | 0.05583 0.00003 | (2.54 0.13)10-15 |
| 19802.7 0.5 | 18756.13 | Pa (Broad) | 750 14 | 0.05585 0.00003 | (5.62 0.12)10-15 |
| 19947.4 2.4 | 18920 | H2 =1-0 S(4) (Component 1)a | (270 70)a | 0.0544 0.0001 | (4.5 2.1)10-17 |
| 19970.2 2.4 | 18920 | H2 =1-0 S(4) (Component 2)a | (160 20)a | 0.0556 0.0001 | (9.8 4.5)10-17 |
| 19979.1 2.4 | 18920 | H2 =1-0 S(4) (Component 3)a | (370 40)a | 0.0562 0.0001 | (2.3 0.5)10-16 |
| 20283 1 | 19200c,d | [S XI] (Narrow) | 220 50 | 0.056d | (3.0 1.7)10-16 |
| 20287 3 | 19200c,d | [S XI] (Broad) | 525 100 | 0.057d | (3.9 1.7)10-16 |
| 20528 3 | 19451 | Br (Broad) | 560 80 | 0.0555 0.0002 | (2.7 0.6)10-16 |
| 20537 1 | 19451 | Br (Narrow) | 200 30 | 0.05586 0.00005 | (1.8 0.6)10-16 |
| 20642 1 | 19576 | H2 =1-0 S(3) (Component 1)a | (270 70)a | 0.05450 0.00005 | (1.6 0.5)10-16 |
| 20665 1 | 19576 | H2 =1-0 S(3) (Component 2)a | (160 20)a | 0.05568 0.00005 | (4.6 2.0)10-16 |
| 20674 1 | 19576 | H2 =1-0 S(3) (Component 3)a | (370 40)a | 0.05629 0.00005 | (8.9 2.3)10-16 |
| 20728 1 | 19634 | [Si VI] (Narrow)b | (250 6)b | 0.05577 0.00005 | (6.3 0.3)10-16 |
| 20728 1 | 19634 | [Si VI] (Broad)b | (750 14)b | 0.05577 0.00005 | (1.39 0.03)10-15 |
| 21445 1 | 20338 | H2 =1-0 S(2) (Component 1)a | (270 70)a | 0.05448 0.00005 | (5.8 1.9)10-17 |
| 21470 1 | 20338 | H2 =1-0 S(2) (Component 2)a | (160 20)a | 0.05575 0.00005 | (1.7 0.7)10-16 |
| 21480 1 | 20338 | H2 =1-0 S(2) (Component 3)a | (370 40)a | 0.05630 0.00005 | (3.2 0.8)10-16 |
| 21580 3 | 20412c | H2 =8-6 O(3) | 660 90 | 0.0573 0.0002 | (1.7 0.2)10-16 |
| 21736 1 | 20587 | He I (2P-2S, 1Po-1S) | 445 30 | 0.05586 0.00005 | (3.2 0.2)10-16 |
| 21895 2 | 20735 | H2 =2-1 S(3) | 445 50 | 0.0560 0.0001 | (1.7 0.2)10-16 |
| 22374 3 | 21218 | H2 =1-0 S(1) (Component 1) | 270 70 | 0.0546 0.0001 | (1.5 0.5)10-16 |
| 22401 1 | 21218 | H2 =1-0 S(1) (Component 2) | 160 20 | 0.05579 0.00005 | (4.0 1.7)10-16 |
| 22410 3 | 21218 | H2 =1-0 S(1) (Component 3) | 370 40 | 0.0563 0.0001 | (7.8 2.0)10-16 |
| 22865 2 | 21661 | Br (Narrow) | 350 70 | 0.0557 0.0001 | (3.5 1.8)10-16 |
| 22872 6 | 21661 | Br (Broad) | 700 130 | 0.0560 0.0003 | (3.6 1.9)10-16 |
aFit from the H2 =1-0 S(1) components.
bFit from the Pa components.
cRest frame wavelengths from Thornton et al. (1999).
dRest wavelength not known accurately from atomic physics.
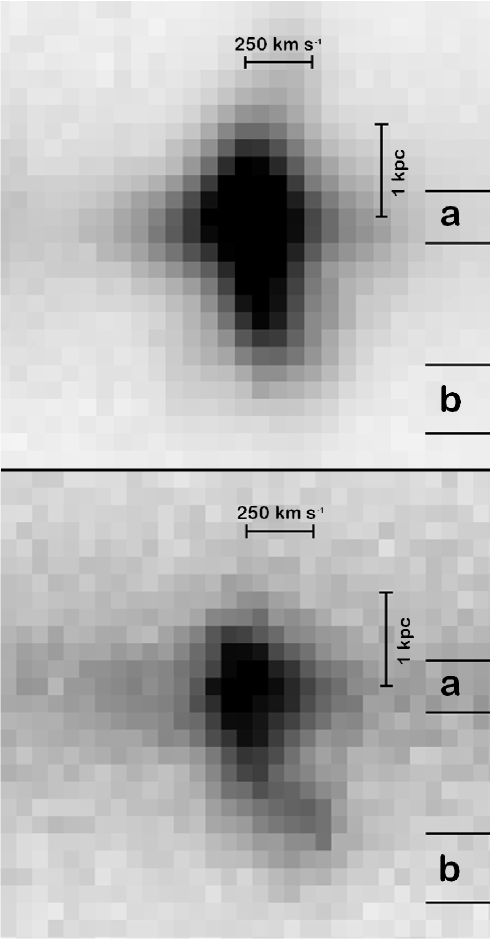
To examine the kinematics along the slit with good S/N, a number of apertures were extracted. Two of these apertures reveal the complex kinematics that are discussed in this paper. The first aperture is centred on the nucleus (to the nearest pixel) and has a width of three pixels (540 pc). The second aperture is centred 1 880 pc to the NW of the nucleus and is four pixels (720 pc) in width. Fig. 1 shows the greyscale 2D profiles of the Pa and the H2 =1-0 S(1) line emission with these apertures overlaid. Fig. 2 shows the 1D spectrum extracted from the PA105 central aperture.

The emission lines in the aperture spectra were fitted with Gaussian profiles using the dipso package. Each line was fitted with the minimum number of Gaussians required to give an acceptable fit. Table 1 shows the results of the line fitting. Several lines show evidence for multiple kinematic components (notably the brighter H2 lines) and these components have been fitted separately. We see no evidence for the H2 =2-1 S(2) line seen by Wilman et al. (2000), but note that their slit is approximately twice the width of the slit used in the acquisition of these Keck II data. This may suggest that the H2 =2-1 S(2) emission originates in a more extended region.
The Pa and molecular hydrogen lines are discussed in more detail in the following. As previously noted by Wilman et al. (2000), the Pa and molecular hydrogen lines exhibit different properties and are therefore discussed in separate sections. Where velocity scales and shifts are given, the zero velocity corresponds to the heliocentric z=0.05583, the centre of the Pa narrow component in the nuclear aperture. This systemic redshift is consistent with, though slightly lower than that deduced from the Pa/H2 rotation curves (Tadhunter et al. 2003: z=0.05592 0.00005).
3.1 Paschen alpha
The Pa emission exhibits kinematics, both on- and off-nucleus, that show similarities to those of the optical [O III] lines (Taylor et al. 2003). Unlike the case of the molecular hydrogen lines (see section 3.2), there are no comparable recombination lines with which to check the accuracy of the component fittings. However, the Pa line is the brightest line in the spectrum, and has a high S/N ratio, so we can be confident in the results of the fittings.
In the central nuclear aperture, the Pa line clearly has broad wings that cannot be fitted with a single Gaussian profile. Fitting shows a central narrow component with FWHM = 250 km s-1 and a much broader component with FWHM = 750 km s-1. HST/STIS data of the nuclear regions shows a rotation-curve in the [O III] line. Integrated over the inner 600 pc, and fitted with a single-Gaussian, the profile of the [O III] line gives a FWHM of 850 50 km s-1(Tadhunter et al. 2003). The broad Pa component is therefore likely to be due to a combination of unresolved rotation and turbulent motion in the 300 pc-scale nuclear disc. The centre of the broad component is coincident with that of the narrow component within 1 uncertainty.


The situation is different in the extended NW aperture in the PA105 data: this aperture is centred 1 880 pc NW of the nucleus, along the radio axis in the NW ionisation cone. In this aperture the Pa is split into two narrow components (FWHM 360 km s-1), one of which is significantly blueshifted by 240 30 km s-1 in the galaxy-frame (see Fig. 3); the other, brighter, component is redshifted by 120 13 km s-1. As can be seen in Fig. 3, these components provide a poor fit to the H2 emission in the same aperture. In the same spatial region, two components are seen in the [OIII] 5007 line at optical wavelengths: these are shifted by (-270 20) and (+100 15) km s-1 respectively (Taylor et al. 2003). Allowing for the different slit widths and systematic uncertainties, the Pa components are entirely consistent with the [O III] components of Taylor et al. (2003). Therefore the blueshifted component is likely to be associated with the emission line outflow in the NW cone.
3.2 Molecular hydrogen


The molecular hydrogen emission lines show a complex structure of kinematic components that is not seen in any of the other emission lines. In the central aperture of the PA105 data, three distinct components are seen in the H2 lines — a central ‘narrow’ component (FWHM = 160 km s-1) and two broader components (FWHMs = 270 and 370 km s-1). Fig. 4 shows these 3 components as fitted to the H2 =1-0 S(1) line. One of the broader components is blueshifted by (370 40) km s-1 with respect to the systemic velocity and the other is redshifted by (110 40) km s-1. These components were derived from the fitting to the H2 =1-0 S(1) line but also describe very well the profile of the H2 =1-0 S(2) (see Fig. 4) and, with different intensity ratios, the H2 =1-0 S(4). They also appear to fit the H2 =1-0 S(3), but this is less convincing due to the blend with the [Si VI] line. However, if the H2 =1-0 S(3) line is fit with the H2 =1-0 S(1) components, and the [Si VI] line with the Pa components, then the blend can be fitted acceptably. Fig. 4 shows that these H2 components do not provide a good fit to the Pa emission in the central aperture. These results contradict those of Wilman et al. (2000) who found the ortho-hydrogen lines [S(1) and S(3)] to be significantly broader than the para-hydrogen lines [S(2) and S(4)] on the nucleus. This discrepancy may be a result of the single-Gaussian fittings of Wilman et al. (2000) being insufficient to fit the actual line profiles.
As can be seen in Fig. 1, the molecular hydrogen shows a bright, shifted component to the NW of the nucleus. The slit is closely aligned with the rotation axis of the kpc-scale disc for these observations and, for this reason, the rotation of this disc would not lead to such shifted components. The extended structure can be seen in all the molecular hydrogen lines in the original 2D spectrum, but the best fit can be made with the bright H2 =1-0 S(1) line. Fitting to this line on a row-by-row basis reveals two components, one at the systemic velocity and one that is significantly redshifted. The two components exhibit no significant velocity variations across the range of the fitting. Fig. 5 shows the velocity structure of these components over the 0.8-2 kpc region. Fitting on a row-by-row basis at projected distances 0.8 kpc produces indefinite results without added constraints and these fits are therefore not plotted. These results indicate the existence of a molecular hydrogen cloud at a projected distance of 1.35 kpc from the nucleus (where the flux of the redshifted component peaks), redshifted by 243 7 km s-1 in the rest frame. This is consistent with the redshift of 227 9 km s-1 exhibited by one of the on-nucleus H I absorption components seen by Conway & Blanco (1995). The emission also appears to be spatially resolved with the flux distribution having a FWHM of 500pc (assuming a Gaussian intensity profile).

Overall, the H2 emssion shows kinematic components that are not seen in other lines. Possible explanations are discussed below.
4 DISCUSSION
4.1 The nuclear emission
The nuclear kinematics of the Pa line are undramatic and show no unusual or unexpected features. Broad (FWHM = 750 km s-1) and narrow (FWHM = 250 km s-1) components are detected, each symmetrically centred at the systemic redshift, with no evidence for any other components. These line widths are typical of those seen in the optical data of Taylor et al. (2003). The broad component compares well with the [O III] width integrated over the inner 300 pc (radius) disc as seen in the HST/STIS data of Tadhunter et al. (2003), suggesting it represents unresolved rotation and turbulent motions close to the nucleus.
The narrow component of the H2 lines, although narrower than the narrow Pa component (FWHM = 160 km s-1), is centred at the same systemic redshift within the uncertainties. The red and blueshifted components, however, are not so easily understood. Their widths, although broader than the central H2 component, are certainly not individually comparable to the broad Pa component. Furthermore, their velocity shifts are significantly asymmetric about the centre. What is the nature of these components? Are we seeing outflows in the nuclear regions? This is certainly a possibility, but it is hard to explain how we would then see the redshifted component. The blueshifted component would obviously correspond to material flowing out into the cone that is angled towards us and we would have a relatively clear view of this. The redshifted component, however, would correspond to an outflow on the far side of the nucleus and, as it is seen in the nuclear aperture, it would necessarily lay close to the circum-nuclear torus. It would therefore be subject to a high degree of extinction, even at near-IR wavelengths, and should not be so apparent. The fact that the redshifted component is the most luminous of the three, and a factor of 5 brighter than the blueshifted component, only further compounds the problem. Another consideration is that, if these components represent outflows within the ionisation cones, similar components should be seen in Pa due to the ionisation of the outflowing material. Such components are not seen.
It is more likely that these velocity-shifted components originate in the circumnuclear torus and are linked to its rotation. If, as is believed, we are viewing Cygnus A at close to the opening angle of the NW ionisation cone, then there is likely to be a relatively clear view of the outer parts of the circum-nuclear torus. The question to ask is why do we see three distinctly separate kinematic components rather than a continuous broadening of the molecular lines due to unresolved rotation? It is possible that clumpy obscuring material partially blocks our view and so we only sample part of the velocity structure. There is good evidence that there is patchy dust obscuration within the central region (Shaw & Tadhunter 1994, Stockton, Ridgway & Lilly 1994, Jackson et al. 1996) - although on a larger scale - so this is by no means an unreasonable explanation.
The H2 =1-0 S(3)/H2 =1-0 S(1) flux ratio is useful as a diagnostic indicator of the excitation mechanism of the H2 gas. In the nuclear aperture this ratio is found to be 1.23 0.03 (found by integrating the flux of the two lines over equivalent ranges). X-ray heating is expected to lead to a ratio of 1.2 (Lepp & McCray 1983). Our result is in good agreement with this and is consistent with the nuclear H2 gas being excited by emission from the AGN. Thornton et al. (1999) previously obtained a value of 1.20 0.14 for this ratio; although consistent with our result, this value fails to rule out shock excitation, expected to result in a ratio of 0.8-1.1 (Kwan 1977; Hollenbach & Shull 1977). The more precise value we have obtained seems to rule out shock excitation as a plausible mechanism.
As noted above, the split components visible in the H2 emission are conspicuously absent in Pa (see Fig. 4). This is explainable, however, by noting that the Pa emission from the torus would originate close to the ionised inner-edge in a relatively confined region, whereas the molecular hydrogen would originate in a larger, more extended region beyond this. Because of the large viewing angle with respect to the torus axis (60°), the nearside inner-edge of the torus lies behind the optically thick outer regions and we would therefore expect the Pa to be more highly obscured than the H2. The Pa from the far inner-edge should be visible however, but this will sample only a small velocity range and may therefore be detected as part of the observed broad component.
4.2 The extended H2 emission
What is the origin of the redshifted, extra-nuclear H2 component as seen to the NW of the nucleus (see Fig. 1 and Fig. 5)? There are four possible explanations that we will discuss: a gas outflow from the nucleus; nuclear light scattered off material further out; stellar excitation of H2 in a star-forming region; and an infalling or kinematically decoupled gas cloud passing through or close to the nucleus.
First we shall consider the possibility that this is emission from an outflowing gas cloud. On the face of it, this is the most apparent and satisfying explanation: the nuclear winds and radio jets provide ready-made driving mechanisms for outflows. Such outflows are an expected by-product of AGN activity and evidence for this in Cygnus A has already been detected in the [O III] lines (e.g. Taylor et al. 2003; van Bemmel et al. 2003). Indirect evidence for this phenomenon in Cygnus A is also provided by the hollowed out cones apparent in near-IR HST images of the core (Tadhunter et al. 1999). However, there are a number of problems with this explanation for the shifted H2 component. Firstly, if this cloud is outflowing within the ionisation cone, Pa emission from the photoionised edge of the cloud facing the nucleus would be observed with similar velocity shifts, but this is not detected. If this component can be seen in the H2 line it should certainly be seen in the much brighter Pa line. Secondly, since the NW cone is angled towards us, the far side of the cone lies close to the plane of the sky (30°): any outflowing cloud showing a redshift would therefore have to lie close to the far side of the cone and the necessary de-projected outflow velocity would be in excess of 450 km s-1. It is hard to envisage how the gas could be accelerated to such high velocities without being shocked, and shock speeds in excess of 50 km s-1 would lead to dissociation of the H2 as well as to Pa emission (Kwan 1977; Draine et al. 1983). The combination of these factors renders an outflow as an unlikely explanation.
There is also the possibility that the extended emission is nuclear light scattered off outflowing dust in the cone. In this case the geometry will always result in a net redshift of the emission unless the outflowing dust is moving directly towards us along our line-of-sight (van Bemmel et al. 2003). This would explain the redshift, but still does not explain the lack of an equivalent Pa component since, to reflect near-IR light, the scattering material must be optically thick and therefore relatively grey in its spectral response. This explanation was proposed in Tadhunter et al. (2003, see section 5.7) to explain the redshifted [O III] emission seen in the NW cone in HST-STIS optical data; the spectropolarimetry results of van Bemmel et al. (2003) are consistent with this model. However, this [O III] emission lies much closer to the nucleus than the H2 emission (200 pc as opposed to 1 350 pc) and shows a significantly larger velocity shift (450 km s-1 as opposed to 200 km s-1). As noted in Tadhunter et al. (2003), there is also a problem with the stability of any such dust within the ionisation cone and whether it could exist there without being destroyed, particularly since any gas associated with the dust must be hot enough to be in an ionised state to avoid being detected in emission itself.
Alternatively, the H2 emission may arise from the photodissociation zones associated with H II regions in which stars are forming; the stars themselves may remain unseen inside the optically thick clouds. However, near-IR observations of H II galaxies demonstrate that the Pa emission from such regions is strong relative to the H2, with a ratio of Pa/H2 =1-0 S(1) 5-30 (Veilleux et al. 1999). In contrast, the maximum ratio allowed by attempted three component fits to Pa is Pa/H2 =1-0 S(1) 2 for the redshifted component of H2. Therefore we conclude that the redshifted H2 component is unlikely to be excited by a young star forming region.
Finally we consider the case of the H2 emission being associated with an infalling cloud. Indeed, the possibility that Cygnus A is undergoing a minor merger event (Canalizo et al. 2003) suggests that such components should be present and natuarally explains the fact that the component we see is significantly redshifted. Infalling material has already been seen in the H I 21 cm absorption components of Conway & Blanco (1995) and the redshift of one of these components is in good agreement with the redshift of the extended H2 component, suggesting a common origin for the two. However, the problem of the missing Pa component remains. If it is falling through the ionisation cone, the cloud should be photoionised on its AGN-facing side regardless of the cloud’s origin. Alternatively, if it is outside the ionisation cone, and therefore shielded from the AGN, then what is stimulating the molecular emission? An intriguing possibility is that the cloud may be in the foreground outside the ionisation cone. Here it would be shielded from the majority of the AGN emission but would still be illuminated by the more penetrating hard X-ray radiation. The cloud will appear optically thin to these hard X-rays resulting in less photoionisation (and hence little emission from recombination lines such as Pa), but with the fast electrons released in the rare photoionisation events capable of thermally exciting large quantities of the molecular gas (Lepp & McCray 1983). This is a plausible explanation for the discrepancy between the Pa and H2 emission profiles and one that rules out a simple outflow, since it is hard to see how the AGN could be driving outflows beyond the confines of its ionisation cones.
As a test of the infalling cloud premise, the H2 luminosity of the cloud can be compared to the hard X-ray luminosity of the AGN. Approximately 0.2% of the 2-10 keV X-ray flux incident on the gas cloud will be re-emitted in the H2 =1-0 S(1) line (Lepp & McCray 1983), therefore the 2-10keV/H2 =1-0 S(1) luminosity ratio leads directly to an estimate of the covering factor of the cloud. For our cosmology, the intrinsic 2-10 keV hard X-ray luminosity of the AGN (deduced from Young et al. 2002) is 1.64 1044 erg s-1. If the molecular cloud is outside the ionisation cone it should see this X-ray emission through a similar amount of obscuration as we do along our line-of-sight. We therefore reapply Young et al.’s inferred extinction (column density NH = 2.0 1023 cm-2) to derive an obscured luminosity of 1.44 1044 erg s-1. The integrated luminosity of the extended H2 =1-0 S(1) emission is (4.9 0.3) 1039 erg s-1. Accounting for the 0.2% efficiency factor, this implies a cloud covering factor of 1.7 10-2. At a projected distance of 1.35 kpc this equates to a cloud with a circular cross-section 360 pc in radius. This is large for a typical single GMC, but a merger event would be expected to involve a large mass of material distributed in several molecular cloud complexes. The extended H2 structure appears to be spatially resolved and has an approximate FWHM of 500pc wich is in good agreement with the results of the above calculation.
Certainly, the infalling cloud model seems to be the most appealing explanation of the four possibilities. The observed redshift is readily explained and the lack of a matching Pa component is not problematic. The missing Pa alone is good grounds for eliminating the other explanations and, as described, there are also other problems associated with them. The fact that the H2 redshift is in agreement with the redshift of the H I absorption component is also encouraging. This infalling cloud scenario also ties in well with the postulated merger event of Canalizo et al. (2003). Unfortunately the S/N of the data is insufficient for the extended component to be fit to anything other than the H2 =1-0 S(1) line, meaning that no information can be obtained about the excitation of this extended component. However, the motions of the H2 cloud clearly cannot be accomodated within the framework of the (equilibrium) kinematics of the kpc-scale disc associated with the dust lane.
Although the infalling H2 cloud may not be responsible for fuelling the nuclear activity directly, the process of capture of the cloud, and subsequent dissipative settling into the kpc-scale disc, will lead to radial gas motions in the disc and an increased fuelling rate of the AGN. In such a scenario, the dynamical timescale required for all the gas associated with the merger event to settle into the disc is likely to be comparable with the lifetime of the quasar and jet activity.
5 CONCLUSIONS AND FURTHER WORK
Our near-IR data have further strengthened the case for the existence of complex, non-gravitational kinematics in the core of the nearby radio galaxy Cygnus A. We show several distinct Pa components, both on- and off-nucleus, that are consistent with the [O III] components seen in the optical data of Taylor et al. (2003). The molecular hydrogen emission, however, shows markedly different kinematics that are inconsistent with both the Pa and optical data.
We have found good evidence for the existence of an infalling molecular cloud to the NW of the nucleus and have argued that this lies outside the main ionisation cone and is being excited by the more penetrating hard X-ray emission from the AGN. The redshift of this infalling component is in excellent agreement with that of the H I absorption detected by Conway & Blanco (1995), suggesting the two phenomena are linked. The fact that the H I absorption is seen on-nucleus, whereas the H2 emission is seen at a projected radius of 1.35 kpc, suggests that the infalling material is likely to have a complex and extended spatial structure.
We suggest the possibility that the non-circular motions and infalling material in the nuclear regions are linked to a possible merger event (Canalizo et al. 2003) that may have triggered the AGN activity itself.
However, the problem remains that these long-slit data give kinematic information only along the radio axis, whereas a minor merger event could be expected to lead to non-gravitational motion and flows throughout the cones. Future near-IR integral field data that map the structure and kinematics of the H2 emission throughout the cone will reveal if the redhifted emission is associated with the radio jet itself or is more evenly distributed in the near-nuclear regions. Near-IR adaptive optics spectroscopy of the nuclear regions will also be able to clarify the nature of the asymmetrically shifted H2 components seen in our nuclear aperture.
ACKNOWLEDGEMENTS
We acknowledge the facilities and thank the staff at the Keck II telescope and the Mauna Kea facility. We also thank the referee, Neal Jackson, for his helpful comments and suggestions. MJB is supported by a PPARC studentship. We acknowledge the data analysis facilites at Sheffield provided by the Starlink Project, which is run by CCLRC on behalf of PPARC.
References
- Bessell et al. (1998) Bessell M. S., Castelli F., Plez B., 1998, A&A, 333, 231
- Canalizo et al. (2003) Canalizo G., Max C., Whysong D., Antonucci R., Dahm S. E., 2003, ApJ, 597, 823
- Conway & Blanco (1995) Conway J. E., Blanco P. R., 1995, ApJ, 449, L131
- Draine et al. (1983) Draine B. T., Roberge W. G., Dalgarno A., 1983, ApJ, 264, 485
- Fosbury et al. (1999) Fosbury R. A. E., Vernet J., Villar-Martin M., Cohen M. H., Ogle P. M., Tran H. D., 1999, in Rottgering H. J. A., Best P. N., Lehnert M. D., eds, The Most Distant Radio Galaxies, Proceedings of the colloquium, Amsterdam, 15-17 October 1997, Royal Netherlands Academy of Arts and Sciences p. 311
- Hollenbach & Shull (1977) Hollenbach D. J., Shull J. M., 1977, ApJ, 216, 419
- Jackson et al. (1998) Jackson N., Tadhunter C., Sparks W. B., 1998, MNRAS, 301, 131
- Jackson et al. (1996) Jackson N., Tadhunter C., Sparks W. B., Miley G. K., Macchetto F., 1996, A&A, 307, L29
- Kwan (1977) Kwan J., 1977, ApJ, 216, 713
- Lepp & McCray (1983) Lepp S., McCray R., 1983, ApJ, 269, 560
- Ogle et al. (1997) Ogle P. M., Cohen M. H., Miller J. S., Tran H. D., Fosbury R. A. E., Goodrich R. W., 1997, ApJ, 482, L37
- Shaw & Tadhunter (1994) Shaw M., Tadhunter C., 1994, MNRAS, 267, 589
- Stockton et al. (1994) Stockton A., Ridgway S. E., Lilly S., 1994, AJ, 108, 414
- Tadhunter et al. (2003) Tadhunter C., Marconi A., Axon D., Wills K., Robinson T. G., Jackson N., 2003, MNRAS, 342, 861
- Tadhunter (1991) Tadhunter C. N., 1991, MNRAS, 251, 46P
- Tadhunter et al. (1999) Tadhunter C. N., Packham C., Axon D. J., Jackson N. J., Hough J. H., Robinson A., Young S., Sparks W., 1999, ApJ, 512, L91
- Taylor et al. (2003) Taylor M. D., Tadhunter C. N., Robinson T. G., 2003, MNRAS, 342, 995
- Thornton et al. (1999) Thornton R. J., Stockton A., Ridgway S., 1999, AJ, 118, 1461
- Ueno et al. (1994) Ueno S., Koyama K., Nishida M., Yamauchi S., Ward M. J., 1994, ApJ, 431, L1
- van Bemmel et al. (2003) van Bemmel I. M., Vernet J., Fosbury R. A. E., Lamers H. J. G. L. M., 2003, MNRAS, 345, L13
- Veilleux et al. (1999) Veilleux S., Sanders D. B., Kim D.-C., 1999, ApJ, 522, 139
- Ward et al. (1991) Ward M. J., Blanco P. R., Wilson A. S., Nishida M., 1991, AJ, 382, 115
- Wilman et al. (2000) Wilman R. J., Edge A. E., Johnstone R. M., Crawford C. S., Fabian A. C., 2000, MNRAS, 318, 1232
- Young et al. (2002) Young A. J., Wilson A. S., Terashima Y., Arnaud K. A., Smith D. A., 2002, ApJ, 564, 176