22institutetext: International School for Advanced Studies, SISSA/ISAS, Via Beirut 2-4, I-34014 Trieste, Italy
Radio source contamination of the Sunyaev-Zeldovich effect in galaxy clusters
By cross-correlating the 1.4 GHz FIRST catalog of radio sources with the Abell cluster catalog we have found an excess surface density by a factor of radio sources within a projected distance, , of 0.1 Mpc (for ) from the cluster center. The profile of the excess density can be described, for Mpc, by a -model with a core radius of Mpc and . The luminosity function of cluster sources does not show hints of cosmological evolution over the redshift range () covered by our cluster sample. The mean luminosity function is in excellent agreement with the recent determination by Reddy & Yun (2004) for 7 nearby clusters and extends it by two orders of magnitude to higher luminosities. Its shape is very similar to that of the local luminosity function of field galaxies, but the space density is about 3000 times higher. When extrapolated to 30 GHz, our luminosity function compares very favourably with an estimate obtained directly from the 30 GHz observations by Cooray et al. (1998). The antenna temperature contributed by radio sources within the nominal cluster radius of Mpc is estimated to be K at 30 GHz for clusters at and decreases to K at , in the absence of cosmological evolution; it increases by a factor of within 0.25 Mpc from the cluster center. If the pure luminosity evolution models by Dunlop & Peacock (1990) are adopted, the radio source antenna temperature turns out to be essentially independent of redshift.
Key Words.:
Cosmic microwave background — Galaxies: clusters: general — radio continuum: galaxies1 Introduction
Over the last decade the quality of observations of the Sunyaev-Zeldovich (SZ) effect (Sunyaev & Zeldovich 1972, 1980, 1981) towards galaxy clusters has dramatically improved, so that it is now routinely detected with high S/N and even imaged (Carlstrom et al. 2002). To fully exploit the extraordinary information content of the effect, however, one needs to take into account the sources of possible contamination.
Since powerful radio sources are normally associated to early-type galaxies and these preferentially reside in clusters, a strong over-density of radio sources, which could partly fill the SZ dip in the Rayleigh-Jeans region, is naturally expected in clusters. And, indeed, radio sources were found to be the major contaminant of experiments using centimeter-wavelength receivers (Cooray et al. 1998; LaRoque et al. 2003).
In this paper, we exploit the FIRST (Becker et al. 1995; White et al. 1997) survey at 1.4 GHz to investigate the correlation function of radio sources with Abell clusters (Abell 1958) and to derive an estimated of the luminosity function of radio sources in clusters. Coupling the FIRST with the GB6 (Gregory et al. 1996) survey, we obtain an estimate of the spectral index distribution that we use to extrapolate the luminosity function to centimeter wavelengths and to estimate the mean contamination of the SZ signal as a function of the cluster redshift.
2 FIRST sources within cluster solid angles
2.1 Source selection
We have used the April 2003 update of the FIRST survey catalog (sundog.stsci.edu/first/catalogs.html), containing 811,117 radio sources over an area of 8,422 square degrees in the North Galactic cap and 611 square degrees in the South Galactic cap, with a detection threshold of about 1 mJy and an angular resolution of . The integrated flux was adopted for sources labelled as extended and the peak flux for the others.
We have looked for FIRST sources within a projected distance of Mpc (typical cluster virial radius), Mpc, and Mpc from the Abell cluster centers, for a flat CDM cosmology (, ) and (or ). We have kept only those clusters fully within the FIRST area (taking into account the “holes” in such area). We have also excluded clusters partially overlapping with each other.
Measured redshifts for 368 Abell clusters in the FIRST area are listed in Struble & Rood (1999); 1 additional redshift measurement was found in Pimbblet et al. (2001). Redshift estimates for the remaining 582 clusters were obtained using the relationship between redshift and magnitude of the tenth brightest cluster galaxy derived by Postman et al. (1985), which includes a correction for the Scott effect. A comparison of estimated with measured redshift showed this relationship to be superior to those proposed by other Authors (Fullerton et al. 1972; Leir et al. 1974; Kalinkov et al. 1994).
Our final sample comprises 951 clusters with a total of 617, 5,574, and 35,526 radio sources within 0.25 Mpc, 1 Mpc, and 3 Mpc from the cluster centers, respectively. We have also selected 738 control fields, each having an angular radius of and whose centers are more than away from the center of any of the clusters. The control fields contain a total of 51,770 radio sources.
| -1.80 | -1.15 | 41 | E+5 | E+5 | E+5 |
|---|---|---|---|---|---|
| -1.15 | -1.00 | 81 | E+5 | E+5 | E+5 |
| -1.00 | -0.90 | 130 | E+5 | E+5 | E+5 |
| -0.90 | -0.85 | 201 | E+5 | E+5 | E+5 |
| -0.85 | -0.80 | 149 | E+5 | E+4 | E+5 |
| -0.80 | -0.75 | 168 | E+5 | E+5 | E+5 |
| -0.75 | -0.70 | 105 | E+5 | E+5 | E+5 |
| -0.70 | -0.35 | 76 | E+6 | E+5 | E+5 |


2.2 Analysis of the sample
The cluster sample has been divided into 8 redshift intervals. The mean surface densities within 0.25, 1, and 3 Mpc from the cluster centers, and their errors are listed, for each interval, in Table 1. Figure 1 shows an example of the distribution of surface densities within 0.25 Mpc, , compared with the distribution for control fields. The mean value of () is typically almost a factor of 3 higher than in control fields, without any significant trend with redshift. Cooray et al. (1998), who surveyed 56 clusters, within from the pointing centers, at 28.5 GHz, to a detection limit mJy, found 4 to 7 times more sources than expected from a simple extrapolation of low-frequency counts outside clusters.
The over-density towards clusters is still quite substantial within 1 Mpc from the cluster centers and is weak, but still statistically significant, within 3 Mpc. A Kolmogorov-Smirnov test gives, for the first redshift bin in Table 1, probabilities of and of that the distributions of and of , respectively, are drawn from the same parent distribution as for control fields. Such probability drops by orders of magnitude for the higher redshift bins. The difference with control fields of the distribution of is not significant for the lowest redshift bin, is , for the second lowest redshift, is for the sixth bin, and is orders of magnitude lower for all the other bins. The densities and correlate with redshift, although the redshift dependence is rather weak.
To characterize more quantitatively the over-density, we have computed the projected radio source-cluster two-point correlation function, , as a function of the projected linear distance, , from the cluster center, using the formula:
| (1) |
where is the mean number of sources within annuli of width Mpc, centered in the cluster centers, is the mean number of control field sources in areas equal to those of the annuli, and is equal to the inner radius of annuli plus . The errors on where estimated as [Peacock 1999, Eq. (16.111)].
As shown by Fig. 2, the surface density of sources close to the cluster center is about a factor of 5 higher than in the control fields, and decreases by more than a factor of 10 at a radius of Mpc. Except for the innermost point, the projected correlation function, can be described by a -model (Cavaliere & Fusco-Femiano 1976) surface-density profile
| (2) |
with Mpc and . For comparison, Reddy & Yun (2004) found, for a sample of 182 radio galaxies in 7 nearby, rich, X-ray luminous clusters, Mpc (scaled to our choice for the Hubble constant) and .

| 20.3 | |
|---|---|
| 20.7 | |
| 21.1 | |
| 21.5 | |
| 21.9 | |
| 22.3 | |
| 22.7 | |
| 23.1 | |
| 23.5 | |
| 23.9 | |
| 24.3 |
3 Luminosity function of radio galaxies in clusters
Reddy & Yun (2004) have estimated the mean 1.4 GHz luminosity function of galaxies in 7 nearby clusters containing a total of 182 NVSS (Condon et al. 1998) sources, assuming a uniform distribution within a cluster radius of 1.5 Mpc for (or 1.73 Mpc for the value of the Hubble constant, , adopted here).
Since the median density of radio galaxies within 0.25 Mpc from the cluster center is sources/sr (Table 1), i.e. a factor larger than the field density, an average of 63% of the 617 galaxies within such radius are cluster members and we may attempt to estimate their luminosity function. Following Reddy & Yun (2004), we have assumed a uniform distribution within a cluster radius of 1.73 Mpc (for our choice of the Hubble constant); the sampled volume is then the intersection of such sphere with a cylinder with radius of 0.25 Mpc. The derived densities have been scaled down by a factor of 0.63 to take into account the foreground/background contamination and by a further factor of 4.48 to convert the mean density within the sampled volume into the mean density within the adopted cluster radius.
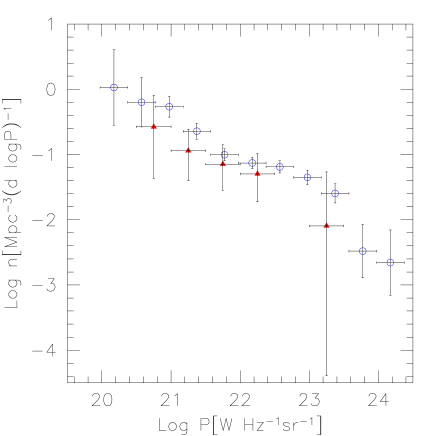
To check for possible evolutionary effects we have carried out separate estimates for each redshift bin in Table 1. Results for three representative redshift bins are shown in Fig. 3. No indication of evolution is apparent. The low luminosity excess found for the lowest luminosity bin is likely due to contamination. Since we consider sources within a fixed physical radius the number (but not the fraction) of outliers (proportional to the corresponding solid angle) increases with decreasing redshift; the flux densities of field sources are preferentially close to the survey limits and therefore affect more the lowest luminosity bins.
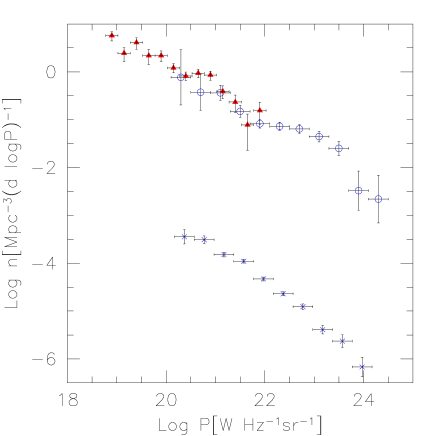
In the absence of evidences of cosmological evolution of the luminosity function, we have lumped all galaxies together to derive the mean luminosity function presented in Table 2. Figure 4 shows that our estimate nicely agrees with that by Reddy & Yun (2004), based on totally different approach, and extends it by two orders of magnitude in luminosity. The figure also compares the cluster with the field local luminosity function recently determined by Magliocchetti et al. (2002). The shape of the luminosity functions is similar but density of radio sources in clusters is about 3000 times higher than in the field. For comparison, the matter overdensity in a cluster formed at a redshift is for a formation redshift .
The integral of the 1.4 GHz cluster luminosity function, made adopting the estimate by Reddy and Yun (2004) for and our results for higher luminosities, gives a mean cluster radio luminosity .


4 Radio source contamination of Sunyaev-Zeldovich signals
To extrapolate the 1.4 GHz cluster luminosity to the higher frequencies used for measurements of the Sunyaev-Zeldovich effect, we need the spectral index distribution of sources. To get some information on that, we have cross-correlated the GB6 4.85 GHz catalog (Gregory et al. 1996) with our cluster sample, looking for sources within 0.25 Mpc from the cluster center. The number of matches is relatively small (46 sources) because of the relatively bright flux density limit (18 mJy, to be compared with the 1 mJy FIRST limit). The identification of GB6 with FIRST sources is complicated by the relatively poor GB6 angular resolution. In fact, in several cases we have multiple FIRST sources within the GB6 beam (). In these cases, we have taken as the 1.4 GHz flux density of the GB6 sources the sum of FIRST flux densities weighted with a Gaussian response function with and axis towards the nominal GB6 position. Assuming power-law spectra () we found that, of the 46 GB6 sources, 12 are flat-spectrum () and 34 are steep-spectrum (), so that the ratio of flat to steep spectrum sources is 0.35(, ), consistent with the ratio (0.41) we found for a random sample of 1548 field sources. The mean spectral indices are and .
The ratio of 4.85 GHz luminosity densities of flat- to steep-spectrum cluster sources is 0.38. Adopting the above mean spectral indices, such ratio becomes 0.15 at 1.4 GHz. Using this ratio, we partition the total cluster radio luminosity as and and extrapolate these luminosities to higher frequencies using the corresponding mean spectral indices.
The big extrapolation in frequency required to reach the spectral range where most SZ surveys are carried out (GHz) clearly makes our estimates, based on limited information on the 1.4 to 4.85 GHz spectral indices, liable to large uncertainties. In fact, the low-frequency spectral indices may not apply up to much higher frequencies. Also, sources with strongly inverted spectra, such as extreme GHz Peaked Spectrum sources, undetected by low frequency surveys, may become important at high frequencies. An important test of our estimates is provided by the 30 GHz cluster survey by Cooray et al. (1998). These Authors have detected at a total of 35 radio sources, towards 56 clusters. If indeed, as argued by Cooray et al. (1998), most detected sources are physically associated to the clusters, we may derive their luminosities attributing to them the redshift of the associated cluster and estimate a mean 30 GHz luminosity function of cluster sources. Extrapolating to 30 GHz the mean surface densities of flat- and steep-spectrum sources in our control fields, we find that the fraction of background/foreground sources in their cluster fields is , consistent with the estimates by Cooray et al. (1998). The derived 30 GHz luminosity function was correspondingly scaled down by a factor of 1.25. In Fig. 5 this estimate is compared with the extrapolation to 30 GHz of our 1.4 GHz luminosity function, using the previously determined mean spectral indices for flat- and steep-spectrum sources. Although, due to the smallness of the 30 GHz sample, the uncertainties are large and the region of overlap is limited, the agreement is reassuringly good, supporting our choices for the mean spectral indices and indicating that we are not missing important source populations.
The contamination of the SZ effect by radio sources is more usefully expressed in terms of antenna temperature as:
| (3) |
where , is the Boltzmann constant and is the physical radius of clusters, assumed here to be 1.73 Mpc.
The results are shown as a function of the cluster redshift, for 4 frequencies, in Fig. 6 where we have considered two cases: no-evolution, as suggested by the analysis in Fig. 3 (solid lines), and pure luminosity evolution (Dunlop & Peacock 1990; dotted lines). The latter are probably to be taken as upper limits, at least for the redshift range covered by our cluster sample (). The frequency dependence of the antenna temperature for , the median redshift of our cluster sample, is shown in Fig. 7.
5 Conclusions
A cross-correlation of FIRST radio sources with Abell clusters has demonstrated an excess surface density by a factor of radio sources within a projected distance, , of 0.1 Mpc (for ) from the cluster center. At larger radii, the profile of the excess density can be described by a -model (Cavaliere & Fusco-Femiano 1976) with a core radius of Mpc and [see Eq. (2)].
Within Mpc, chosen as a compromise between the conflicting requirements of maximizing the sample size on one side and of minimizing the foreground/background contamination on the other side, we have a total of 617 sources within 951 Abell clusters, at redshifts , with a median surface density a factor of 2.7 higher than in the field, implying that 63% of sources are cluster members. Their mean luminosity function does not show any evidence for cosmological evolution. Lumping all sources together and taking into account the surface density profile we have obtained an estimate of the mean luminosity function at 1.4 GHz in excellent agreement with that derived by Reddy & Yun (2004) studying 7 nearby, X-ray luminous clusters, in the overlapping luminosity range, and extending to luminosities two orders of magnitude higher.
The lack of evidence for cosmological evolution up to is at odds with the predictions of the pure luminosity evolution models by Dunlop & Peacock (1990), indicating that either the evolutionary behaviour of sources in clusters and in the field differ or that such models overestimate the radio source evolution at low redshifts.
No significant differences between the properties of sources in clusters and in the field have emerged. The shape of our estimated luminosity function is very similar to the local luminosity function in the field at the same frequency (1.4 GHz), recently determined by Magliocchetti et al. (2002). The mean density is however about 3000 times higher, a factor that corresponds to the matter overdensity in clusters formed at .
The distribution of spectral indices, derived exploiting the 4.85 GHz GB6 survey, is also consistent with being the same in clusters and in the field. Having estimated the fractions of steep- and flat-spectrum sources and the mean spectral indices of the two populations we have derived the mean emission of cluster sources, as a function of redshift and of frequency. The 30 GHz luminosity function obtained extrapolating our estimate at 1.4 GHz is found to be in good agreement with that derived directly from the 30 GHz observations by Cooray et al. (1998).
If sources do not evolve, their mean contamination of cluster SZ effects, in terms of antenna temperature, decreases with increasing redshift. For example, for observations at 30 GHz with angular resolution matching the assumed cluster radius of 1.7 Mpc () we estimate a mean contamination of K at and of K at . The contamination increases by a factor of 1.5 within 0.25 Mpc from the cluster center. If the pure luminosity evolution models by Dunlop & Peacock (1990) are adopted, the contamination level turns out to be very weakly redshift dependent. Obviously, the contamination level drops rapidly with increasing frequency and becomes pretty large at wavelengths above a few centimeters.
Acknowledgements.
We thank the referee for having suggested the comparison with the data by Cooray et al. (1998). Work supported in part by MIUR (through a COFIN grant) and ASI.References
- (1) Abell, G. O. 1958, ApJS, 3, 211
- (2) Becker, R. H., White, R. L., & Helfand, D. J. 1995, ApJ, 450, 559
- (3) Carlstrom, J. E., Holder, G. P., & Reese, E. D. 2002, ARA&A, 40, 643
- Cavaliere & Fusco-Femiano (1976) Cavaliere, A., & Fusco-Femiano, R. 1976, A&A, 49, 137
- (5) Cooray, A. R., Grego, L., Holzapfel, W. L., Joy, M., & Carlstrom, J. E. 1998, AJ, 115, 1388
- (6) Dunlop, J. S. & Peacock, J. A. 1990, MNRAS, 247, 19
- (7) Fullerton, W. & Hoover, P. 1972, ApJ, 172, 9
- (8) Gregory, P. C., Scott, W. K., Douglas, K., & Condon, J. J. 1996, ApJS, 103, 427
- (9) Kalinkov, M., Kuneva, I., & Valtchanov, I. 1994, adass, 3, 263
- (10) LaRoque, S. J., Joy, M., Carlstrom, J. E., et al. 2003, ApJ, 583, 559
- (11) Leir, A. A. & van den Bergh, S. 1977, ApJS, 34, 381
- (12) Magliocchetti, M., Maddox, S. J., Jackson, C. A., et al. 2002, MNRAS, 333, 100
- (13) Peacock, J. A. 1999, Cosmological Physics. Cambridge University Press.
- (14) Pimbblet K. A., Smail I., Edge A. C., Couch W. J., O’Hely E., Zabludoff A. I. 2001, MNRAS, 327, 588
- (15) Postman, M., Huchra, J. P., Geller, M. J., & Henry, J. P. 1985, AJ, 90, 1400
- (16) Reddy, N. A. & Yun, M. S. 2003, IAUJD, 10,
- (17) Struble, M. F. & Rood, H. J. 1999, ApJS, 125, 35
- Sunyaev & Zeldovich (1972) Sunyaev, R.A., & Zeldovich Y.B. 1972, CoASP, 4, 173
- (19) Sunyaev, R. A. & Zeldovich, I. B. 1980, ARA&A, 18, 537
- (20) Sunyaev, R. A. & Zeldovich, I. B. 1981, ASPRv, 1, 1
- White et al. (1997) White, R.L., Becker, R.H., Helfand, D.J., & Gregg, M.D. 1997, ApJ, 475, 479