L. Amati
11email: amati@bo.iasf.cnr.it
Intrinsic spectra and energetics of cosmological Gamma–Ray Bursts
Abstract
We extend a previous work on the intrinsic spectral properties and energetics of GRBs with known redshift based on 12 BeppoSAX events by including in the sample a total of 10 more events detected either by BATSE, BeppoSAX or HETE–2. An indication of a trend of the total isotropic equivalent radiated energy, , with redshift is found and, remarkably, the previously found relationship between the peak energy of the rest–frame F spectrum, , and is confirmed and its significance increased. The implications of these results are briefly discussed in the framework of standard models for the prompt emission of GRBs.
keywords:
gamma–rays: observations – gamma–rays: bursts1 Introduction
In the past, the spectral studies of GRBs put in evidence very important
properties, like
fast spectral evolution, non thermal spectrum with a smoothly broken power-law shape
that can be satisfactorily reproduced in many cases by Synchrotron Shock Models (SSM),
narrow distributions of the spectral parameters, in particular of the peak energy
of
the F spectrum,
hardness-duration and hardness–intensity relationships (e.g. Band et al. 1993,
Tavani 1997, Paciesas et al. 1999, Preece et al. 2000, Frontera et al. 2000
).
Nevertheless, the impact of these results on the understanding of the nature
of GRBs and of the emission mechanism(s) producing the prompt emission
were strongly
limited
by the lack of knowledge of the GRBs distance scale and thus of their energetics and
intrinsic spectral shape.
But in 1997, the BeppoSAX breakthrough
discovery of afterglow emission from GRBs, leading to the first
redshift measurements for these sources,
started a new era in GRB science.
All the GRBs for which a redshift could be estimated lie at cosmological distances
(z= 0.17 - 4.5) (except for GRB 980425 if associated with SN1998bw, =0.0085)
and the total isotropic equivalent radiated energy, , is huge: from 1051 erg
up to 1054 erg (again with the exception of GRB 980425).
The spectral analysis of GRBs with known redshift (30 events up to now) can produce
a big step forward with respect
to previous spectral studies, allowing e.g.
the measurement of the distribution of the rest–frame peak energy,
, the
study of spectral parameters as a function of
and redshift,
the search for redshift indicators.
In a previous work (Amati et al. 2002), we studied the intrinsic spectra and
energetics of a
sample of 12 GRBs simultaneously detected by the WFC (2-28 keV) and GRBM
(40-700 keV) instruments on board BeppoSAX (Boella et al. 1997 )
and
for which redshift estimates were available.
This analysis took advantage also of the extension of the spectral fitting energy
range down to 2 keV, allowing better estimate of low energy index
with respect
e.g. to BATSE (20-2000 keV) and to reduce the –
correlation and data
truncation effects. The main results were
the indications of a trend of and with
and, importantly, the
evidence of a correlation between and .
The latter correlation is in agreement with previous indications inferred from BATSE
detected events without knowledge of (Lloyd, Petrosian & Mallozzi 2000)
and with the predictions of some
realizations of SSM scenarios.
In addition, our results indicated that the intrinsic distribution of could be
much broader than that inferred from non redshift–corrected spectra.
A detailed analysis of the combined WFC/GRBM sensitivity thresholds showed that
selection and data truncation effects did not affect significantly our results.
The major problem with these results was the small number of events included in the
sample, but now spectral parameters are available for more GRBs with
known redshift (e.g. Jimenez, Band & Piran 2001, Barraud et al. 2003
).
In this work we present and discuss the results of the same analysis on
an enlarged sample including,
in addition to the 12 events considered in Amati et al. (2002), 4 HETE–2 events,
4 BATSE events and 2 more BeppoSAX events, for a total of 22 events (Table 1).
2 GRB sample and data analysis
The GRBs included in our sample and their redshift values, see Jimenez, Band & Piran (2001), Amati et al. (2002), Bloom (2003), Atteia (2003) for a complete list of references, are reported in Table 1, together with the most relevant best fitting parameters of their intrinsic spectra and the computed isotropic equivalent radiated energies. The fitting model was either the canonical Band function (Band et al. 1993 ), whose spectral parameters are the low energy index , the high energy index and the break energy E0, or, for three of the HETE–2 events (see Barraud et al. 2003), a cut–off power–law with index and cut–off energy Ec . The spectral shape of these two models is nearly the same up to energies not much higher than , which is given by multiplied by E0 or Ec. For the BeppoSAX events, the fits were performed on the blue-shifted spectra in order to obtain the spectral shape in the GRB cosmological rest-frame, as was done in Amati et al. (2002). For the HETE–2 and BATSE events we derived the parameters of the cosmological rest-frame spectra from the published measured ones by accounting for the fact that and are invariant with redshift, E0 scales as and the overall normalization as . The measured spectral parameters of the BATSE events were taken from Jimenez, Band & Piran (2001) and those of the HETE–2 events were taken from Barraud et al. (2003) and Atteia (2003). The uncertainties on the parameters values reported in Table 1 are at 1 level and, when not available, are conservatively assumed to be 20% of the best fit values. The total radiated energies were then computed by integrating the best fit models to the cosmological rest–frame spectra from 1 to 10000 keV and scaling by the luminosity distances in the way described by Amati et al. (2002). We assumed a standard cosmology with H0=65 km/s/Mpc, m=0.3 and Λ=0.7 . The uncertainties on the values reported in Table 1 were derived from those on the measured fluences, which were assumed to be 10% when not available. The Pearson’s correlation coefficients reported and discussed in the next section were performed by properly weighting for data uncertainties.
3 Results
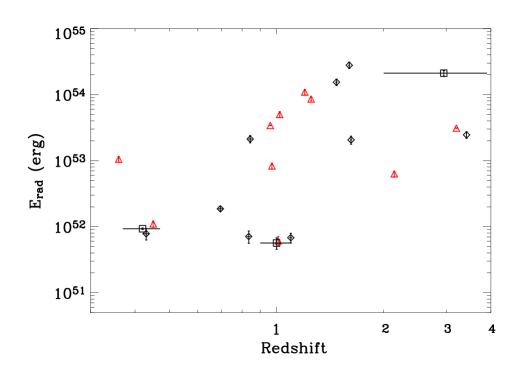
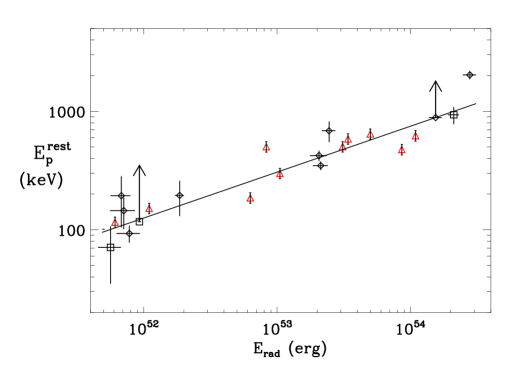
The spectral parameters in the cosmological rest frame and the isotropic equivalent total radiated energies of the GRBs included in our sample, computed as described in the previous section, are reported in Table 1. The values of Erad span over nearly three orders of magnitude and a considerable spread of the intrinsic values is found. The values of also vary substantially from burst to burst and are always consistent with the limits predicted for optically thin synchrotron emission (0.67,1.5). As can be inferred directly from Table 1, the indication of a dependence of on is slightly weakened with respect to what found for the ’old’ sample. In Fig. 1 and Fig. 2 we plot vs. and vs. , respectively. By adding the new 10 events (triangles), the trend of with is confirmed; in particular there is indication of a trend of the maximum isotropic equivalent radiated energy with redshift, with the only exception of GRB011121. The correlation coefficient between the logarithms of these two quantities is =0.61 for 22 events, corresponding to a chance probability of 0.2% . But, as apparent from Fig. 2, the most striking result is that with the addition of the new events the correlation between and is confirmed and its significance increased. Indeed, the correlation coefficient between log() and log) is = 0.90, corresponding, for 20 events (the upper limits available for GRB000214 and GRB010222 were obviously not included in the correlation analysis) to a chance probability as low as 1.310-7 . The slope of this relationship is 0.350.06, which is lower than the value found for the ’old’ sample (Amati et al. 2002).
| GRB | Mission | Model | ||||
|---|---|---|---|---|---|---|
| (keV) | (1052 erg) | |||||
| 970228 | SAX | 0.695 | Band | 1.540.08 | 19564 | 1.860.14 |
| 970508 | SAX | 0.835 | Band | 1.710.10 | 14543 | 0.710.15 |
| 970828 | BATSE | 0.958 | Band | 0.700.14 | 586117 | 344 |
| 971214 | SAX | 3.412 | Band | 0.760.17 | 685133 | 243 |
| 980326 | SAX | 0.9–1.1 | Band | 1.230.21 | 7136 | 0.560.11 |
| 980329 | SAX | 2.0–3.9 | Band | 0.640.14 | 935150 | 21120 |
| 980613 | SAX | 1.096 | Band | 1.430.24 | 19489 | 0.680.11 |
| 980703 | BATSE | 0.966 | Band | 1.310.26 | 50364 | 8.30.8 |
| 990123 | SAX | 1.600 | Band | 0.890.08 | 2030161 | 27832 |
| 990506 | BATSE | 1.307 | Band | 1.370.28 | 624130 | 10911 |
| 990510 | SAX | 1.619 | Band | 1.230.05 | 42342 | 203 |
| 990705 | SAX | 0.842 | Band | 1.050.21 | 34828 | 213 |
| 990712 | SAX | 0.433 | Band | 1.880.07 | 9315 | 0.780.15 |
| 991216 | BATSE | 1.02 | Band | 1.230.25 | 645130 | 505 |
| 000214 | SAX | 0.37–0.47 | CPL | 1.620.13 | 117 | 0.930.03 |
| 010222 | SAX | 1.477 | Band | 1.350.19 | 886 | 15417 |
| 010921 | HETE–2 | 0.451 | CPL | 1.490.05 | 15237 | 1.100.11 |
| 011121 | SAX | 0.362 | Band | 1.420.14 | 29535 | 111 |
| 011211 | SAX | 2.140 | Band | 0.840.09 | 18624 | 6.30.7 |
| 020124 | HETE–2 | 3.2 | CPL | 1.100.08 | 50495 | 310.3 |
| 020813 | HETE–2 | 1.254 | CPL | 1.050.02 | 47722 | 869 |
| 021211 | HETE–2 | 1.01 | Band | 0.900.18 | 11624 | 0.610.12 |
4 Discussion
With respect to our previous work (Amati et al. 2002), the study reported in this
paper is based on a
much larger sample (22 against 12 events) and thus the significance of the
results is substantially increased. For a discussion of possible selection and
data truncation effects, indicating that they should not affect
significantly our results, see Amati et al. (2002), Jimenez, Band & Piran (2001) and
Barraud et al. (2003) for the BeppoSAX, BATSE and HETE–2 events, respectively.
The trend of with
may indicate an higher energy budget for older events. In this case, the high
dispersion may reflect significant variation in shock parameters,
and thus in shock radiating efficiency, and/or in beaming angles, in the case that the
assumption of isotropic emission is not valid for several events in our sample.
If the emission of most GRBs is collimated and the radiated energy is nearly constant,
as supposed e.g. by Frail et al.(2001) , then the observed trend of the
maximum
with may
be due to a combination of the facts that the estimated isotropic equivalent
radiated energy is larger for
events with smaller jet opening angles and that it is more probable to detect
events with
small jet opening angles at high than at low .
The hypothesis that older GRBs are more energetic is still valid if we assume that
the distribution of jet
angles is very narrow.
The reinforced evidence of a correlation between and confirms the indications emerged from the observed hardness–intensity correlation and previous correlation studies on burst energy break, peak flux and fluence performed on events with unknown . For example, Lloyd, Petrosian & Mallozzi (2000) , basing on a BATSE sample, inferred log log, with , which is consistent with our findings. The – relationship can put constraints on GRB prompt emission models, like SSM internal shocks, Inverse Compton (IC) dominated internal shocks, external shocks, innermost models (see Zhang & Meszaros 2002 for a review). In general, and are both quantities dependent on the fireball bulk Lorentz factor , in a way varying for each scenario and for different assumptions (e.g. Schaefer 2003 ). For instance, as pointed out by Zhang & Meszaros (2002): a) the correlation we found implies for SSM internal shocks that the slope of the power–law linking and is , unless invoking relevant IC and/or peculiar assumptions; b) external shocks predict a steeper slope of the – power–law relationship with respect to what we found; c) innermost (i.e. baryon photosphere) emission models predict a slope consistent with our results, but this mechanism is expected to contribute only a fraction of the total GRB prompt emission.
If the emission of the GRBs included in our sample is collimated, then the spread of jet angles, if not too large, may contribute to the scatter around the best fit power-law of the – relationship. By assuming, as above, that most events are jetted and radiate a nearly constant energy, then more collimated events have an higher equivalent isotropic radiated energy and thus the true correlation may be between and the jet opening angle j (and the relation between j and would also play a role).
The constraints coming from the – relationship have to be combined with those coming from the broadness of the distribution. Indeed, our results indicate that the intrinsic distribution is broader than inferred from e.g. BATSE bright bursts (Preece et al. 2000 ), and thus is less critical for the models (the broadness increases with the number of independent parameters of the model, e.g. Zhang & Meszaros 2002).
Finally, the estimates of for further HETE-2 GRBs with known redshift, remarkably including the X–Ray Flash 020903 (if its redshift estimate is true), confirm and extend the – relationship (Lamb, Donaghy & Graziani 2004 ).
References
- [2002] Amati L., Frontera F., Tavani M. et al., 2002, A&A, 390, 81
- [2003] Atteia J.–L., 2003, A&A, 407, L1
- [1993] Band D., Matteson J., Ford L. et al., 1993, ApJ, 413, 281
- [2003] Barraud C., Olive J–F., Lestrade P. et al., 2003, A&A, 400, 1021
- [2003] Bloom J.S., 2003, AJ, 125, 2865
- [1997] Boella G., Butler R.C., Perola G.C. et al., 1997, A&AS, 122, 299
- [2001] Frail D.A., Kulkarni S.R., Sari R. et al., 2001, ApJ, 562, L55
- [2000] Frontera F., Amati L., Costa E. et al., 2000, ApJS, 127, 59
- [2001] Jimenez R., Band D., Piran T., et al., 2001, ApJ, 561, 171
- [2004] Lamb D.Q., Donaghy T.Q., Graziani C., 2004, NewAR, 48, L459
- [2000] Lloyd N.M., Petrosian V., Mallozzi R.S. et al., 2000, ApJ, 534, 227
- [1999] Paciesas W.S., Meegan C.A., Pendleton G.N. et al., 1999, ApJS, 122, 465
- [2000] Preece R.D., Briggs M.S., Mallozzi R.S. et al., 1997, ApJS, 126, 19
- [2003] Schaefer B.E., 2003, ApJ, 583, L71
- [1997] Tavani M., 1997, ApJ, 497, L21
- [2002] Zhang B., Mészáros P., 2002, ApJ, 581, 1236