A possible radio supernova in the outer part of NGC 3310
Abstract
As part of an on-going radio supernova monitoring program, we have discovered a variable, compact steep spectrum radio source 65 arcsec (4 kpc) from the centre of the starburst galaxy NGC 3310. If the source is at the distance of NGC 3310, then its 5 GHz luminosity is W Hz-1. The source luminosity, together with its variability characteristics, compact structure (17 mas) and its association with a group of Hii regions, leads us to propose that it is a previously uncatalogued type II radio supernova. A search of archival data also shows an associated X-ray source with a luminosity similar to known radio supernova.
keywords:
interstellar medium:supernova remnants – radio lines:galaxies – galaxies:individual:NGC 3310 – galaxies:starburst – galaxies:interstellar medium1 Introduction
The starformation rate (SFR) of a galaxy is an important parameter used over a wide range of astrophysics. A number of methods (e.g. Cram et al 1998) can be used to estimate this parameter using UV, optical, FIR and radio observations. However the UV and optical methods are particularly difficult in starbursts because of the large extinction corrections required. The radio and infra-red methods seem to give reasonably consistent results, resulting in the well known correlation between radio and FIR luminosities. However it is important to note that neither the radio nor FIR methods are completely understood theoretically.
In principle, an independent estimate of the SFR can be derived from the supernova rate of a galaxy. If all stars with masses greater than 8 M⊙ become supernovae via core collapse then, if a reasonable initial mass function is assumed, the SFR can be determined as a simple function of supernova rate. This method is particularly applicable to regions such as starbursts with high predicted supernova rates. However in starbursts, the high levels of extinction due to the dust intrinsic to the starburst (e.g. magnitudes in M82 - Mattila & Meikle 2001), can severely compromise optical searches for supernovae even in relatively nearby starburst galaxies. In contrast, the radio emission from supernovae will not be significantly affected by extinction and hence we have begun a program of monitoring a number of nearby starbursts using MERLIN (Multi-Element Radio Linked Interferometer Network) and the VLA (Very Large Array), primarily to detect new radio supernovae, but also to monitor the flux density of existing remnants.
The first monitoring session took place in November 2003 using the VLA in B configuration. In the analysis of the radio emission from NGC 3310, a relatively strong radio source was found in the outer part of the galaxy. A number of possible explanations for this source are considered, but the most likely conclusion is that it is a radio supernova.
Throughout this paper the distance to NGC 3310 is assumed to be 13.3 Mpc (H0 = 75 km s-1 Mpc-1, Kregel & Sancisi 2001) at which an angle of 1 arcsec corresponds to a linear size of 64 pc.
2 Observations
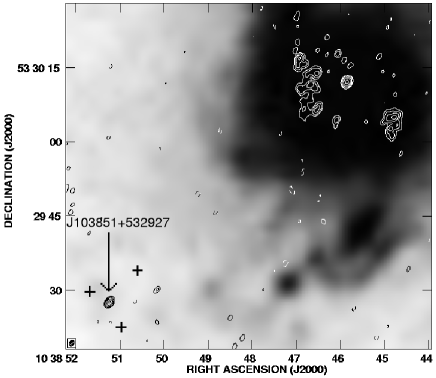
As part of the monitoring program the VLA was used in B configuration to observe NGC 3310, along with 9 other starburst galaxies, at 5, 8.4 and 15 GHz in November 2003. The observations were flux calibrated using observations of 3C286 and phase calibrated using the nearby calibrator 1035+564. Each data-set was imaged using standard techniques and the image obtained at 5 GHz, with an angular resolution of 1.240.91 arcsec, is shown in Fig. 1. In this image, a number of compact sources can be seen within the central 15 arcsec of NGC 3310, in good agreement with previous observations (e.g. Duric et al 1986, Mulder, van Driel & Braine 1995), however a relatively strong source (1.57 mJy at 4.885 GHz) can be seen 65 arcsec to the SE. This source - hereafter referred to as J103851+532927 - is the subject of this paper and its position and flux densities are given in Table 1.
In December 2003 through to January 2004 J103851+532927 was also observed using MERLIN (Thomasson 1986) at 5 GHz. The phase and flux density were calibrated using 1041+536 and 3C286 respectively. Only 4 antennas were available although, as this included the Cambridge antenna (as well as the Mk II, Knockin and Darnhall telescopes) it was possible to image this source at maximum angular resolution (35 mas at 5 GHz). A number of imaging runs on the source were undertaken and several independent images were produced. The flux density, size and position of the source remained consistent for all these images and the final parameters are given in Table 1. All these images showed the source to be unresolved and unpolarised (2 per cent). The position of the source, measured relative to the phase calibrator 1041+536 (RA=10h44m106716 Dec=+53o22′20522), is 10h38m5124599 +53o29′27508 with an error of mas.

A number of archival observations from both MERLIN and the VLA have also been imaged. In all cases standard reduction techniques were used and the flux densities calibrated relative to 3C286. The results of these archival observations are also given in Table 1.
| Freq | Epoch | Flux (3) | Position (J2000) | Telescope (ref) | |
| (GHz) | mJy | RA (10h 38m) | Dec (+53o 29′) | ||
| 1.465 | 1982.04 | 1 | - | - | VLA C (1) |
| 1.465 | 1986.21 | 0.790.23 | 51230 | 2766 | VLA A (2) |
| 1.490 | 1986.62 | 1.62 | 51.235 | 27.83 | VLA B (2) |
| 1.4 | 1987.04 | 1 | - | - | WSRT (3) |
| 1.4 | 1997.37 | 7.830.73 | 51.260 | 27.58 | VLA B (4) |
| 1.4 | 1997.54 | 7 | 51.224 | 27.38 | WSRT (5) |
| 1.658 | 1999.91 | 5.540.34 | 51.245 | 27.50 | MERLIN (6) |
| 4.860 | 1986.62 | 0.250.17 | 51.228 | 27.55 | VLA B (2) |
| 4.994 | 2000.22 | 1.880.45 | 51.247 | 27.61 | MERLIN (7) |
| 4.885 | 2003.87 | 1.570.12 | 51.239 | 27.59 | VLA B (8) |
| 4.994 | 2003.98 | 1.550.01 | 51.246 | 27.51 | MERLIN (8) |
| 4.546 | 2004.14 | 1.800.23 | 51.246 | 27.51 | MERLIN (8) |
| 5.186 | 2004.14 | 1.480.18 | 51.246 | 27.51 | MERLIN (8) |
| 8.440 | 1989.92 | 0.650.28 | 51.291 | 26.93 | VLA B (9) |
| 8.460 | 2003.79 | 0.990.08 | 51.248 | 27.51 | VLA AB (10) |
| 8.435 | 2003.87 | 0.630.11 | 51.244 | 27.49 | VLA B (8) |
| 14.965 | 2003.87 | 0.25 | - | - | VLA B (8) |
3 Results
3.1 Flux density
The source is clearly visible in the 5 and 8.4 GHz 2003 VLA images of NGC 3310 and was initially assumed to be an extragalactic radio source, largely on the grounds that it is well outside the NGC 3310 starburst. This conclusion was also reached by Kregel & Sancisi (2001) who gave its flux density as 5.5 mJy based on WSRT 21 cm continuum observations. However the 1.4 GHz image of NGC 3310 observed in 1982 by Hummel et al (1985), with an rms noise of 0.23 mJy beam-1, showed little evidence for a radio source at this position with an upper limit 1 mJy. In addition, the 1987 21 cm continuum image of Mulder et al (1995) also shows no evidence for a radio source 1 mJy.
The flux density of 5.5 mJy at 1.4 GHz, published by Kregal & Sancisi (2001), includes data from Mulder et al (1995) which comprise 30 per cent of the total. Assuming these early data refer to the pre-supernova state, we estimate the 1997 1.4 GHz flux density of the source to be mJy and this estimate has been included in Table 1.
Fig. 3 shows the flux densities presented in Table 1. This plot illustrates a large increase in 1.4 GHz luminosity (at least 5-fold) between data observed before and after the early 1990s.
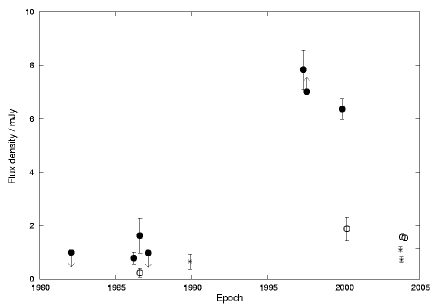
From the FIRST and MERLIN measurements, the 1.4 GHz flux density appears to have decreased between 1997 and 2000 by 10 per cent per year, even though there is a large difference in beam size. A similar decrease (10 per cent per year) may also be present in the 5 GHz flux density measurements between 2000 and 2003, however the data are not well sampled and further measurements, particularly at 1.4 GHz, are required to confirm the amplitude of this decrease.
Much of the early data give only upper limits, particularly as the weak source becomes confused with the extended galaxy emission in the lower angular resolution measurements. However, it can be seen from the early higher resolution data that a weak source was present within an arc second of the current position of J103851+532927 with a flux density at the 0.5 mJy level.
3.2 Spectral Index
As can be seen from Table 1, the flux densities have been measured at several frequencies, with different beams and mostly at different epochs, hence spectral indices can only be estimated. Nevertheless, it is clear from Table 1 that the source has a relatively steep spectrum. MERLIN measurements at 1.6 and 5 GHz, measured in late 1999 and early 2000 respectively, indicate a spectral index, (where ), of while the spectral index measured between 5 GHz and 8.4 GHz with the VLA in 2003 appears to be even steeper (). In order to check this result further, MERLIN measurements (see Table 1) were made in January 2004 at 4546, 4994 and 5186 MHz, and from these observations . These measurements are clearly all consistent with a steep spectral index, although a more accurate determination will require further simultaneous measurements at more widely spaced frequencies.
3.3 Angular size
The archival MERLIN observations at 1.6 and 5 GHz show the source to be unresolved by the 150 mas and 50 mas beams. The 4.994 GHz data-sets taken in December 2003 and January 2004 have been combined into a single high signal to noise image and uniform weighting of the data has been used to give an equivalent beam of 35 mas. There is no evidence for any extended structure and Gaussian fitting to the resulting cleaned image (Fig. 2) gives an upper limit of 17 mas (1.1 pc) on the size of the source.
4 Discussion
4.1 A radio supernova?
The source is clearly not in the central starburst region of NGC 3310, however it does appear to be associated with a cluster of Hii regions (Hodge & Kennicutt 1983) in the outer part of NGC 3310 (Fig. 1). Hence there are young massive stars present which will result in supernovae at some stage. The rise, and possible decay, of the radio light curve (Fig. 3) is strong evidence in favour of this hypothesis. Although these data are sparsely sampled, there is no doubt that at least a fivefold increase in flux density took place sometime in the early half of the 1990s.
If the source is at the distance of NGC 3310, then its 5 GHz luminosity is W Hz-1 which is comparable to the peak radio luminosity of many of the type II radio supernovae listed, for example, by Weiler et al 2002 (hereafter W02).
Since its rise in the 1990s, the radio flux density has remained high until 2003, although there is some evidence that the flux density may be decreasing at per cent per year since 1997. Hence significant radio emission has persisted for at least 5000 days. It is well established (e.g. W02) that a number of type II radio supernovae have radio emission lasting for several thousand days. The best example of this is SN1979C (Montes et al 2000) in which the radio luminosity at 1.4 and 5 GHz has decreased by less than a factor of 3 over two decades. This timescale is much longer than the comparable timescale (100 days) for type Ib/c supernovae (e.g. W02) and hence would appear to rule out identifying J103851+532927 with this type of radio supernova.
From the observations we can only be sure that the strong radio emission from J103851+532927 appeared within a 7.5 year period between December 1989 and May 1997, however by considering the subsequent decrease in flux density we can put crude constraints on the age of the radio supernova. W02 note that the decay parameter (which relates flux density, , and time, by ) in models of known supernovae ranges from to for type II, and from to for type Ib/c radio supernovae. If J103851+532927 is assumed to be a supernova which exploded in 1990, then the 5 GHz flux densities measured in 2000 (MERLIN) and 2003 (VLA) give a value for of . A similar value () is obtained from 1.4 GHz measurements between 1997 (VLA) and 1999 (MERLIN). These values of are low, although just consistent within the measurement errors with type II supernovae. However if we assume that the supernova exploded in 1995, becomes at both frequencies, suggesting that the supernova event took place early in the 7.5 year period.
The spectral index of J103851+532927 is not well determined, but initial estimates suggest it to be significantly steeper than the spectral indices of typical type II radio supernovae listed by W02. Further observations, using several frequencies, similar angular resolutions and similar epochs, are planned in order to determine the spectral index of J103851+532927 with higher precision.
The upper limits to the angular size of the source imply a linear size of less than 1.1 pc if it is at the distance of NGC 3310. Hence if the source is a radio supernova which exploded around 1990, this would imply an upper limit to the radial expansion velocity of km s-1. Assuming a typical expansion rate of 104 km s-1 (e.g. Pedlar et al 1999) then at the distance of NGC 3310 a 15 year old supernova remnant would have an angular size of 2 mas. Global VLBI observations have now been proposed in order to investigate the structure on mas scales.
The weak pre-1997 emission is within an arc second of the position of J103851+532927 . The spectral index, determined from the 1986 data, is . This emission would not be expected to be directly associated with the radio supernova itself. Instead, it may be associated with either Hii regions or older supernova remnants.
4.1.1 Evidence from other wavebands
A search by Roberts & Warwick (2000) of archive data observed between 1990 and 1997, reported a detection of an X-ray source (NGC 3310 X-2) with a luminosity of L erg s-1 to the SE of NGC 3310, and J103851+532927 lies within its 95 per cent uncertainty ellipse (a radius of 15 arcsec). Its X-ray luminosity is consistent with the emission from other radio supernovae which show typical X-ray luminosities ranging from to ergs s-1 (e.g. Gallimore & Beswick 2004 and references therein).
A search of the NASA extragalactic database (NED) for ground based optical observations of NGC 3310, particularly during the early 1990s, reveals no obvious optical counterpart at the position of the radio supernova. A number of archival observations of NGC 3310 have also been examined but unfortunately do not include the position of the source. We are continuing to search for relevant optical data but as the date of the supernova explosion is not known more accurately than to within a few years, it is uncertain whether any evidence will be found.
It may be that the supernova was embedded in a dense molecular cloud and hence any optical emission may have been heavily reddened. It is interesting to note that no optical counterpart was initially noticed corresponding to the detection of a radio supernova in NGC 4258 by van der Hulst et al (1983). A retrospective search of optical images showed a weak 13th magnitude optical source, heavily reddened by dust.
4.2 Other possibilities
There remains a small possibility that J103851+532927 may be either a compact steep spectrum (CSS) or a GHz peaked spectrum (GPS) source, however these sources are not usually as variable as J103851+532927 (O’Dea 1998). In a study conducted by Seielstad, Pearson & Readhead (1983), 90 per cent of the steep spectrum sources in their sample do not vary significantly over the 4 years of their observations. Also, these classes of object are often doubles or triples when imaged at the 50 mas resolution of MERLIN. The Global VLBI observations which have been proposed in order to resolve the radio supernova will also be a decisive method of ruling out, or otherwise, the compact structure expected in CSS or GPS sources.
A further possibility is that the source is a foreground pulsar, the source variations being due to scintillation. Typically, pulsars have (e.g. Lorimer et al 1995). J103851+532927 , however, is not in existing pulsar catalogues (M. Kramer - Private Communication) despite its relatively high integrated flux density. Also the recent 5 GHz MERLIN observations show that, unlike most pulsars, the source is unpolarised. Furthermore the 5 GHz data observations carried out between December 2003 and January 2004 show little evidence for the short timescale scintillation variability expected in a pulsar at the Galactic latitude () of J103851+532927 .
5 Conclusions
The radio properties of the compact, steep spectrum source 4 kpc from the centre of NGC 3310, appear to be similar to those of known radio supernovae. Both the light curve and the radio luminosity suggest that the source is a type II radio supernova, rather than a type Ib/c (W02). However, the radio spectral index appears to be steeper than typical radio supernovae, although further observations are required to confirm this. This source will continue to be included in our ongoing monitoring program and Global VLBI observations have been applied for, which, assuming reasonable expansion velocities, should resolve the radio structure of the radio supernova. Retrospective optical observations are also required to help confirm or refute these conclusions.
Acknowledgements
We thank Michael Kramer for useful discussions and the referee Schuyler Van Dyk for providing additional data. The National Radio Astronomy Observatory is a facility of the National Science Foundation operated under cooperative agreement by Associated Universities, Inc. MERLIN is run by the University of Manchester as a National Facility on behalf of PPARC. This research has made use of the NASA/IPAC Extragalactic Database (NED) which is operated by the Jet Propulsion Laboratory, California Institute of Technology, under contract with the National Aeronautics and Space Administration. The Digitised Sky Survey was produced at the Space Telescope Science Institute under U.S. Government grant NAG W-2166. MKA & MS acknowledge support from PPARC studentships. RJB acknowledges PPARC support.
References
- (1) Cram L., Hopkins A., Mobasher B., Rowan-Robinson M., 1998, ApJ 507, 155
- (2) Duric, N., Seaquist, E.R., Crane, P.C., Davis, L.E., 1986, ApJ, 304, 82
- (3) Gallimore J.F., Beswick R., 2004, AJ, 127, 239
- (4) Hodge, P.W., Kennicutt, R.C., Jr., 1983, AJ, 88, 296
- (5) Hummel, E., Pedlar, A., Davies, R.D., van der Hulst, J.M., 1985, A&AS, 60, 293
- (6) Kregel M., Sancisi R., 2001, A&A, 376, 59
- (7) Lorimer D.R., Yates J.A., Lyne A.G., Gould D.M., 1995, MNRAS, 273, 411
- (8) Mattila, S., Meikle W.P.S., 2001, MNRAS, 324, 325
- (9) Montes M.J., Weiler K.W., van Dyk S.D., Panagia N., Lacey C., Sramek R.A., Park R., 2000, ApJ, 532, 1124
- (10) Mulder P.S., van Driel W., Braine J., 1995, A&A, 300, 687
- (11) O’Dea C.P., 1998, PASP, 110, 493
- (12) Pedlar A., Muxlow T.W.B., Garrett M.A., Diamond P., Wills K.A., Wilkinson P.N., Alef, W., 1999, MNRAS, 307, 761
- (13) Roberts T.P., Warwick R.S., 2000, MNRAS, 315, 98
- (14) Seielstad G.A., Pearson T.J., Readhead A.C.S., 1983, PASP, 95, 842
- (15) Thomasson, P., 1986, QJRAS, 27, 413
- (16) van der Hulst J.M., Hummel E., Davies R.D., Pedlar A., van Albada G.D., 1983, Nature, 306, 566
- (17) Vila M.B., Pedlar A., Davies R.D., Hummel E., Axon D.J., 1990, MNRAS, 242, 379
- (18) Weiler K.W., Panagia N., Montes M.J., Sramek R.A, 2002, ARA&A, 40, 387