X-ray reflection in the NLS1 1H 0707-495
Abstract
We apply a reflection–dominated model to the second XMM-Newton observation of the Narrow Line Seyfert 1 galaxy 1H 0707–495. As in the first XMM-Newton observation a sharp spectral drop is detected with energy that has shifted from 7 keV to 7.5 keV in two years. The drop is interpreted in terms of relativistically blurred ionised reflection from the accretion disc, while the energy shift can be accounted for by changes in the ionisation state and, more importantly, emissivity profile on the disc. A flatter emissivity profile during the second higher flux observation reduces gravitational redshift effects, therefore shifting the edge to higher energy. Remarkably, ionised disc reflection and the associated power law continuum provide a reasonable description of the broadband spectrum, including the soft excess. Considering both observations, the spectral variability in 1H 0707–495 appears to be due to the interplay between these two spectral components. The reflection component in the second observation is significantly less variable than the power law. Changes of the emissivity profile, spectral shape and variability properties (such as the rms spectrum) within the two observations are all consistent with a recently proposed model in which relativistic effects in the very inner regions of the nucleus play a major role.
keywords:
line: formation – galaxies: active – X-rays: galaxies – X-rays: general – galaxies: individual: 1H 0707–4951 Introduction
The first (hereafter GT for Guaranteed Time) XMM-Newton X-ray spectrum of the Narrow Line Seyfert 1 galaxy, 1H 0707-495 (), showed a dramatic spectral drop at 7 keV (Boller et al 2002). This was interpreted by the authors as due to photoelectric absorption by neutral iron close to the source. The lack of any iron L-shell absorption in the object, which has a strong soft X-ray excess, implies that the absorber only partially cover the source. This requires an unusual geometry for the source and absorber since the source is rapidly variable. However, a different interpretation of the spectral shape is also possible. As pointed out by Boller et al (2002), the blue horn of a strong and relativistically blurred iron Kα line, combined with the edge of the associated reflection component, can reproduce the 7 keV drop. A second observation (hereafter AO2) of 1H 0707-495, reported by Gallo et al (2004), shows a similar drop but at a higher energy of about 7.5 keV in the source rest frame. The simplest explanation put forward is that the absorber is outflowing at , which implies either a prodigious mass and energy loss rate in the outflow or a very clumpy, local, absorber.
The alternative model in which the X-ray spectrum is reflection dominated was discussed in more detail by Fabian et al (2002b) for the GT observation. A corrugated disc was invoked to account for the X-ray reflection dominating the observed emission. A reflection spectrum here means the back-scattered, fluorescent, recombination and other emission produced when an X-ray continuum irradiates a slab of matter (see e.g. Ross & Fabian 1993; Zycki et al 1994; Nayakshin, Kazanas & Kallman 2000; Ross, Fabian & Ballantyne 2002; Rozanska et al 2002). The continuum source was inferred to be mostly hidden from direct view in a corrugation, but its reflection observable from the walls. If the reflecting material is the inner parts of an accretion disc then the reflection spectrum is blurred by Doppler and gravitational redshift effects. The sharp 7 keV drop in 1H 0707-495 is then the blue edge of the relativistically-blurred iron emission line. The shift in energy of the edge during the second XMM-Newton observation can then be due to a change in ionisation or geometry of the irradiated material.
Relativistically-blurred, reflection-dominated spectra have been seen e.g. in MCG–6-30-15. There the spectral variability in normal flux states can be attributed to a two-component model consisting of a power-law continuum, with a fixed spectral index but changing flux, and an almost constant reflection component. The model requires that the continuum source is anisotropic, as viewed by us. This can be explained by the strong gravitational light bending (see e.g. Martocchia & Matt 1996) expected close to the black hole (spectral fits to the broad iron line in MCG–6-30-15 imply that the inner radius of the accretion disc where much of the reflection originates is about 2 gravitational radii or less, Wilms et al 2001; Fabian et al 2002a).
The variability of the two components in MCG–6-30-15 can be explained by a recently proposed light bending model (Miniutti et al 2003; Miniutti & Fabian 2004). Computations of the change in the observed power-law and reflection components as the continuum source moves in height above the black hole are consistent with the otherwise puzzling behaviour of the broad iron line in this object. Gravitational light bending naturally produces reflection–dominated and relativistically blurred spectra during low flux states and thus provides a possible alternative scenario for the GT XMM-Newton observation of 1H 0707–495. A major prediction of the model is that reflection is correlated with the power law continuum only at very low flux levels, while at higher fluxes it is almost constant despite large continuum variability. The light bending model also explains the behaviour of the reflection and iron line in the Galactic Black Hole Candidate XTE J1650-500 (Miniutti, Fabian & Miller 2004; Rossi et al. 2004).
Here, we apply the reflection model to the AO2 observation of 1H 0707–495 to investigate whether reflection-dominated emission can account for the whole XMM-Newton spectrum and its variations. Our purpose here is not to carry out a detailed study but to check whether such a model gives a reasonable fit to the data for plausible parameters.
2 An emission line in the spectrum of 1H 0707–495?

We first look at the AO2 observation of 1H 0707–495 from the point of view of an iron emission line. The XMM-Newton spectrum used here is the EPIC pn spectrum of Gallo et al (2004), where details of the data reduction can be found. A power-law was fit to the data in the bands 1.5–2 keV and 7.5–12 keV. The ratio of the whole 0.3–12 keV dataset to that power-law is shown in Fig. 1. A large skewed emission feature, similar to that found in MCG–6-30-15 (Tanaka et al 1995; Wilms et al 2001; Fabian et al 2002a) is evident between about 4 and 7 keV, and a steep soft excess below 1 keV.
The data between 1.5 and 12 keV were then modelled with a power-law and a relativistic emission line (Laor 1991). A good fit is obtained (with for 334 dof, see Fig. 2) for . Notice that no extreme inclination is required to reproduce the spectral drop (). The strength of the line (equivalent width of 1.8 keV) and its rest frame energy (6.7 keV) imply that we are dealing with an ionised reflector. The reflection continuum is then complex and needs to be modelled properly.


3 Reflection dominated spectra
We have therefore fitted Ross & Fabian (1993) ionised reflection models (from a set computed by D.R. Ballantyne) to the whole 0.3–12 keV observable band. The line strength and past work on 1H 0707–495 (Fabian et al 2002b) suggest using super–solar abundance models. Reasonable agreement is obtained (Fig. 3) with a model which is relativistically blurred, has 3 times solar abundance, and photon index (which is the maximum in the available grid) giving . The ionisation parameter of the reflection model is . This is not as good a fit as Gallo et al (2004) obtained with a partial-covering model (), but that had 5 separate components (apart from cold absorption), many of which operate on separate parts of the spectrum, whereas the reflection model has only two components (power-law and reflection), both of which are broadband. In Fig. 4, we show the (blurred) reflection plus power law model used to describe the data. No other components were added to obtain the result shown in Fig. 3.
Much of the difference () in the quality of the fits between this model and the partial covering one is due to the soft X-ray band. We have a simple photoelectric absorption component (WABS) which requires a larger column density ( atoms cm-2) than the Galactic value ( atoms cm-2, see e.g. Gallo et al 2004). If the excess absorption is instead allowed to be mild edges such as in a warm absorber, then most of the difference is eliminated (). The same good quality can be obtained by considering instead a multiple reflection model such as that presented by Fabian et al. (2002b) for the GT observation. It is not our purpose here to discuss in detail the possible parameterisations of the spectrum. We merely stress here that a reasonable fit can be obtained even with the simplest possible reflection model and that the reduced values in the 2–10 keV band for the partial-covering and reflection models are almost identical.

The intrinsic unblurred reflection spectrum is shown in Fig. 5. A large iron-K emission line and edge dominate the spectrum around 7 keV and a steep soft excess occurs below 1 keV (see also Fig. 4 which includes blurring and photoelectric absorption). The bump in the blurred spectrum just below 1 keV, modelled as a large Gaussian emission line by Gallo et al (2004), is due to a complex of iron-L lines. The level of the reflection component relative to the power law is about 9 times that expected for irradiation of a flat disc. This implies that much more primary radiation is illuminating the disc than reaching the observer at infinity.
The relativistic blurring is accomplished using a Kerr kernel (Laor 1991) with a radial emissivity index of (where the emissivity is has the radial dependence ) from to gravitational radii, and disc inclination of about . The disc inclination is different from that obtained in the previously published analysis of the GT observation (, see Fabian et al 2002b). We shall return on this issue later in Section 4.

We have investigated whether models with higher abundances improve on the fit of the second (AO2) observation. At 7 times solar abundances the drop is sharper (see Fig. 6; the spectrum was fitted above 2 keV and is shown above 5 keV), but overproduces emission below about 0.7 keV. This is probably because the oxygen abundance is now too high. The data appear to require a high iron abundance but smaller oxygen abundance. A more extensive grid of variable abundance reflection models is required to pursue this issue further (and would likely reduce the low energy residuals in our present analysis). A range of ionisation parameters may also be needed to match the range of disc radii, so leading to a highly multi-parameter solution which is beyond the scope of this paper.

4 Comparison between the GT and AO2 observations
As already mentioned, 1H 0707–495 has been observed twice by XMM-Newton. During the first GT observation the count rate was significantly lower than during the AO2 observation (see Fig. 5 in Gallo et al 2004). In both observation a spectral flattening above 3 keV is evident and according to our interpretation it is related to the presence of a reflection component including a broad iron emission line. The most remarkable difference between the two observations is that the drop energy, when modelled by a simple edge, shifted from keV in the GT observation to keV in the AO2 observation. Moreover, the edge depth is considerably smaller during the higher flux AO2 observation (about a factor 2), while the width is narrow at both epochs.
The reflection–dominated model for the GT observation was presented by Fabian et al. (2002b). The broadband spectrum was described by a multiple reflector model (all components being blurred), and no power law continuum was required, producing a spectrum completely dominated by reflection. The presence of different reflection components with different ionisation parameters most likely reproduces the radial distribution of ionisation on the disc, and does not allow to easily derive the average ionisation state; however, a value around seems to be a reasonable estimate for the GT observation, while we measure in the AO2 data.

The best–fit model for the GT observation was obtained by fixing the emissivity index of the relativistic blurring model to and the disc inclination was derived to be about . The inclination we are measuring here is around and seems to contradict the GT analysis. However, we re–fitted the best–fit model of Fabian et al. (2002b) for the GT observation letting the emissivity index free to vary during the fit. We find that a common solution does exists for the two observations with inclination . The new fit for the GT observation is of the same statistical quality of that presented in Fabian et al. (2002b) with . The main difference between the two observation is that the emissivity index is much steeper during the GT () than the AO2 observation (). A flatter emissivity profile reduces the effect of gravitational redshift on the sharp reflection features (emission line and edge) so that the edge is observed at slightly higher energy during the AO2. It is therefore a combination of higher ionisation parameter and flatter emissivity profiles that is responsible for the edge energy shift from the GT to the AO2 observations. As mentioned, the other major difference between the two observations is that the spectrum is completely dominated by reflection during the GT observation, while a power law continuum becomes visible during the AO2 (compare Fig. 4 of the present paper with Fig. 5 in Fabian et al 2002b) during the AO2.
4.1 Source variability
1H 0707–495 varied dramatically during the second XMM-Newton observation. Spectra were obtained when the source exceeded 4.5 cps and was less than 3.5cps (see Fig. 1 in Gallo et al 2004 for the broadband light curve). The difference between them is shown in Fig. 7 when fitted with a power law and cold absorption. It is close to a power-law of index , but shows a bump at iron-K energies. The source is therefore not identical in behaviour to MCG–6-30-15 where a difference spectrum mostly shows the power-law component. In 1H 0707–495 the reflection component must vary too. In particular, since a bump is seen in the 4–7 keV band, the broad iron line must be stronger at high than low flux. We have fitted the high and low-flux spectra separately allowing only the normalisations of the power law and reflection components to vary. Good fits with a reduced were found for both. The reflection normalisation changes by a factor of 1.7 while the power-law one by a factor of 2.8 (a factor 1.6 between the two). The variability is therefore dominated by changes in the flux of the power-law continuum, but the reflection component varies as well.
As shown by Gallo et al (2004), the fractional variability amplitude (Fvar) in the AO2 observation is larger (again, by about a factor 1.6) in the intermediate than in the soft ( 0.3–1 keV ) and hard ( 5–12 keV ) band. Moreover, Fvar is roughly the same in the soft and hard band, where according to our spectral analysis (see Fig. 4) ionised reflection dominates. Therefore, in the reflection–dominated model we present here, the Fvar behaviour as a function of energy is easily understood. The 1–5 keV band is dominated by the power law continuum which contributes the most to the source the variability. The soft and hard bands do exhibit the same Fvar because they are both dominated by ionised reflection from the accretion disc, which is less variable than the power law continuum. During the first GT XMM-Newton observation of 1H 0707–495, Fvar was found to be constant (see Fig. 4 of Boller et al 2002), as opposed to the AO2 results in Gallo et al (2004). As mentioned, spectral analysis with the reflection–dominated model strongly suggests a completely reflection–dominated spectrum during the GT observation. Notice that even if not formally required, spectral analysis cannot exclude the presence of a faint power law component in the GT spectrum. The constant Fvar is then the result of a dominant broadband spectral component in the overall 0.3-12 keV spectrum, i.e. ionised reflection from the disc, or indicates that if a power law is present, it varies with the same amplitude as the reflection component.
4.2 Energy–selected light curves
If the reflection-dominated spectrum is produced by strong light bending effects, we expect the reflection–dominated component (RDC) to respond to the power law component (PLC) variability only at low flux levels and to vary much less than the power law at higher fluxes (see e.g. Miniutti & Fabian 2004). This predicted behaviour should be visible in energy-selected light curves if, as the previous discussion indicates, reflection dominates below keV and above keV and the power law continuum provides the largest contribution in the intervening band (see Fig. 4). Guided by our spectral analysis the 0.3–1 keV and 1–5 keV bands were selected as representative of the two main spectral components of 1H 0707–495.
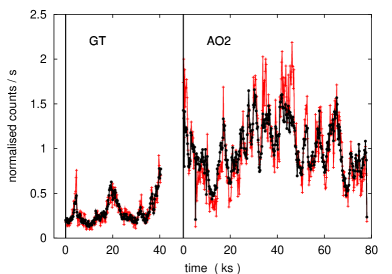
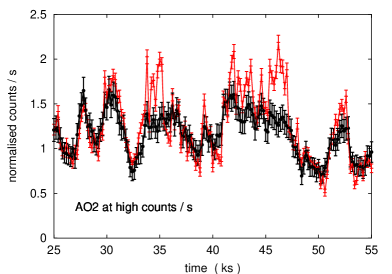
In the top panel of Fig. 8 we show the -s binned light curve in the keV (black) and keV (red) bands for the GT and AO2 observations. The light curves were normalised to their mean count rate and the GT light curves were then rescaled by the ratio of keV count rates in the two observations to account for the lower count rate in GT observation (a factor ). It is clear from the figure that there is a good correlation between the two bands in both observations. However one major difference is seen at the highest count rates during AO2: the 0.3–1 keV light curve does not reach the high count rate level of the 1-5 keV. The bottom panel of Fig. 8 shows a close-up of the AO2 light curves in the highly variable period between ks. Clearly the two light curves are more divergent at higher fluxes. However, this can be explained as due to the ‘rms-flux’ correlation known to be present in Seyfert galaxy X-ray variations (Uttley & McHardy 2001; Vaughan, Fabian & Nandra 2003). If the two light curves follow this relation then differences in Fig. 8 can be explained largely by a more variable keV than keV light curve. The more variable ( keV) light curve is thereby more ‘non-linear’ and the two will naturally diverge at higher fluxes (see Uttley, McHardy & Vaughan 2004, in prep).
As a further investigation of the nature of the spectral variability in 1H 0707–495, flux-flux plots were examined (see Taylor Uttley & McHardy 2003; Vaughan & Fabian 2004). Light curves were extracted in six bands and binned to -s resolution (ensuring a minimum of ct/bin). The flux in each band was plotted against the flux in the keV band. (This band was chosen as the comparison band as it is dominated by the variable power law and, as confirmed by the subsequent analysis, contains the smallest fraction of constant component of any of the six energy bands.) The data were then binned as a function of keV flux (such that there are fluxes per bin). Fig. 9 (top panel) shows one of the resulting flux-flux plots. Following the above discussion, examining the correlation between variations in different bands should reveal the RDC versus PLC relationship.
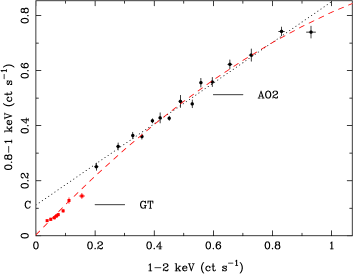
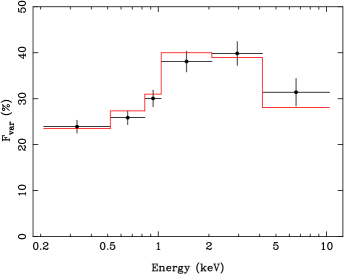
Considering the AO2 data alone, a linear model gives a reasonable match to the data (although not acceptable in a formal sense, with ). The value of the constant (marked ‘C’ in the figure) gives an indication of the contribution to the spectrum of any truly constant emission, which must be stronger in the keV band than the keV band. The approximate linearity implies that the variable component of the spectrum has a flux-independent spectral shape. Following the analysis of Taylor et al. (2003) and Vaughan & Fabian (2004) the value of the constant C was recorded as a function of energy band. This gives an estimate of the spectrum of the constant component that can be used to model the energy-dependent variability amplitude as described in section 5.3 of Vaughan & Fabian (2004). Assuming only two spectral components, one variable (with constant spectral shape) and one constant in flux (as derived using the above method) a model for the rms spectrum was produced. Fig. 9 (bottom panel) shows the comparison between the model and the measured rms spectrum. The agreement is rather good, indicating that such a simple description of the amplitude-dependent variability is a reasonable first-approximation. The spectrum of the constant component is in a sense the ‘opposite’ of the rms spectrum, with strong emission below keV and above keV, which suppresses the variations. Qualitatively, the constant component resembles the ionised reflection spectrum (Fig. 4). However, the RDC cannot be completely constant. This is because the RDC is a factor brighter than the PLC below keV, and if this were completely constant it would suppress the variability in this band to a much greater degree than actually observed. Therefore, as also indicated by spectral analysis (see Section 4.1), the RDC must vary too but with smaller amplitude than the PLC.
The situation is undoubtedly more complex than that described above. Firstly, for the rms-flux relation to account for the divergence in the light curves at high fluxes there must be differences in the amplitude of the intrinsically variable spectrum (i.e. after accounting for any constant) as a function of energy. Secondly, considering the GT observation, which was obtained during a period of much lower flux, reveals that the approximate linearity of the flux-flux relation cannot extend to very low fluxes (Fig. 9).
This can be explained (qualitatively at least) in terms of the light bending model as follows. At intermediate fluxes (e.g. the AO2 observation) the RDC is largely unresponsive to changes in the observed PLC flux (regime II of Miniutti & Fabian 2004) whereas at low fluxes the two become correlated (regime I). Furthermore, the prediction of this model is that the RDC and PLC become tightly coupled at low fluxes, which would result in a much flatter rms spectrum, exactly as observed during the GT observation (Fig. 4 of Boller et al. 2002). For 1H 0707–495, the flux-flux relations including the AO2 and GT data are better fitted with quadratic model to account for the low-flux curvature. Notice that a similar quadratic relationship is found for the (broad) iron line flux versus the continuum flux in the Galactic black hole candidate XTE J1650-500 (Rossi et al 2004; see also Miniutti, Fabian & Miller 2004). Indeed, the light bending model predicts that plotting the disc RDC (including the broad iron line) against the primary PLC results in a relationship which is much better fitted by a quadratic than a linear curve (see Fig. 2 in Miniutti & Fabian 2004).
Both the GT and AO2 observations of 1H 0707–495 match well the predictions of the light bending model. In this model, low flux states (GT observation) are associated with strong light bending which naturally produces reflection–dominated spectra and very steep emissivity profiles on the disc. During higher flux states (AO2 observation) light bending effects are slightly reduced, the emissivity is (relatively) flatter, and the power law continuum becomes detectable.
If our interpretation is correct, we expect that observations in higher flux states than AO2 will result in a larger contribution of the power law continuum above about keV leading to a further reduction of the depth of the spectral drop at keV (consider Fig. 4 and shift the PLC at a higher level keeping the RDC almost constant). During such a ‘high flux state’ the variability should be dominated by the PLC producing much larger variability in hard than soft bands. 1H 0707–495 was in fact observed by Chandra a few months later than the GT XMM–Newton observation, and the source flux was found to be times larger than during the GT (and therefore larger than during AO2 as well), as reported by Leighly et al. (2002). Leighly et al. pointed out the lack of any spectacular spectral drop around keV in the Chandra high flux observation in contrast with both XMM–Newton spectra. Moreover, the authors found that the hard X–rays above about 1 keV are much more variable than the soft ones. Both observational results agree very well with the predictions of the light bending model.
5 Discussion
Remarkably, a relativistically blurred reflection-dominated model gives a reasonable fit to the new XMM-Newton spectrum of 1H 0707–495 over the entire observed energy band. The parameters are similar to those of MCG–6-30-15 and NGC4051 in their lowest state, but with a steeper photon index.
The result on 1H 0707–495 is consistent with fits to the earlier GT data (Boller et al 2002; Fabian et al 2002b), except that the photon index of the illuminating power-law was then slightly flatter at , rather than found here. The edge energy shifted from 7 keV to 7.5 keV in two years. The shift is not principally due to a change in ionisation state. Although the best fits shows an increase in from 2 to 2.8, the energy of the iron line remains consistent with the helium-like emission line. We have refitted the first dataset (GT observation) searching for solutions with ionised reflection from the accretion disc with same inner/outer disc radius and inclination as observed in this second observation. Common solutions do exist and require that the emissivity index is larger in the GT than in the AO2 observation. This has the effect of emphasising the inner radii of the disc and so increasing the effect of gravitational redshift, explaining why the sharp drop occurs at a lower energy in that dataset.
A power law component (not visible during the GT observation) dominates the 1–5 keV band in the (higher flux) AO2 observation. The spectral model also accounts for the lack of any evident narrow iron Kα emission line (the line being relativistically blurred). and requires no absorption feature in the 1-1.5 keV band. Several NLS1 objects with the strongest soft excess exhibit an apparent absorption feature near 1 keV (e.g. Leighly 1997). The model we propose here for 1H 0707–495 does require no absorption feature in the 1-1.5 keV band, but has instead line emission just below 1 keV. It is therefore possible that the spectra of other NLS1s around 1 keV can be explained by ionised reflection as well.
Strong gravitational light bending can explain the behaviour of 1H 0707–495 and possibly other NLS1, as discussed by Miniutti & Fabian (2004). This seems to be the simplest explanation of the change in the spectrum. The model predicts that the lowest flux state occurs when the continuum source is closest to the centre of the disc, the power law contribution is depressed and reflection–dominated spectra which are relativistically blurred with steep emissivity profiles are produced. Multiple reflection associated with returning radiation or modelling a radial profile of the ionisation parameter may provide the most interesting spectral parametrisation (Ross, Fabian & Ballantyne 2002). The observed rapid variability can be associated with changes in height of the continuum source above the black hole. This produces a correlation between the RDC from the disc and the PLC at low flux (GT observation), while at higher flux (AO2 observation), the model predicts a variable PLC and an almost constant RDC.
The fractional variability amplitude behaviour in both the first and the second XMM-Newton observations and the analysis of energy selected light curves supports this interpretation. According to our spectral parametrisation, the soft band is dominated by ionised disc reflection and the hard one by the power law continuum. The flux–flux plots analysis demonstrates that during the AO2 observation the spectral variability can be understood in terms of a variable PLC, and a more constant RDC, in excellent agreement with the light bending model. The observed rms spectrum is very well reproduced by this simple model and the derived spectrum of the constant component closely resembles that of ionised disc reflection with strong emission below keV and above keV.
As pointed out by Miniutti & Fabian (2004) the inner disc emission is preferentially beamed along the equatorial plane thus illuminating the outer regions of the disc. This low velocity, high density material would then produce intermediate and low ionisation emission lines which are observed as narrow, as opposed to the blueshifted, broad high ionisation lines likely produced in a lower density and high velocity wind (Leighly & Moore 2004, Leighly 2004a). The high ionisation lines then appear predominantly blueshifted since the disc itself prevents us from seeing the outflow on the other side. Since the disc emission (here ionised reflection) has a very steep spectral shape and peaks below keV, only a minor fraction is available for iron fluorescence above 7 keV. The associated narrow iron line is therefore weak and, if present, would be difficult to detect above the level of the much stronger inner disc emission dominated by the broad line in the 5–7.5 keV band.
The present work suggests that a much deeper study of both datasets with expanded grids of reflection models will be fruitful. The results so far indicate that the emission from 1H 0707–495, and likely other NLS1, originates from within a few (10 or so) gravitational radii from the black hole. NLS1 may be among the best sources with which to probe the extreme gravity at a few gravitational radii around the black hole.
Acknowledgements
Based on observations obtained with XMM–Newton, an ESA science mission with instruments and contributions directly funded by ESA Member States and the USA (NASA). ACF thanks the Royal Society for support. GM thanks the PPARC for support.
References
- Ballantyne, Ross & Fabian (2001) Ballantyne D.R., Ross R.R., Fabian A.C., 2001, MNRAS, 327, 10
- Boller et al. (2001) Boller Th. et al. 2001, MNRAS, 329, 1
- Fabian et al. (2002) Fabian A.C. et al, 2002a, MNRAS, 335, L1
- Fabian et al. (2002) Fabian A.C., Ballantyne D.R., Merloni A., Vaughan S., Iwasawa K., Boller T., 2002b, MNRAS, 331, 35
- Fabian et al. (2003) Fabian A.C., Vaughan S., 2003, MNRAS, 340, L28
- Gallo et al. (2004) Gallo L.C., Tanaka Y., Boller T., Fabian A.C., Vaughan S., Brandt W.N., 2004, MNRAS submitted
- Leighly et al. (1997) Leighly K.M., Mushotzky R.F., Nandra K, Forster K, 1997, ApJ, 489, L25
- Leighly et al. (2002) Leighly K.M., Zdziarski A.A., Kawaguchi T., Matsumoto C., 2002, in Boller Th., Komossa S., Kahn S., Kunieda H., Gallo L., eds, X–ray Spectroscopy of AGN with Chandra and XMM–Newton, MPE Rep. 279, p. 259
- Leighly (2004a) Leighly K.M., 2004a, ApJ submitted, preprint (astro-ph/0402452)
- Leighly (2004b) Leighly K.M., 2004b, to appear in the Proc. of the conference “Stellar–mass, Intermediate–mass, and Supermassive Black Holes”, Kyoto, Oct. 28–31 2003, preprint (astro-ph/0402676)
- Leighly & Moore (2004) Leighly K.M., Moore J.R., 2004, ApJ submitted, preprint (astro-ph/0402453)
- Martocchia & Matt (1996) Martocchia A., Matt G., 1996, MNRAS, 282, L53
- Miniutti et al. (2003) Miniutti G., Fabian A.C., Goyder R., Lasenby A.N., 2003, MNRAS, 344, L22
- Miniutti & Fabian (2004a) Miniutti G., Fabian A.C., 2004, MNRAS, 349, 1435
- Miniutti, Fabian & Miller (2004b) Miniutti G., Fabian A.C., Miller J.M., 2004, MNRAS in press, preprint (astro-ph/0311037)
- Laor (1991) Laor A., 1991, ApJ, 376, 90
- Nayakshin, Kazanas & Kallman (2000) Nayakshin S., Kazanas D., Kallman T.R., 2000, ApJ, 537, 833
- Ross & Fabian (2004) Reynolds C.S., Wilms J., Begelman M.C., Staubert R., Kendziorra E., 2004, MNRAS, 349, 1153
- Ross & Fabian (1993) Ross R.R., Fabian A.C., 1993, MNRAS, 261, 74
- Ross, Fabian & Young (1999) Ross R.R., Fabian A.C., Young A.J., 1999, MNRAS, 306, 461
- Ross, Fabian & Ballantyne (2002) Ross R.R., Fabian A.C., Ballantyne D.R., 2002, MNRAS, 336, 315
- Rossi et al. (2004) Rossi S., Miller J.M., Homan J., Belloni T., 2004, submitted to MNRAS
- Rozanska et al. (2002) Rozanska A., Dumont A.-M., Czerny B., Collin S., 2002, MNRAS, 332, 799
- Taylor, Uttley & McHardy (2003) Taylor R.D., Uttley P., McHardy I.M., 2003, MNRAS, 342, L21
- Vaughan & Fabian (2004) Vaughan S., Fabian A.C., 2004, MNRAS, 348, 1415
- Wilms et al. (2001) Wilms J., Reynolds C.S., Begelman M.C., Reeves J., Molendi S., Staubert R., Kendziorra E., 2001, MNRAS, 328, L27
- Zycki et al. (1994) Zycki P.T., Krolik J.H., Zdziarski A.A., Kallman T.R., 1994, ApJ, 437, 597