Long-term spectral changes in the partial-covering candidate NLS1 1H 0707–495
Abstract
We compare two XMM-Newton observations of the Narrow-Line Seyfert 1 galaxy 1H 0707–495 separated by two years, and discuss the results in terms of the partial-covering phenomenon. The second longer observation once again displays a sharp ( eV) spectral drop above 7 keV; however, in comparison to the first observation, the edge depth and energy have changed significantly. In addition to changes in the edge parameters, the high-energy spectrum appears steeper. The changes in the high-energy continuum can be adequately explained in terms of a partial-covering absorber outflowing from the central region. The low-energy spectrum also shows significant long-term spectral variability, including: a substantial increase in the disc temperature; detection of a keV emission feature; and the presence of warm absorption that was also detected during the mission, but not seen during the first XMM-Newton observation. The large increase in disc temperature, and more modest rise in luminosity, can be understood if we consider the slim-disc model for 1H 0707–495. In addition, the higher disc luminosity could be the driving force behind the outflow scenario and the re-appearance of a warm medium during the second XMM-Newton observation.
keywords:
galaxies: active – galaxies: individual: 1H 0707–495 – X-rays: galaxies1 Introduction
The first observation of the Narrow-Line Seyfert 1 galaxy (NLS1) 1H 0707–495 () with XMM-Newton in October 2000 revealed a sharp spectral feature at keV in which the spectrum “jumped” by a factor of within a few hundred eV (Boller et al. 2002; hereafter B02). The measured energy and sharpness of the feature implied K-absorption by neutral iron; however, the absence of a fluorescence line suggested a more complicated situation. These observations coupled with the low intrinsic absorption below keV led B02 to consider a partial-covering model (Holt et al. 1980) to interpret the X-ray spectrum. Although a good fit was obtained, the model required a steep intrinsic power-law () and an iron overabundance of times solar.
In an alternative approach, Fabian et al. (2002) treated the spectrum as being dominated by a reflection component, where the deep edge was interpreted as the blue wing of a relativistically broadened iron line. This model was also successful in describing the 0.5–11 keV spectrum (including the soft-emission component), and required a more modest iron overabundance of 5–7 times solar.
A second attempt at fitting the spectrum with a partial-covering model was made by Tanaka et al. (2004; hereafter T04). They demonstrated that a partial-covering model, implementing a cut-off power-law (rather than a simple power-law), greatly reduced the iron abundance to times solar.
Three months following the XMM-Newton observation, 1H0707–495 was observed with (Leighly et al. 2002; hereafter L02). The flux was found to be about 10 times higher than what was measured with XMM-Newton. A preliminary investigation found that the edge feature was weak, possibly even absent, during the observation.
1H 0707–495 was observed with XMM-Newton for a second time two years after the first observation. In this paper we will focus on the differences between the two XMM-Newton observations, and attempt to explain them in the context of the partial-covering phenomenon. A reflection interpretation is also possible, and is investigated further by Fabian et al. (2004).
2 Observations and data reduction
The second XMM-Newton observation of 1H 0707–495 occurred on 2002 October 13 during revolution 0521 (hereafter this observation will be referred to as AO2). The total duration was 80 ks, during which time all instruments were functioning normally. The observation was carried out identically to the first Guaranteed Time observation during revolution 0118 (hereafter referred to as GT). The EPIC cameras were operated in full frame mode and utilised the medium filter.
The Observation Data Files (ODFs) from the GT and AO2 observations were processed to produce calibrated event lists using the XMM-Newton Science Analysis System (SAS v5.4.1). Unwanted hot, dead, or flickering pixels were removed as were events due to electronic noise. Event energies were corrected for charge-transfer inefficiencies. EPIC response matrices were generated using the SAS tasks ARFGEN and RMFGEN. Light curves were extracted from these event lists to search for periods of high background flaring. A background flare was detected during the first few ks of the AO2 observation, and the data have been ignored during this interval. The total amount of good exposure time selected was 70 ks and 78 ks for the pn and MOS detectors, respectively. Source photons were extracted from a circular region 35′′ across and centred on the source. The background photons were extracted from an off-source region and appropriately scaled to the source selection region. Single and double events were selected for the pn detector, and single-quadruple events were selected for the MOS. The total number of source counts collected in the 0.3–10 keV range by the pn, MOS1, and MOS2 were 275451, 46284, and 46426, respectively. Comparing the source and background spectra we found that the spectra are source dominated below 10 keV.
High-resolution spectra were obtained with the Reflection Grating Spectrometers (RGS). The RGS were operated in standard Spectro+Q mode, and collected data for a total of 76 ks. The first-order RGS spectra were extracted using the SAS task RGSPROC, and the response matrices were generated using RGSRMFGEN. The RGS data were background dominated during the GT observation.
3 The AO2 spectral and timing analysis
3.1 Spectral Analysis
The source spectra were grouped such that each bin contained at least 40 counts. Spectral fitting was performed using XSPEC v11.2.0 (Arnaud 1996). Fit parameters are reported in the rest-frame of the object. The quoted errors on the model parameters correspond to a 90% confidence level for one interesting parameter (i.e. a = 2.7 criterion). The Galactic column density toward 1H 0707–495 is = 5.8 1020 cm-2 (Dickey & Lockman 1990). Element abundances from Anders & Grevesse (1989) are used throughout. Luminosities are derived assuming isotropic emission and a standard cosmology with =, , and .
While both the pn and MOS data from each observation were examined for consistency, the discussion focuses on the pn results due to the higher signal-to-noise and the better stability of the pn calibration over the two years separating the observations.
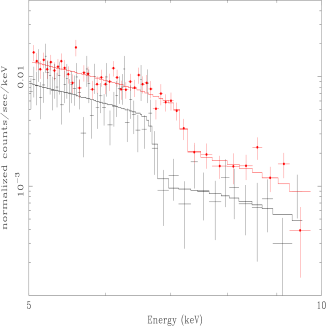
Figure 1 gives a direct comparison between the GT and AO2 time-averaged spectra.
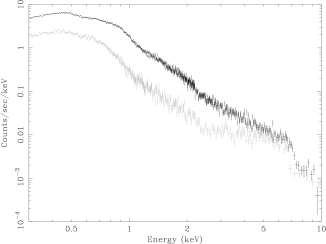
In general, the count rate below 5 keV is higher during the AO2 observation; however, between 5–10 keV the fluxes are comparable. The flattening of the spectrum above 2 keV, seen in the GT data, is clearly diminished in the AO2 data. The depth () and energy () of the edge-like feature at 7 keV have changed.
Fitting a power-law and edge to the 3–10 keV AO2 data resulted in a good fit ( = 126 for 122 ), with the edge parameters keV and . In addition the edge was sharp, with an intrinsic width of eV (measured with the SMEDGE (Ebisawa 1991) model in XSPEC). Treating the keV edge as a blueshifted neutral edge, we would expect neutral iron emission at keV. However, the best-fit line ( keV) was broad ( eV) and only a marginal improvement to the edge fit ( for 3 additional free parameters). The broadness of the line is problematic, as it is expected that the line would be narrower than the edge.
The 90% upper limit on the line flux is erg s-1 cm-2, whereas the flux absorbed by the edge is erg s-1, resulting in a line-to-edge flux ratio of 0.13. For a spherically symmetric distribution of absorbing material, the expected line-to-edge flux ratio is approximately equal to the fluorescent yield for iron (0.34; Bambynek et al. 1972). Therefore, for 1H 0707–495 the expected ratio is more than 2.5 times the measured value, and the discrepancy is even larger if the edge and line are treated as arising from ionised iron (Krolik & Kallman 1987). The measured line-to-edge flux ratio indicates that the absorber covers a solid angle .
When applying the partial-covering model used by T04 to interpret the GT observation to the AO2 data it was found that the two data sets were very similar. The 2–10 keV spectrum could be fitted with a cut-off power-law (, keV), modified by an absorber with an iron overabundance of times solar, consistent with what was used to model the GT data. The primary difference is that the AO2 model only requires one absorber, which is equivalent to setting the covering fraction of the second absorber, used on the GT data, to zero. The reduced amount of absorption can simultaneously explain the apparently steeper spectrum and the shallower edge seen in the AO2 data. Indeed, the intrinsic, unabsorbed 2–10 keV spectra from the two observations were entirely consistent, with a flux difference of only a factor of . The edge was found at a higher energy (7.5 0.1 keV) during the AO2 observation, and this is discussed at length in Section 4. The use of the power-law with a low cut-off energy is empirical. Allowing for curvature in the high-energy spectrum greatly reduces the iron abundances.
Considering the broad-band (0.3–10 keV) spectrum, a multi-coloured disc black body component (MCD; Mitsuda et al. 1984; Makishima et al. 1986) was included to fit the soft-excess below keV.
In treating the intrinsic absorption in the GT data, T04 found that including an edge at 0.37 keV (0.39 keV rest-frame) was an improvement over using only neutral absorption. It was uncertain if the edge was required due to calibration uncertainties or if it was due to intrinsic C v absorption in 1H 0707–495. In order to make the most direct comparison with the earlier observation we also included an edge at 0.37 keV, in addition to Galactic and intrinsic cold absorption. All model parameters for the complete AO2 fit are given in Table 1.
While the continuum model of an intrinsically absorbed MCD and cut-off power-law modified by partial-covering provided a good fit to the high- and low-energy spectra, the fit was inadequate in the 0.5–2 keV range ( = 1340 for 569 ). The AO2 continuum appeared to be modified by line-like absorption and emission. Fits using only one Gaussian profile (either an absorption or emission line) were unsuccessful, as were attempts to fit the data with an absorption edge. Two distinct Gaussian profiles, one absorption and one emission, were required. An absorption profile with an equivalent width of eV, an energy of 1.17 keV, and a width of eV, as well as an emission profile with 25 eV, 0.92 keV, and eV, were included in the broad-band fit ( = 684 for 6 addition free parameters).
The RGS spectra are of low signal-to-noise, but confirmed the existence of the absorption feature detected in the pn. The improvement to the partial covering continuum, by the addition of the Gaussian absorption profile was for 3 additional free parameters. The line energy and width was keV and eV, respectively. No strong emission features were prominent in the RGS spectra at approximately 0.92 keV (only one RGS is effective in this energy range); however there was indication of a skewed excess at a slightly lower energy which could be consistent with the EPIC findings. The absence of a convincing emission feature in the RGS is probably a result of the poorer signal-to-noise, since the feature was detected in all three EPIC instruments, as well as the earlier observation (L02).
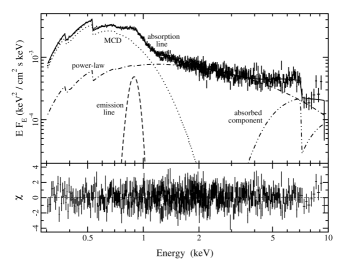
The complete partial-covering model applied to the EPIC pn AO2 data is presented in Figure 2 ( = 656 for 563 ), and the fit parameters are given in Table 1. The 0.3–10 keV flux and luminosity, corrected for Galactic absorption, are erg s-1 cm-2 and erg s-1, respectively. The 2–10 keV luminosity is erg s-1.
| Low-Energy Absorption | ||||
|---|---|---|---|---|
| Galacticf | 5.8 1020 cm-2 | |||
| Intrinsic (cold) | (1.6 0.2) 1020 cm-2 | |||
| Intrinsic (edge) | keV | |||
| Continuum | ||||
| MCD | eV | |||
| Cutoff power-law | keV | |||
| Partial Coverer | ||||
| Absorption | cm-2 | |||
| Fe abundance | solar | |||
| Covering fraction | 0.69 0.01 | |||
| Line Features | ||||
| Emission | eV | eV | eV | |
| Absorption | keV | eV | eV |
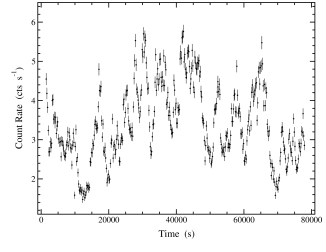
3.2 Timing Analysis
The 0.3–12 keV pn light curve from AO2 is presented in Figure 3. The average count rate was about three times higher than it was during the GT observation. Count rate variations by about a factor of four were seen throughout the observation. The persistent and rapid variability is quite typical of 1H 0707–495 (Leighly 1999; B02).
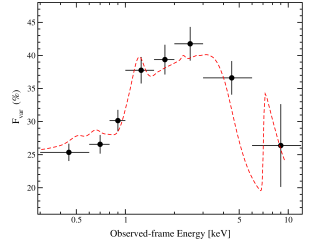
During the GT observation, 1H 0707–495 displayed no significant spectral variability. Hardness ratio curves showed some variability (Figure 5 of B02), but they were uncorrelated with flux. The fractional variability amplitude Fvar, (Edelson et al. 2002; using the unweighted mean count rate and sigma), was calculated in six energy bands between 0.1–10 keV to examine the degree of variability in each band; it was determined to be constant during the GT observation (Figure 4 of B02). However, the Fvar spectrum portrays substantially more spectral variability during the AO2 observation (data points in Figure 4).
Figure 4 appears similar to the rms spectrum from the high-flux state observation (L02), as well as to the rms spectrum of some broad-line Seyfert 1s, such as NGC 4151 (Zdziarski et al. 2002). In addition, Figure 4 is notably similar to the Fvar spectrum of another partial covering candidate NLS1, IRAS 13224–3809 (Gallo et al. 2004).
Fabian et al. (2004) modelled the rms spectrum shown in Figure 4 and demonstrated that it could be well-fitted as the superposition of two components with different intrinsic rms: a variable power-law (in flux only), and a less variable reflection component.
The energy-dependent variability can also be explained within the partial covering scenario. For a finite extension of the emission region, the covering condition can be more complex than described by a single absorber with parameters (covering fraction) and (column density in units of cm-2). As a better approximation we assume two partial coverers (double partial covering; see T04), and then model the high-flux ( cts s-1) and low-flux ( cts s-1) spectra simultaneously for a common intrinsic spectrum (e.g. see Figure 7 of Boller et al. 2003). The high- and low-flux spectra are grouped with bins containing at least 40 and 20 counts, respectively. All model parameters of the high- and low-flux spectra are linked, and only the covering fraction () of each absorber is allowed to vary independently. The model gives a satisfactory fit ( for 683 ). The covering parameters of the two absorbers () are determined to be (0.61, 36.0) and (0.46, 0.21) in the high-flux state, and (0.80, 36.0) and (0.0, 0.21) in the low-flux state. In Figure 4 we show the ratio (high/low) of the two models (dashed-line) overplotted on the rms spectrum. A double partial covering can reproduce the energy-dependent variations in shape and amplitude.
4 Discussion
4.1 A shifting edge and relativistic outflows
Perhaps the most interesting changes between the two observations are the differences in the edge parameters (Figure 5).
During the GT observation the edge energy was keV, entirely consistent with neutral iron. At the second epoch the edge energy was considerably higher, keV. In addition, the edge depth during AO2 was approximately half as deep as it was during the first observation. The intrinsic edge widths were narrow at both epochs. The 90% confidence upper-limits on the intrinsic edge widths were 350 eV and 160 eV during the GT and AO2 observations, respectively. If we continue to adopt the iron edge interpretation for the second observation, the edge energy corresponds to absorption by Fe vii–x.
Two scenarios emerge as possible explanations for the differing edge energies: (1) a change in the ionisation state, or (2) a high-speed outflow.
While a change in the ionisation state due to a change in the ionising continuum is plausible, the drawback is that the width of the edge is narrow in both observations. Palmeri et al. (2002) discuss two distinct spectral features of the Fe K edge which seem relevant here. First, a sharp edge is only expected in low-ionisation plasmas ( = () [cgs units are hereafter assumed]; where is the incident X-ray luminosity, is the gas density, and is the distance from the radiation source), in which case the edge energy would be consistent with neutral iron within the available resolution. Secondly, for higher ionisation plasmas ( 1), a strong absorption feature appears at about 7.2 keV, arising from the K unresolved transition array. Even within our uncertainties, we can dismiss absorption features below 7.3 keV; therefore a photoionisation interpretation for the shifting edge seems unlikely.
On the other hand, if the edge arises from a neutral absorber, the observed energy implies an approaching velocity of (). This interpretation is consistent with the edge width remaining constant over the two year span. In the context of the partial-covering phenomenon, assuming that new absorbers are not being generated, the outflowing material would result in a decrease of the covering fraction, and subsequently a decrease in the edge depth as the absorbers cover a smaller solid angle. Both effects, a shallower edge and reduced absorption, are observed in the AO2 data. Evidence for an outflow was also seen in the spectrum of 1H 0707–495 (Leighly 2004), although not at such high velocities. An equally sharp feature in IRAS 13224–3809 (Boller et al. 2003) was found at keV. The outflow scenario was also suggested for that NLS1.
Considering a patchy-absorber model, and following, for example, Turner et al. (1993), Reynolds (1997) and Ogle et al. (2004), the mass loss rate can be estimated by combining the continuity equation (where is the volume-filling factor and the atomic density) with the expression for the ionization parameter to obtain . For , ionizing luminosity erg s-1 and , this gives M⊙ yr-1 and a kinetic luminosity erg s-1. The mass accretion rate estimated in TO4, assuming a slim disk (see Section 4.2.3) and their estimated mass, is M⊙ yr-1. For the outflow rate to be consistent with the mass accretion rate, [cgs] is required, i.e. the absorber is extremely clumped. A clumped medium is also the simplest way to reduce the mass flux (Krolik et al. 1985).
Inserting the value of into gives [cgs], where is the distance to the absorber. For simplicity, we assume spherical “blobs” of radius , which are randomly distributed. The covering fraction obtained from the fit shows that the average number of intersecting blobs in the line-of-sight is (Tanaka, Ueda, Boller 2003). Using the column density estimated from the fit, cm-2, we get cm. The mean free path of an ionizing photon is given by . Since ; , we obtain cm, and cm. These values are not inconsistent with those estimated from the time scale of variability (TO4). The atomic density is very high, cm-3. Such blobs would need to be confined by magnetic fields (e.g. Rees 1987).
4.2 The low-energy spectrum
At both epochs, the low-energy continuum is dominated by a thermal component which can be successfully fitted with a MCD. The inner-disc temperature is noticeably higher (%) during AO2 ( 155 eV, 103 eV).
In addition, a strong “P Cygni-type” type feature is also observed during the AO2 observation (Figure 6). The profile is likely coincidental and unrelated to the outflow scenario since there is no evidence of P Cygni-type profiles in the RGS.
4.2.1 An extended warm medium
Qualitatively, the P Cygni-type feature is similar to that detected during the observation of 1H 0707–495. In a preliminary investigation L02 determined that the feature was best described when both emission and absorption were considered. We have also treated the feature as a blended absorption and emission profile from a warm medium.
Similar absorption features have been observed in other NLS1. Nicastro, Fiore & Matt (1999) suggest that such absorption features are likely a blend of resonance absorption lines due to mostly ionised L-shell iron. Interestingly, IRAS 13224–3809, another partial-covering NLS1 candidate (Boller et al. 2003), also displays a similar absorption feature.
The emission feature can be explained as arising from an extended warm medium, at lower ionisation, and lying outside the line-of-sight. In addition to the observation, similar emission features have been observed in the NLS1: NGC 4051 during its low-flux state (Uttley et al. 2003), and Mrk 1239 (Grupe et al. 2004). For both objects, the authors attributed the emission to ionised Fe and/or Ne. In a thorough investigation of the low-state RGS spectra of NGC 4051 Pounds et al. (2004) identified emission features around 900 eV as arising from Ne ix and the radiative recombination continua from O viii. Detailed simulations of high-resolution data are still required to address the exact nature of this feature in 1H 0707–495.

The emission/absorption feature was not detected during the low-flux GT observation (B02; Fabian et al. 2002; T04). Simulations of the pn data using the AO2 model and a 40 ks exposure time (consistent with the GT exposure time) indicated that both the emission and absorption features should have been significantly detected during the shorter GT observation, if they were present. Furthermore, the absorption feature was detected in the observations of 1H 0707–495 (Leighly et al. 1997; Leighly 1999; Vaughan et al. 1999) when the flux was comparable to the AO2 flux. Indications are that these warm features are time variable, at least on time scales of months, and possibly related to the luminosity of 1H 0707–495 in such a way that the features are present during higher-luminosity states.
4.2.2 Slim disc considerations
If the low-energy continuum is due to disc emission, then the measured temperature is too high for a standard accretion disc (discussed in T04). It was shown in T04 that the intrinsic bolometric luminosity during the GT observation was near the Eddington limit for an estimated mass of . During the AO2 observation the intrinsic luminosity was approximately a factor of two higher. In these luminosity regimes () the slim-disc model, first proposed by Abramowicz et al. (1988), is applicable.
Mineshige et al. (2000) adopted the slim-disc model to describe the disc emission and variability in a sample of NLS1, including 1H 0707–495. A key element of the slim-disc approximation is that the temperature-luminosity relation is steeper when , than it is in the standard disc case (e.g. Mineshige et al. 2000; Watarai et al. 2001). This can explain the observed increase in temperature against a moderate increase in luminosity.
A significant increase in the accretion rate resulting in higher luminosities could potentially explain the long-term variability seen in a warm medium supposedly located light-months away.
4.3 Short-term spectral variability
The rms spectrum during the GT observation showed no significant spectral variability. The explanation for this is rather straightforward in terms of partial covering (e.g. T04). The AO2 spectral variability is much more complex; however, it can still be described in the context of partial covering if we adopt a double partial covering (Sect. 3.2; see also T04). A similar picture can probably be drawn for the spectral variability in IRAS 13224–3809 (Boller et al. 2003; Gallo et al. 2004). Admittedly, a second absorber does introduce additional parameters into the fit, but considering the possible complexity of partial covering in reality, a double coverer is probably a better description of the physical processes involved than a single absorber is.
4.4 Comments on previous X-ray observations of 1H 0707–495
As indicated by its name, 1H 0707–495 was identified as a HEAO1 source. Remillard et al. (1986) reported a 2–10 keV flux of erg cm-2 s-1, a factor of higher than the AO2 observation, and more than 50 times higher than the GT observation. Clearly, source confusion was a consideration with this mission, and it is possible that not all of the HEAO1 flux is attributed to 1H 0707–495. However, Remillard et al. had good reasons against a false detection, and no new information has surfaced to strongly question the identification (R. Remillard 2004, priv. comm.).
About three months after the first XMM-Newton observation of 1H 0707–495, it was observed with Chandra. A preliminary analysis by L02 showed that the flux of 1H 0707–495 had dramatically increased by nearly a factor of 10. Interestingly, L02 found that a keV edge was not statistically required by the data. The 90% upper-limit on the edge depth was .
In principle (and barring detailed analyses), these earlier observations could be understood in the context of partial covering. The HEAO1 flux is high (assuming it was all attributed to 1H 0707–495), but it is comparable to the intrinsic value estimated by T04; thus it could be achieved with a near “minimum” in the covering fraction of the absorber. As with the AO2 observation, the observation showing a diminished (possibly absent) edge and higher flux could also arise from a reduction in the covering fraction.
5 Conclusions
Two XMM-Newton observations of 1H 0707–495 separated by more than two years are examined and compared. Our findings are as follow:
-
(1)
The edge energy and depth are significantly different, while the intrinsic edge width remains consistently narrow ( 300 eV). Between the two observations, the edge energy has shifted from 7.0 keV to 7.5 keV, and the edge depth has diminished by 50%.
-
(2)
Emission and absorption lines are detected in the low-energy spectrum indicating the presence of an extended warm medium.
-
(3)
The temperature of the MCD component used to model the soft-excess is much higher during the AO2 observation ( 155 eV) compared to the GT observation ( 103 eV).
-
(4)
The flux variability during AO2 is typical of what has been seen in 1H 0707–495 previously. There was also strong spectral variability during AO2 which was not observed during the GT observation.
The X-ray spectrum of 1H 0707–495 appears remarkably different over the span of two years, showing apparent changes in the spectral slope, as well as changes in the edge characteristics. We have demonstrated that the primary X-ray source (the power-law emitter) is not required to undergo any physical changes during this time; rather the differences can be explained simply by changes in a line-of-sight absorber associated with the partial-covering phenomenon. The changes in the disc temperature, line-like features at low energies, energy-dependent time variability, and shift in the edge energy may be related to an increase of the intrinsic luminosity. The energy-dependent time variability can be explained assuming two separate absorbers (there could be a range of absorbers). The shift of the edge energy is a challenge since it requires that the absorber is extremely clumpy.
Further observations of 1H 0707–495 in various flux states should be able to distinguish between the partial covering and reflection models.
Acknowledgements
Based on observations obtained with XMM-Newton, an ESA science mission with instruments and contributions directly funded by ESA Member States and the USA (NASA). We would like to thank the referee, Andrzej Zdziarski, for a critical reading and many helpful comments. WNB acknowledges support from NASA grant NAG5–12804.
References
- [1] Abramowicz, M. A., Czerny B., Lasota J. P. & Szuszkiewicz E., 1988, ApJ, 332, 646
- [2] Anders E. & Grevesse N., 1989, GeCoA, 53, 197
- [3] Bambynek, W, Crasemann B., Fink R., Freund H., Mark, H., Swift C., Price R., & Rao V., 1972, Rev. Mod. Phys., 44, 716
- [4] Boller Th., Fabian A. C., Sunyaev R., Trümper, J., Vaughan S., Ballantyne D. R., Brandt W. N., Keil R., & Iwasawa K., 2002, MNRAS, 329, 1 (B02)
- [5] Boller Th., Tanaka Y., Fabian A., Brandt W. N., Gallo L., Anabuki N., Haba Y., & Vaughan S., 2003, MNRAS, 343, 89
- [6] Dickey J. M., Lockman F. J., 1990, ARA&A, 28, 215
- [7] Edelson R., Turner T. J., Pounds K., Vaughan S., Markowitz A., Marshall H., Dobbie P., & Warwick R., 2002, ApJ, 568, 610
- [8] Ebisawa K., 1991, Ph.D. thesis, Univ. Tokyo
- [9] Fabian A. C., Ballantyne D. R., Merloni A., Vaughan S., Iwasawa K., & Boller Th., 2002, MNRAS, 331, 35
- [10] Fabian A. C., Miniutti G., Gallo L., Boller Th., Tanaka Y., Vaughan S., & Ross R. R., 2004, (accepted by MNRAS)
- [11] Gallo L. C., Boller Th., Tanaka Y., Fabian A., Brandt W. N., Welsh W. F., Anabuki N., & Haba Y., 2004, MNRAS, 347, 269
- [12] Grupe D., Mathur S., & Komossa S., 2004, accepted by AJ (astro-ph/0402268)
- [13] Holt S. S., Mushotzky R. F., Boldt E. A., Serlemitsos P. J., Becker R. H., Szymkowiak A. E., & White, N. E., ApJ, 241, 13
- [14] Krolik J. H. & Kallman T. R., 1987, ApJ, 320, 5
- [15] Krolik J. H., Kallman T. R., Fabian A. C., & Rees M. J., 1985, ApJ, 295, 104
- [16] Leighly K. M., Mushotzky, R. F., Nandra, K., & Forster, K., 1997, ApJ, 489, 25
- [17] Leighly K., 1999, ApJS, 125, 317
- [18] Leighly K., Zdziarski A., Kawaguchi T., Matsumoto, C., 2002, in Boller Th., Komossa S., Kahn S., Kunieda H., Gallo L., eds, X-ray Spectroscopy of AGN with Chandra and XMM-Newton. MPE Report 279, p. 259 (L02)
- [19] Leighly K. M., 2004, accepted by ApJ (astro-ph/0402452)
- [20] Makishima K., Maejima Y., Mitsuda K., et al., 1986, ApJ, 308, 635
- [21] Mineshige S., Toshihiro K., Takeuchi M., & Hayashida K., 2000, PASJ, 52, 499
- [22] Mitsuda K., Inoue H., Koyama K., et al., 1984, PASJ, 36, 741
- [23] Nicastro F., Fiore F., Matt G., 1999, ApJ, 517, 108
- [24] Ogle P. M., Mason K. O., Page M. J., Salvi N. J., Cordova F. A., McHardy I. M., & Priedhorskyi W. C., 2004, accepted by ApJ (astro-ph/0401173)
- [25] Palmeri P., Mendoza C., Kallman T. R., & Bautista M. A., 2002, ApJ, 577, 119
- [26] Pounds K. A., Reeves J. N., King A. R., Page K. L., 2004, MNRAS, 350, 10
- [27] Rees M. J., 1987, MNRAS, 228, 47
- [28] Remillard R., Bradt H., Buckley D., Roberts W., Schwartz D., Tuohy I., Wood K., 1986, ApJ, 301, 742
- [29] Reynolds C. S., 1997, MNRAS, 286, 513
- [30] Tanaka Y., Ueda Y., Boller Th., 2003, MNRAS, 338, 1
- [31] Tanaka Y., Boller Th., Gallo L., Keil R., & Ueda Y., 2004, PASJ, 56, 9 (T04)
- [32] Turner T. J., Nandra K., George I. M., Fabian A. C., & Pounds K. A., 1993, ApJ, 419, 127
- [33] Uttley P., Fruscione A., McHardy I., Lamer G., 2003, ApJ, 595, 656
- [34] Vaughan S., Reeves J., Warwick R., & Edelson R., 1999, MNRAS, 309, 113
- [35] Watarai K., Mizuno T., & Mineshige S., 2001, ApJ, 549, 77
- [36] Zdziarski A., Leighly K., Matsuoka M., Cappi M., Mihara T, 2002, ApJ, 573, 505