A population of extreme mid-to-near-infrared sources: obscured AGN and dusty starbursts
We present a sample of mid-infrared detected sources from the European Large Area ISO Survey (ELAIS) regions characterised by strong mid-IR radiation with faint near-IR and optical counterparts. These extreme mid-to-near-IR objects (EMNOs) are defined here by a flux ratio of . This population is not obvious in deeper small area ISO surveys, though it produces more than 20% of the observed cosmic IR background radiation (CIRB) at 15m above 1 mJy. Near-future large area deep mid-IR surveys with the Spitzer Space Telescope, however, are bound to uncover large amounts of these objects, which we argue to most likely be obscured AGNs, based on SED shapes and X-ray data. Very strong dusty starbursts at may also have high mid-to-near-IR flux ratios, but using the MIR/NIR and FIR/MIR ratios these may be separated. Most of our EMNOs appear to be ULIRGs, half are also extremely red objects (ERO). A curious case of a low redshift, less luminous object with a very young stellar population is also found. We predict that the simple broad band selection method makes EMNOs a useful window into high-redshift obscured nuclear activity and its sought after relation to star-formation, in a similar way that EROs have been used to define samples of high-redshift early type galaxies.
Key Words.:
Galaxies: evolution – Galaxies: starburst – Galaxies: active – Infrared: galaxies – Cosmology: observations1 Introduction
The broadband photometric study of galaxies has turned out to be an efficient method of discovering new classes of galaxies. For example, the extension of optical photometry into the near-infrared region revealed a population of sources that was not represented in optical surveys (Elston, Rieke & Rieke El88 (1988)). These objects were called “Extremely Red Objects” (EROs) because of their very red optical-infrared colours , and have become a useful tool in constraining galaxy formation and evolution models in the redshift range .
The Infrared Space Observatory (ISO) opened up wavelengths for large scale galaxy surveys further in the infrared (e.g. Franceschini et al. Fr01 (2001)). However, only the shorthly available wealth of mid- and far-infrared photometric data obtained with the Spitzer Space Telescope (Werner et al. We04 (2004)) will truly uncover the obscured history of the universe at for systematic and statistical studies.
Luminous and ultraluminous IR-galaxies, (U)LIRGs () are a key population producing most of the stellar energy output in the Universe since the recombination era (Elbaz & Cesarsky El03 (2003)). On the other hand, several shortcomings of the generally successful and appealing hierarchical scenarios of galaxy formation may be due to the poor understanding of the AGN/galaxy formation and starburst interplay (Granato et al. Gr04 (2004)). Indeed, extreme IR-galaxies always seem to have AGN contributions in varying degrees (e.g. Farrah et al. Fa03 (2003); Serjeant et al. Se03 (2003)).
In this Paper we present a sample of faint ISO detected mid-IR galaxies which we argue to belong to these crucial classes of objects needed to be understood before galaxy evolution and structure formation in the Universe can be fully modelled. We show that a selection made by high mid-IR to near-IR flux ratio will uncover specifically sources with obscured AGN activity, and possibly extremely high starformation, with the AGN component growing with the afore mentioned ratio. Nearly all the sources found in this study are above the ULIRG limit. We discuss sub-classes of these bright mid-IR objects to aid the classification and study of IR-galaxies undoubtedly soon to be cataloged by Spitzer in plentitude. Cosmology used throughout is: , and .
2 The EMNO criterion
We search for objects with a flux ratio , and dub these extreme mid-to-near-IR objects, EMNOs. The limit was chosen because the very strongest starburst galaxies, such as Arp220, are expected to have approximately this flux ratio (e.g. Charmandaris et al. Ch02 (2002)), while AGN related phenomena produce steeper NIR-MIR SEDs (Haas et al. Ha03 (2003); Prouton et al. Pr04 (2004)).
The adopted criterion is tested in Fig. 1 using ISO data and models. In the upper panels we plot the MIR/NIR flux ratio against the colour. The small crosses in the left panel are (extragalactic) sources from European Large Area ISO Survey (ELAIS; Oliver et al. Ol00 (2000)) taken from the multiwavelength ELAIS Band-Merged Catalogue111http://astro.imperial.ac.uk/Elais/Data_release/ (Rowan-Robinson et al. Row04 (2004)). They are shown to mostly consist of “normal” starforming galaxies (see also Pozzi et al. Po03 (2003); Väisänen et al. Va02 (2002)) and fall into the lower left quadrant. The flux limit of ELAIS at m is approximately 0.7 mJy, and and are the limits in the other bands.
We also checked deeper ISO surveys, with sensitivity limits varying between mJy, in the HDF-N, HDF-S, Lockman Hole, and CFRS fields (data from Aussel et al. Au99 (1999); Mann et al. Ma02 (2002); Fadda et al. Fa02 (2002); Flores et al. Fl99 (1999)). Data with appropriate bands available are overplotted in the upper right panel of Fig. 1. Though these deeper and small area surveys on average pick up slightly redder sources than ELAIS, they do also clearly concentrate in the same lower left region. The only population with were found from the Fadda et al. (Fa02 (2002); see also Franceschini et al. Fr02 (2002)) X-ray selected Lockman data-set of ISOCAM counterparts to XMM-Newton sources. All of the Fadda et al. sources are classified as obscured AGN (typically with ) using X-ray characteristics, though 6 out of 7 of them remained unclassified in the optical.
Galaxy model colours, plotted in the lower panels of Fig. 1, are calculated using SEDs from the GRASIL model (Silva et al. Si98 (1998)). As seen, normal starforming galaxies always have . IR-galaxies with very strong PAH emission such as Arp220, have larger flux ratios, upto our EMNO criterion. They are rare in the local Universe. ULIRGs at higher redshift are expected to be picked up more readily. However, K-correction (combined with strong silicate absorption) hampers their detection at resulting in an apparent gap in the MIR/NIR distribution in a flux-limited sample.
On the other hand, in sources where AGN activity heats the dust, MIR/NIR ratio is typically large at any redshift. It is important to stress that the EMNO selection picks out specifically obscured AGN. Obscured nuclei with values in excess of , are always EMNOs, often with and the ratio increases with increasing (calculated from SEDs in Silva et al. Si04 (2004)), while e.g. Sy1 nuclei are never EMNOs (Fig. 1, dash-dot curve). We note that in the parameterization of SEDs of Seyfert nuclei between 1 and 16m by Alonso-Herrero et al. (Al03 (2003)), our EMNO limit corresponds to their spectral index , where their Sy2s are found.
Inclusion of the host galaxy properties complicates the models. In Fig. 1 the higher plotted ’AGN-2’ model is a ’custom scaled’ composite of Arp220 SED and the nuclear SED of NGC1068 (latter taken from Silva et al. Si04 (2004)), resulting in an EMNO. The lower solid curve is calculated from composite type-2 QSO + host galaxy models of Silva et al. (Si04 (2004)), using a combination giving a maximal : AGN X-ray luminosity and . This implies that most local AGN-hosting galaxies, where the SED templates were derived from, are not quite extreme enough to be EMNOs. The luminosity of the host galaxy vs. the AGN plays an important role – and thus can potentially be studied – with EMNO selection: e.g. in the models of Treister et al. (Tr04 (2004)), where an evolved elliptical is the host of all obscured AGN, there are differences by factors of several in compared to models used above with equivalent choices of and . However, the general characteristics of the models are similar, i.e. with host+AGN combination models EMNOs are expected only from sources with strong AGN contribution, , with the highest ratios at produced by sources with close to values of .
When using the Spitzer MIPS/IRAC bands, Arp220 -like ultraluminous starbursts have (except locally), and our EMNO definition would then be , corresponding to Spitzer colour of . Indeed, a handful of such sources are evident in early Spitzer results (e.g. Lonsdale et al. Lo04 (2004); Chary et al. Ch04 (2004); Yan et al. Ya04 (2004); Le Floc’h et al. Lef04 (2004)) – they are tentatively interpreted as being luminous IR-galaxies where an AGN cannot be ruled out with the available data. The mentioned MIR/NIR flux ratio does not significantly change with the used IRAC band. With -band, would be appropriate. It is noteworthy that when using the longer wavelength IRAC bands the expected AGN-2 flux ratio becomes increasingly similar to strong starbursts, and thus -band or m is best if the goal is to separate AGN from starformation.

3 Observational data and the sample
Our sample of near- and mid-IR detected galaxies presented here are from the ELAIS fields N1 and N2. The m data, taken in the ISOCAM LW3 band and reaching approximately 0.7 mJy, are from ELAIS 15m Final analysis catalogue (Vaccari et al. Vac04 (2004)), available also within the multiwavelength ELAIS Band-Merged Catalogue (Rowan-Robinson et al. Row04 (2004)). The NIR observations, however, are deeper than those available in the Band-Merged Catalogue and are described in Väisänen & Johansson (2004b ) in detail – essentially, we carried out a small-area survey to 20 mag targeting faint ISOCAM sources in approximately the range 1 to 3 mJy, without obvious counterparts in DSS images. A total of 12 ISO sources were observed in this survey, and all were found to have -band counterparts. Observations were made with the 3.0-m NASA IRTF telescope on Mauna Kea under photometric conditions (seeing varied between 0.7-1.0″) using the NFSCam format InSb detector array with a pixel scale. Optical photometry in SDSS-like filters is taken from the Isaac Newton Telescope Wide Field Survey (WFS)222http://www.ast.cam.ac.uk/wfcsur/index.php data products (McMahon et al. Mc01 (2001); Gonzales-Solares et al. Go04 (2004)).
The MIR data is matched with the NIR-optical data-sets using a 4″ search radius around the ISOCAM detections. We do not expect spurious matches given that the probability of finding a chance mag object within the search area is , and the ISOCAM detection error circle radius () is better than 2″ (Vaccari et al. Vac04 (2004)).
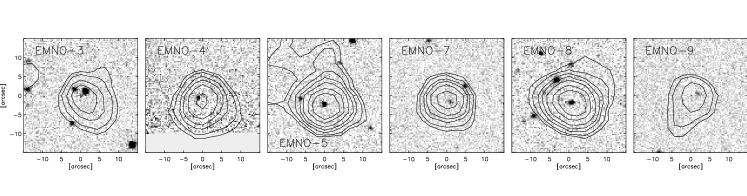
We find 6 EMNOs from the IRTF data, from the total of 12 matches between ISO and IRTF data. One of them is the fainter NIR counterpart of an ISO object with two possible counterparts. In addition, we searched for EMNOs in the full published ELAIS catalogue (the ISO data characteristics are the same as in our EMNO survey), which covers a much wider area but utilises a significantly shallower NIR coverage: three additional sources are found (EMNOs 1, 2, and 6). The photometry of all the 9 sources is presented in Table 1, and Fig. 2 shows the 6 EMNOs from our own -band images with 15m contours overlaid.
| Object | S/R | SFR | SED | |||||||||
| (1) | (2) | (3) | (4) | (5) | (6) | (7) | (8) | (9) | (10) | (11) | (12) | (13) |
| EMNO-1 ELAISC15_J160913.2+542320 | 17.18 | 2.61 | 12.38 | 30.9 | (1.4) | 1090 | 12.7 | HR10 | ||||
| EMNO-2 ELAISC15_J161024.4+542328 | 17.42 | 1.91 | 12.19 | 28.2 | (1.4) | 870 | 12.6 | HR10 | ||||
| EMNO-3 ELAISC15_J163531.1+410025 | 21.98 | 20.69 | 17.79 | 1.40 | 9.89 | 28.5 | 170 | 12.0 | M82 | |||
| EMNO-4 ELAISC15_J163543.1+410750 | 18.58 | 1.66 | 16.86 | 55.1 | (1.5) | 300 | 12.1 | M82 | ||||
| EMNO-5 ELAISC15_J163615.7+404759 | 23.90 | 22.85 | 21.32 | 21.17 | 17.47 | 2.78 | 31.24 | 55.6 | 1000 | 12.7 | Arp220 | |
| EMNO-6 ELAISC15_J163748.1+412100 | 17.93 | 1.14 | 6.65 | 26.9 | (1.4) | 550 | 12.4 | HR10 | ||||
| EMNO-7 ELAISC15_J163515.6+405608 | 23.20 | 22.82 | 22.52 | 19.02 | 2.14 | 19.88 | 98.0 | Sc 4Gyr | ||||
| EMNO-8 ELAISC15_J163541.7+405900 | 20.66 | 19.95 | 19.62 | 19.99 | 17.78 | 3.69 | 28.32 | 78.6 | 0.188 | Sc 2Gyr | ||
| EMNO-9 ELAISC15_J163655.8+405909 | 22.92 | 22.96 | 23.02 | 18.73 | 1.02 | 7.17 | 63.3 | 2.610 | Sc 3Gyr |
4 Discussion
4.1 Colours and colour-colour diagrams
The MIR/NIR flux ratio vs. optical to NIR colour of our EMNOs are shown as solid symbols in the upper panels of Fig. 1. It is obvious that they are well separated from the bulk of MIR galaxies. Our non-EMNO IRTF/ISOCAM sources are plotted with open circles. Six of the EMNOs are also EROs, or very close to being EROs (defined as , see Väisänen & Johansson 2004a ). As is well known, EROs are thought to be either passively evolving ellipticals or highly reddened dusty starbursts. For comparison, we overplot (open squares) three spectroscopically confirmed ISO-detected EROs (Pierre et al. Pi01 (2001); Smith et al. Sm01 (2001); Elbaz et al. 2002b ). None of them are EMNOs, although the overall SED of especially HR10 (the reddest of the plotted three) is very similar to e.g. our EMNO-5 (see below).
4.2 SEDs and redshifts
Figure 3 shows the observed SEDs of our EMNOs. It is even more obvious than from the colour alone that there are two kinds of EMNOs, those with optically red colours (EMNOs 1–6) and those that are bluer (7–9). We discuss them separately.
We fitted representative IR-bright GRASIL models (Silva et al. Si98 (1998)), namely M82, Arp220, and the extremely obscured starburst ERO HR10, to the optical–FIR SEDs of red EMNOs. Later ISO data has shown the HR10 IR-SED to closely resemble that of the starburst ULIRG Arp220 (Elbaz et al. 2002b ) but we chose here to retain the older GRASIL-SED to represent the intermediate IR-luminosities between M82 and Arp220.
We had spectroscopic redshifts for only two objects in our EMNO sample and for the other sources we had to resort to photometric redshift methods. For the three EMNOs with optical detections we calculated photometric redshifts using the HYPERZ software (Bolzonella et al. Bo00 (2000)). For EMNO-3 we found a best fit of (all errors are 1) and for EMNO-7 we found a photometric redshift of . We also searched for secondary redshift solutions and for EMNO-3 and EMNO-7 we found secondary solutions that were within the 1 error bars of the primary solutions. For EMNO-5 the photometric redshift was better constrained with a very well fitted Arp220-like SED at a redshift of all the way to radio wavelengths (this is one of only two of our EMNOs also having a radio detection) making this source a good candidate for a high-redshift Arp220 ULIRG clone. For EMNO-5 the secondary redshift solution had a confidence level that was lower by a factor of ten than the confidence level of the primary solution.
For the four objects with no optical detections we selected the most ’conservative’ redshift and SED combination (i.e. starting from low-redshift M82 SEDs) fitting the optical and FIR upper limits when normalized in the -band. Three HR10 SEDs and one M82-type SED were fitted, i.e. all highly reddened starbursts at (Table 1). With our current data we can conservatively estimate our photometric redshifts to be accurate within with a higher confidence given to the objects with HYPERZ fits than the ones with only SED fits.
Interestingly, however, the FIR (and radio) upper limits of most red EMNOs rule out an Arp220 SED, which otherwise would explain most or all of the observed MIR radiation. This is very similar to the recent Haas et al. (Ha04 (2004)) findings where sources selected by high ratio have low , indicative of AGN. Our SEDs are clearly suggestive of hotter dust as well, as seen from the overplotted appropriately redshifted and arbitrarily normalized nuclear SED of the well-known Sy-2 NGC1068 (Fig. 3, thick line). EMNO-6 has additionally been overplotted with an example of Treister et al. (Tr04 (2004)) obscured AGN model with and , which fits the red EMNOs, with the exception of EMNO-5, remarkably well. In general, the higher the MIR/NIR ratio is, the more likely and dominating the AGN component will be, as already suggested above in Section 2. For example, in the sample of Prouton et al. (Pr04 (2004)), the only ULIRG that would be classified as an EMNO is their only one where close to % of the IR luminosity is provided by the AGN component.
We do note that extreme starformation alone in obscured very young starburst regions can also produce steep MIR SEDs without yet contradicting FIR upper limits (Takeuchi et al. Ta03 (2003)). At the red EMNOs would truly need to be massive primeval galaxies undergoing their very first starburst, and we find the AGN contribution option to be the more conservative one.
The blue EMNOs have optical colours of a less extincted younger stellar population. The overplotted SEDs are those of starforming GRASIL spirals (Table 1), which appear to need large contributions to MIR flux from obscured central engines. Accordingly, EMNO-9 is a spectroscopically confirmed () moderately reddened QSO with very large X-ray absorbtion (; Willott et al. Wi03 (2003); object N2_25 therein). All of our other EMNOs unfortunately fall out of the X-ray coverage of ELAIS, but the optical to MIR characteristics of EMNO-7, with a photometric redshift of (HYPERZ errors, -band not used since there is likely AGN contribution), look very much like that of EMNO-9.
EMNO-8 is a peculiar case, with a spectroscopic redshift of only , making its luminosity lower than the other EMNOs by two orders of magnitude. Optical and NIR sizes indicate a dwarf, kpc. Interestingly, its SED follows well that of SBS 0335-052 (Dale et al. Da01 (2001)) an extremely metal poor dwarf galaxy, whose surprisingly strong mid-IR flux is interpreted to result from hot dust heated in an extremely intense interstellar radiation field around a few Myr old starforming region. Our EMNO-8 is approximately 10 times more luminous, and whether its properties are a scaled up version of SBS 0335-052 or whether there is some AGN activity involved, remains to be studied. Puzzlingly, the ELAIS Band-Merged Catalogue (Rowan-Robinson et al. Row04 (2004)) does not mention any signs of starburst or AGN signatures in its optical spectrum. Finally, we note that an ERO is just within the error circle of the ISOCAM position – if it were the true counterpart, the SED and interpretation would be identical to the red EMNOs.

4.3 Star-formation rates
Due to their extreme nature, star-formation rates (SFR) based on indicators used in the literature cannot be confidently applied to our EMNOs. The following should therefore be regarded as an attempt to obtain indicative levels of SFR for the EMNOs. First, total IR luminosity is calculated from the best fit GRASIL SEDs of each object and by scaling the SED to observed -band luminosity. Following Mann et al. (Ma02 (2002)) we then derive . These are the and SFR values listed in Table 1. SFRs using SEDs of M82 and Arp220 bracket values of .
Similarly, normal late type spiral SEDs approximately fitting the blue EMNOs result in SFRs of the order of for the high redshift ones, and for EMNO-8.
Had we scaled the model SEDs to the detected ISOCAM fluxes, the SFRs would have been higher by factors of 2–5. Similarly, if we directly used the 15m flux as a SFR indicator as calibrated by Elbaz et al. (2002a , see their Fig. 5), our red EMNOs would have very large SFR values at a level of 5000 , and the high- blue EMNOs 3–5 times higher than these. This estimate is of course incorrect if, as suggested by the SED shapes, most of the 15 m flux density comes from AGN related hot dust emission rather than from star formation. However, the more conservative values obtained above might not be any more accurate, EMNOs being very extreme objects with regard to their SED shape in the near to mid-IR.
Finally, it is important to note that also fully evolved ellipticals at 1–2 satisfy very well our optical-NIR colour limits. In this case all the mid-IR flux would have to be obscured AGN originated – to illustrate this, the SEDs of EMNOs 1 and 6 are overplotted (dashed lines) with a GRASIL elliptical, and AGN+elliptical model from Treister et al. (Tr04 (2004)), respectively. Nearly all red EMNOs are consistent with this old elliptical host + AGN possibility, and thus the SFR lower limit for 5 out of 6 of these is essentially zero. From the elliptical GRASIL model we estimate that if the -band light of the red EMNOs is assumed to be totally of stellar origin, their stellar masses are of the order of 0.5-1, implying black hole masses of (Marconi & Hunt Ma03 (2003)).
4.4 Number counts and contribution to the extragalactic background
Proper number densities cannot be derived because of a targeted and discontinuous survey area. However, we estimate a definite lower limit on the number of mid-IR selected EMNOs in the following way. In our IRTF follow-up 12 ISO sources (with 1–3 mJy) were observed, 6 of which were EMNOs (and 3 of which red EMNOs). The ISO sources were selected because of their faint or non-existent counterparts in DSS, thus obviously biasing us to large MIR to optical-NIR flux ratios. These ISOCAM sources were spread around an area of 0.15 deg2, which altogether contains 30 m sources in the range 1–3 mJy, including the ones observed. Thus, assuming that none of the non-observed MIR sources are EMNOs, EMNOs make up 20% of all m sources at mJy. If the targeted 12 sources are representative, on the other hand, the EMNO fraction could be even 50%. In contrast, less than 1% of the general ELAIS catalogue sources (all fluxes) are EMNOs (Fig. 1). In the selected deeper (in MIR) ISO surveys (Fig. 1), % of the sources are EMNOs – however, these surveys have widely varying depths of NIR coverage.
In terms of total flux density, all the ISOCAM sources brighter than 1 mJy (excluding a bright star) in the IRTF survey area amount to , i.e. 10% of the total CIRB at 15 m, according to Elbaz et al. (2002a ), totally consistent with values therein. EMNOs contribute 22% of the flux of all the ISOCAM sources in the area, which thus is the minimum EMNO contribution to CIRB at this flux level. As above, if the 6 EMNOs on the other hand were representative of the area, up to half of the CIRB is contributed by EMNOs. Fadda et al. (Fa02 (2002)) find a % contribution by AGN to MIR background at these flux levels. As we have argued, EMNOs are likely to be dominated by AGN activity. Assuming full EMNO/AGN correspondence, our value for AGN contribution is thus consistent with theirs. If the fraction of CIRB contribution using our method turns out to be larger, up to 50% as is possible, this could suggest that X-ray surveys are indeed missing the most obscured AGN, and MIR surveys could help in this regard (see e.g. Haas et al. Ha04 (2004); Gandhi & Fabian Ga03 (2003)); Compton thick AGN would be obscured even in hard X-rays while their nuclear SED in NIR-MIR should still have EMNO characteristics. At the moment we cannot check this speculation because of lacking X-ray observations of the sources.
5 Conclusions
We have presented a population of sources characterized by very strong MIR flux compared to their optical and NIR properties. The sources have been dubbed EMNOs, and are argued to host an obscured AGN based on: i) Their spectral shape in the near to far-IR region which shows a high MIR/NIR flux ratio and in most cases a low FIR/MIR ratio. ii) The high-redshift spectroscopically confirmed EMNO is shown to be a heavily obscured quasar by X-ray data (others do not have X-ray coverage). iii) All the objects found from several other ISO surveys which satisfy our EMNO criterion are very hard X-ray sources suggesting obscured AGN.
Those of our EMNOs which are red in their optical-NIR colours are well understood as (ultra)luminous dusty galaxies based on their SEDs and photometric redshifts. Their mid-IR flux density is not explained, however, without a dominant fraction of AGN activity. Moreover, at least for 4 out of 6 of these cases are also consistent with passive early type galaxy SEDs, in which case all the mid and far-IR radiation would be AGN produced.
The blue EMNOs appear to be higher redshift obscured quasars, according to the one spectroscopically confirmed case. However, their optical to FIR broadband colours appear to be very similar to low redshift extreme starbursting dwarfs, based on the similarity of our EMNO-8 and the well-studied metal-poor dwarf SBS 0335-052. Spectra, or x-ray and radio data are needed to study this degeneracy further.
EMNOs contribute 20–50% of the extragalactic source counts and cosmic IR background radiation at the 1 mJy level. If further observations show them to be dominated by AGN, as we suspect, it could mean that a significant fraction of AGN activity is missed by X-ray surveys.
We predict that the EMNO criterion will be very useful in selecting obscured AGN and sources with extremely strong starformation, but also in disentangling the AGN from starbursts since the MIR/NIR flux ratio is larger for the AGN with appropriately selected bands. Spitzer surveys using IRAC and MIPS bands (such as SWIRE; Lonsdale et al. Lo03 (2003)) are expected to detect large numbers of EMNOs. The inclusion of MIPS 70m data will be particularly useful in constraining the AGN/starburst fraction in EMNOs and generally in better classifying this new population.
Acknowledgements.
We thankfully acknowledge the work done by the ELAIS collaboration and ISO science centre in bringing together the ELAIS products. We wish to warmly thank Alberto Franceschini, Gian Luigi Granato, Laura Silva, Poshak Gandhi, and Valentin D. Ivanov for good suggestions and discussion, as well as the referee for very constructive remarks. We also thank Granato and Silva, and Ezekiel Treister for providing their models.References
- (1) Alonso-Herrero, A., Quillen, A.C., Rieke, G.H., Ivanov, V.D., Efstathiou, A. 2003, AJ, 126, 81
- (2) Aussel, H., Cesarsky, C., Elbaz, D., Starck, J.L. 1999, A&A, 342, 313
- (3) Bolzonella, M., Miralles, J.-M., Pelló, R., 2000 A&A, 363, 476
- (4) Bruzual, G. & Charlot, S. 1993 ApJ, 405, 538.
- (5) Charmandaris, V., Laurent, O., Le Floc’h, E., et al. 2002, A&A, 391, 429
- (6) Chary, R., Casertano, S., Dickinson, M.E., et al. 2004, ApJS, in press (astro-ph/0406386)
- (7) Dale, D.A., Helou, G., Neugebauer, G., et al. 2001, AJ, 122, 1736
- (8) Elbaz, D., Cesarsky, C., Chanial, P., et al. 2002a, A&A, 384, 848
- (9) Elbaz, D., Flores, H., Chanial, P., et al. 2002b, A&A, 381, L1
- (10) Elbaz, D. & Cesarsky, C. 2003, Science, 300, 270
- (11) Elston, R., Rieke, G.H. & Rieke, M.J. 1988, ApJ, 331, L77.
- (12) Fadda, D., Flores, H., Hasinger, G., et al. 2002, A&A, 383, 838
- (13) Farrah, D., Afonso, J., Efstathiou, A., et al. 2003, MNRAS, 343, 585
- (14) Flores, H., Hammer, F., Thuan, T.X., et al. 1999, 517, 148
- (15) Franceschini, A., Aussel, H., Cesarsky, C.J., Elbaz, D., Fadda, D. 2001, A&A, 378, 1
- (16) Franceschini, A., Fadda, D., Cesarsky, C.J., 2002, ApJ, 568, 470
- (17) Gandhi, P., Fabian, A.C. 2003, MNRAS, 339, 1095
- (18) Gonzalez-Solares, E.A., Perez-Fournon, I., Rowan-Robinson, M. et al. 2004, MNRAS, submitted (astro-ph/0402406)
- (19) Granato, G.L., De Zotti, G., Silva, L., Bressan, A., Danese, L. 2004, ApJ, 600, 580
- (20) Haas, M., Klaas, U., Müller, S.A.H., et al. 2003, A&A, 402, 87
- (21) Haas, M., Siebenmorgen, R., Leipski, C., et al. 2004, A&A, in press (astro-ph/0404306)
- (22) La Franca, F., Gruppioni, C., Matute, I., et al. 2004, AJ, 127, 3075
- (23) Le Floc’h, E., Péréz-Gonzáles, P.G., Rieke, G.H., et al. 2004, ApJS, in press (astro-ph/0406148)
- (24) Lonsdale, C., Smith, H.E., Rowan-Robinson, M., et al. 2003, PASP, 115, 897
- (25) Lonsdale, C., Polletta, M.C., Surace, J., et al. 2004, ApJS, in press (astro-ph/0406209)
- (26) Mann, R.G, Oliver, S., Carballo, R., et al. 2002, MNRAS, 332, 549
- (27) Marconi, A., Hunt, L.K. 2003, ApJ, 589, L21
- (28) McMahon, R.G., Walton, N.A., Irwin, M.J. et al. 2001, NewAR, 45, 97
- (29) Oliver, S., Rowan-Robinson, M., Alexander, D., et al. 2000, MNRAS, 316, 749
- (30) Pierre, M., Lidman, C., Hunstead, R., et al. 2001, A&A, 372, L45
- (31) Pozzi, F., Ciliegi, P., Gruppioni, C., et al. 2003, MNRAS, 343, 1348
- (32) Prouton, O.R., Bressan, A., Clemens, M., et al. 2004, A&A, in press (astro-ph/0403581)
- (33) Rowan-Robinson, M., Lari, C., Perez-Fournon, I., et al., 2004, MNRAS, in press (astro-ph/0308283)
- (34) Serjeant, S., Farrah, D., Geach, J., et al. 2003, MNRAS, 364, L51
- (35) Silva, L., Granato, G.L., Bressan, A., Danese, L. 1998, ApJ, 509, 103
- (36) Silva, L., Maiolino, R., Granato, G.L. 2004, MNRAS, submitted (astro-ph/0403381)
- (37) Smith, G.P., Treu, T., Ellis, R. et al., 2001, ApJ, 562, 635
- (38) Takeuchi, T.T., Hirashita, H., Ishii, T.T., Hunt, L. K., Ferrera, A. 2003, MNRAS, 343, 839
- (39) Treister, E., Urry, C.M., Chatzichristou, E., et al. 2004, ApJ, submitted
- (40) Vaccari, M., Lari, C., Angeretti, L., et al. 2004, MNRAS, submitted (astro-ph/0404315)
- (41) Väisänen, P., Johansson, P.H., 2004a, A&A, 421, 821
- (42) Väisänen, P., Johansson, P.H., 2004b, A&A, 422, 453
- (43) Väisänen, P., Morel, T., Rowan-Robinson, M., et al. 2002, MNRAS, 337, 1043
- (44) Werner, M., Roellig, T., Low, F., 2004, ApJS, in press (astro-ph/0406223)
- (45) Willott, C.J., Simpson, C., Almaini, O., et al. 2003, MNRAS, 339, 397
- (46) Yan, L., Choi, P.I., Fadda, D., et al. 2004, ApJS, in press (astro-ph/0405634)