A multi-wavelength search for a counterpart of the unidentified -ray source 3EG J2020+4017 (2CG078+2)
Abstract
In search of the counterpart to the brightest unidentified gamma-ray source 3EG J2020+4017 (2CG078+2) we report on new X-ray and radio observations of the -Cygni field with the Chandra X-ray Observatory and with the Green Bank Telescope (GBT). We also report on reanalysis of archival ROSAT data. With Chandra it became possible for the first time to measure the position of the putative gamma-ray counterpart RX J2020.2+4026 with sub-arcsec accuracy and to deduce its X-ray spectral characteristics. These observations demonstrate that RX J2020.2+4026 is associated with a K field star and therefore is unlikely to be the counterpart of the bright gamma-ray source 2CG078+2 in the SNR G78.2+2.1 as had been previously suggested. The Chandra observation detected 37 additional X-ray sources which were correlated with catalogs of optical and infrared data. Subsequent GBT radio observations covered the complete 99% EGRET likelihood contour of 3EG J2020+4017 with a sensitivity limit of which is lower than most of the recent deep radio search limits. If there is a pulsar operating in 3EG J2020+4017, this sensitivity limit suggests that the pulsar either does not produce significant amounts of radio emission or that its geometry is such that the radio beam does not intersect with the line of sight. Finally, reanalysis of archival ROSAT data leads to a flux upper limit of for a putative point-like X-ray source located within the 68% confidence contour of 3EG J2020+4017. Adopting the SNR age of 5400 yrs and assuming a spin-down to X-ray energy conversion factor of this upper limit constrains the parameters of a putative neutron star as a counterpart for 3EG J2020+4017 to be , and G.
1 Introduction
The error boxes of unidentified gamma-ray sources are usually large, and thus the task of finding appropriate candidate counterparts at other wavelengths has not been easy. About 20 bright point-like gamma-ray sources were found near the Galactic plane using COS-B (Swanenburg et al. 1981) some of which may be concentrations of molecular hydrogen (Mayer-Hasselwander & Simpson 1990). Another few, such as the Crab and Vela pulsars, were identified based on their periodic emission (Thompson et al. 1975). The nature of the other objects remained unknown.
The much more sensitive EGRET telescope on the Compton Gamma-Ray Observatory (CGRO) was expected to contribute decisively to the identification of the COS-B sources. And indeed, the higher count rates and tighter source locations provided by EGRET confirmed the existence of most of the COS-B sources and led to the identification of several other sources. Most prominent were the gamma-ray pulsars Geminga and PSR B1706–44 which could be identified on the basis of detections at X-ray and radio wavelengths (see e.g. Kanbach 2002 and Becker & Pavlov 2001 for a review and references). At high Galactic latitudes about 90 new high-energy sources could be correlated with blazars. The final EGRET catalog of gamma-ray sources lists 271 objects (Hartman et al. 1999) of which about 170 are unidentified. Their distribution suggests that most of them are Galactic. The origin and nature of this population of extremely energetic objects is clearly of interest.
Seven of the Galactic gamma-ray sources are rotation-powered pulsars, identified through the periodic modulation of their gamma-ray fluxes. These seven are also persistent, point-like sources at gamma-ray energies. In the 100 MeV – 1 GeV energy range, these sources have hard, power-law-like spectra with high-energy cut-offs at a few GeV. Although rotation-powered pulsars are best known as radio sources, this is not true for all — Geminga, for example, shows at best marginal evidence of pulsed radio emission (Kuzmin & Losovkii 1997). Geminga is thus taken as the prototype of a ‘radio-quiet’ gamma-ray pulsar of which many more should exist in the Galaxy. Although Geminga’s gamma-ray luminosity is rather low (its small distance of about 160 pc makes it a bright source) the property of radio faintness could be indicative of pulsar emission where the beamed radiation at different wavelengths is emitted into widely different directions. Such a model may be applicable to young, high luminosity pulsars as well (Yadigaroglu & Romani 1995). There are other models to explain Geminga’s radio faintness though (e.g. Gil et al. 1998).
A review of the spectra of unidentified low Galactic latitude EGRET sources (Bertsch et al. 2000; Merck et al. 1996) shows that about 10 objects exhibit the very hard power-law type spectra with a cut-off at several GeV as seen also in the identified pulsars. These objects would be prime targets for identification efforts at other wavelengths. Relatively deep radio searches (at 770 MHz) at the positions of several of these sources have not found radio counterparts (Nice & Sayer 1997). Population studies of the unidentified gamma-ray sources close to the Galactic plane indicate that their luminosities are also quite compatible with the luminosities of the younger identified pulsars (Kanbach et al. 1996). Suggestions, other than pulsars, for the nature of these gamma-ray sources have also been widely discussed. Energetic objects, like massive young stars or OB associations and SNRs have been correlated with the 3EG catalog (e.g. Romero et al. 2000) and certainly indicate a close relationship with the gamma-ray sources.
Multi-wavelength observations focusing on promising candidate sources have been quite successful in recent years. Observations in X-rays have been useful: e.g. in the cases of 3EG J20062321 = PMN20052310 (Wallace et al. 2002) and 3EG J2016+3657 = B2013+370 (Halpern et al. 2001a). New pulsar/isolated neutron star identifications were reported, e.g. 3EG J2227+6122 (Halpern et al. 2001b) by discovery of the characteristic pulsar period of RX/AX J2229.0+6114. X-ray observations were used to relate the high Galactic latitude source 3EG J1835+5918 to an isolated neutron star, RX J1836.2+5925 (Reimer et al. 2001; Mirabal & Halpern 2001; Halpern et al. 2002).
With the wealth of incoming discoveries from the Parkes multi-beam pulsar survey, promising associations between newly discovered radio pulsars and EGRET sources have also been discussed. These associations include the two young pulsars PSR J1420–6048 and PSR J1837–0604 (D’Amico et al. 2001) in the vicinity of 3EG J1420–6038 and 3EG J1837–0606, respectively; PSR J1016–5857 near the SNR G284.3–1.8 is a plausible counterpart for 3EG J1013–5915 (Camilo et al. 2001). In a recent survey of 56 unidentified EGRET sources Roberts et al. (2004) found a radio pulsar located inside the 95% likelihood map in six of the investigated gamma-ray sources. The discovery of PSR J2021+3651 in the error box of GeV 2020+3658 using the 305m Arecibo radio telescope is another positive example (Roberts et al. 2002; 2004; Hessels et al. 2004). However, Torres, Butt & Camilo (2001), and more recently Kramer et al. (2003), who have summarized the observational status of the radio pulsars and EGRET-detected gamma-ray sources concluded that, in many cases, further multi-frequency investigations are required in order to conclusively translate a proposed association into a final source identification.
3EG J2020+4017 is among the brightest persistent sources in the EGRET sky. Originally listed as a COS-B source (2CG) it is still unidentified. Its gamma-ray flux is consistent with constant flux (Hartman et al. 1999), and the spectrum is hard and best described by a power-law with photon-index of . Merck et al. (1996) found evidence for a spectral break at GeV which has been confirmed in recent studies by Bertsch et al. (2000) and Reimer & Bertsch (2001).
Examining all archival EGRET data and using photons GeV, Brazier et al. (1996) found a best position at , with a 95%-confidence error box. This position was consistent with the 2EG catalog position and placed the EGRET source within the -Cygni supernova remnant G78.2+2.1.
The remnant G78.2+2.1 consists of a -diameter, circular radio shell with two bright, broad opposing arcs on its rim (Higgs, Landecker & Roger 1977; Wendker, Higgs & Landecker 1991). G78.2+2.1 has a kinematic distance of kpc (Landecker, Roger & Higgs 1980; Green 1989) and is estimated to have an age of 5400 yr (Sturner & Dermer 1995). A very bright star, -Cygni (, spectral type F8Iab) lies on the eastern edge and lends its name to the remnant. A small Hii region, located close to the star, forms the so-called -Cygni nebula.
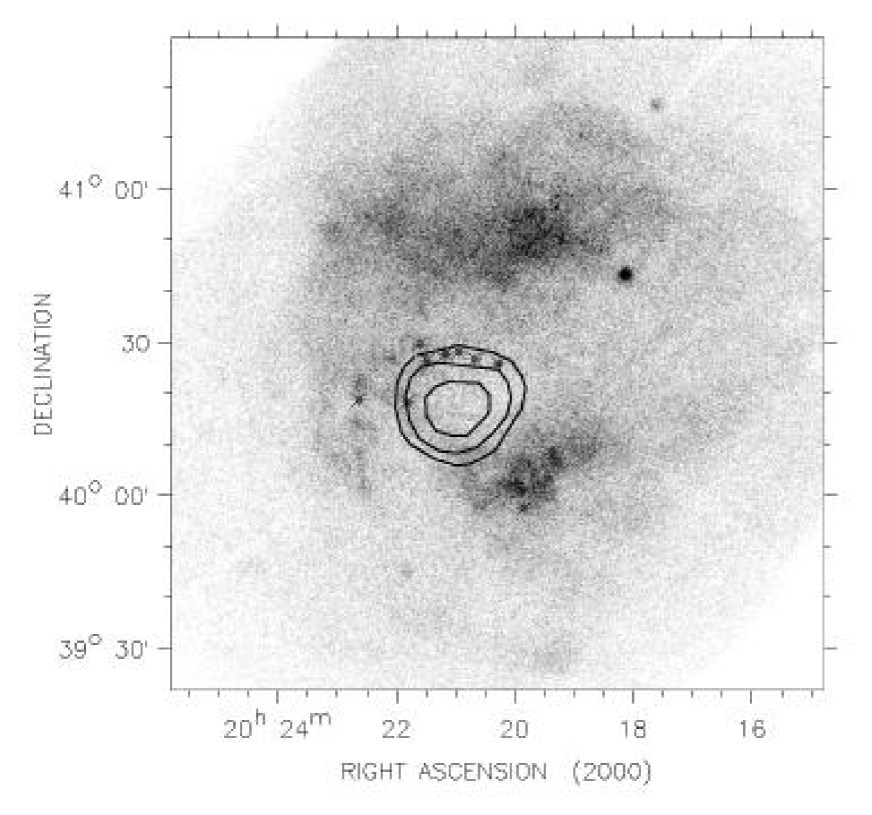
Brazier et al. (1996) analyzed ROSAT PSPC data viewing the -Cygni region. Six PSPC observations were targeted at celestial positions within 40 arcmin of the EGRET source. These ROSAT observations are combined and shown in Figure 1. The point source RX J2020.2+4026 is located within the 95% confidence contour of the 2EG position of 2CG078+2 (Brazier et al. 1996), and was suggested by these authors to be the X-ray counterpart to the gamma-ray source. Brazier et al. (1996) and Carraminana et al. (2000) provided a possible optical counterpart for RX J2020.2+4026. Optical follow-up observations revealed a 14.5 magnitude K0V star nearby and within the ROSAT error circle. The X-ray to optical flux ratio of this star was found to be marginally consistent with that found for late-type stars (Stocke et al. 1991; Fleming et al. 1995), so that an association of RX J2020.2+4026 with the gamma-ray source could not be excluded (Brazier et al. 1996).
With the 3EG catalog (Hartman et al. 1999), an improved position of 2CG078+2 became available: , , i.e. shifted in right ascension and declination by a few arc-minutes with respect to the 2EG position used by Brazier et al. (1996). With this improved position the proposed counterpart RX J2020.2+4026 is no longer located within the 95% contour of 3EG J2020+4017. The 99% likelihood contour, however, still includes RX J2020.2+4026 (Figure 1).
In this paper we report on follow-up studies of RX J2020.2+4026 with Chandra and the Green Bank Radio Telescope. The Chandra observations were taken with the aim to determine the position and spectrum of RX J2020.2+4026 with high precision and to explore the possible connection with 3EG J2020+4017. GBT observations at 820 MHz were made in order to search the EGRET error box of 3EG J2020+4017 for a young radio pulsar.
2 Chandra Observations and Data Analysis
Our 30 ksec Chandra observation (ObsID 3856) was taken on 2003 January 26 using three Advanced CCD Imaging Spectrometer (ACIS) CCDs (S2,3,4) in the faint, timed-exposure mode with a frame time of 3.141 s. Standard Chandra X-ray Center (CXC) processing (v.6.8.0) has applied aspect corrections and compensated for spacecraft dither. Level 2 event lists were used in our analyses. Events in pulse invariant channels corresponding to 0.5 to 8.0 keV were selected for the purpose of finding sources on S2 and S4 (after destreaking). The energy range 0.25 to 8.0 keV was utilized for source finding with S3. Due to uncertainties in the low energy response, data in the range 0.5 to 8.0 keV were used for spectral analysis. There were no instances of increased background.
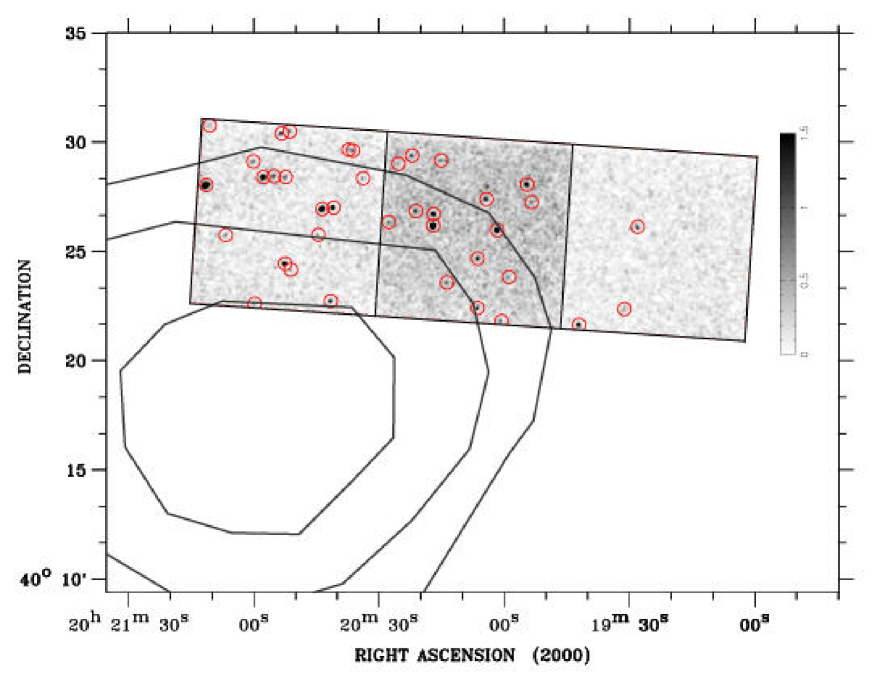
The center position used for the Chandra pointing was that of the ROSAT source RXJ2020.2+4026, at and . The ACIS image overlaid with the 3EG likelihood contour lines of 3EG J2020+4017 is shown in Figure 2. The positions of RX J2020.2+4026 and 37 other X-ray sources detected by Chandra are also indicated. RX J2020.2+4026 still appears to be the brightest X-ray source in the field.
2.1 Image Analysis
We used the same source finding techniques as described in Swartz et al. (2003) with the circular-Gaussian approximation to the point spread function, and a minimum signal-to-noise ratio (S/N) of 2.6, expected to result in much less than 1 accidental detection in the field. The corresponding background-subtracted point source detection limit is 10 counts. Nineteen sources were found on the S2 chip, 16 on S3, and three on the S4 CCD.
Table 1 lists the 38 X-ray sources. To simplify the discussion and to show the CCD in which a source was detected (the S2,4 and S3 chips have different sensitivities) sources are denoted as SXYY with X=2,3,4 indicating the CCD and YY=01,02,03…indicating the ordering in RA.
Table 1 gives the source positions, the associated uncertainty in these positions, and the signal-to-noise ratio. The positional uncertainty listed in column 7 is given by where is the size of the circular Gaussian that approximately matches the point-spread function (PSF) at the source location, is the vignetting-corrected number of source counts, and represents the systematic error. The factor 1.51 sets the radius to that which encloses 68% of the circular Gaussian. The Table also lists potential counterparts in either the United States Naval Observatory Catalog (USNO-B1.0; Monet et al. 2003), the Two Micron All Sky Survey (2MASS), or the various ROSAT catalogs. With the exception of the target source, ROSAT sources were listed if their position was within of the Chandra position. Uncertainties in the plate scale111See http://asc.harvard.edu/cal/Hrma/optaxis/platescale/ imply a systematic uncertainty of , and, given the differences in the USNO and 2MASS and CXO positions, we have used as a conservative estimate for .
The non-X-ray candidate counterparts were selected by searching a circular region centered on the X-ray position and whose radius was the 99%-confidence radius (3.03/1.51 times the positional uncertainty listed in column 7) continuing the assumption that the point-spread function is described by a circular Gaussian. We do recognize, of course, that the assumption is not accurate far off-axis, however, this is partially compensated in that there is a good deal of conservatism built into the definition of the positional uncertainty and by the fact that there is very little impact on the position centroid.
As a further check on our estimate of the systematic error in the correlation of the X-ray and optical positions a position-error weighted least squares fit was performed. Right ascension, declination, and roll angle of the pointing position were taken as free parameters of this fit. The uncertainties in the optical positions were taken from the USNO-B1.0 catalog. The uncertainty in the X-ray position was that discussed previously, including the systematic uncertainty . There are 26 optical candidates selecting only one of the two possible counterparts to S401. The fit was excellent ( of 55 for 52 degrees of freedom), independent of which candidate was associated with S401. The fitted quantities for right ascension, declination, and roll angle were , and , respectively. Considering that we have ignored any possible systematic errors in the non-X-ray positions, such as those due to proper motion, we feel that applying this offset is unjustified.
2.2 Optical and Infrared Counterparts
The BROWSE222See http://heasarc.gsfc.nasa.gov/db-perl/W3Browse/w3browse.pl. feature was used to search for cataloged objects at or near the X-ray positions listed in Table 1. All available BROWSE catalogs were selected to be interrogated and the 99%-confidence region around the X-ray sources were searched for possible counterparts.
2.2.1 USNO-B1.0
There are 3387 USNO-B1.0 sources in a radius centered on the X-ray pointing direction. To the extent that these are uniformly distributed there are and this density was used to calculate the expected average number of accidental coincidences listed in column 4 of Table 2. The probability of getting one or more matches by chance is given by the Poisson probability which for small values is approximately . These probabilities are always below 7% and most (20 of 26) below 2%. The separation between the X-ray source and the optical source is listed in the 8th column of Table 1. The position of the candidate optical counterpart is also listed in Table 2. There are two optical candidate counterparts for S401.
The position of the source S312 is found to match that of the optical K0V-star which has a USNO-B1.0 position of and .
2.2.2 2MASS
There are 5061 2MASS sources in the radius circle centered on the pointing position and the inferred density was used to calculate the probability of an accidental coincidence that is listed in column 7 of Table 2. The probabilities are always below 12% and about half of them are below 2%. Other pertinent information concerning the potential infrared counterparts is listed in Tables 1 and 2. In Table 2 we have also listed, where relevant, the separation between the optical and the infrared candidate counterparts. In all cases but S209, these separations are sub-arcsecond, implying, apart from the exception, that the optical and the infrared sources are the same.
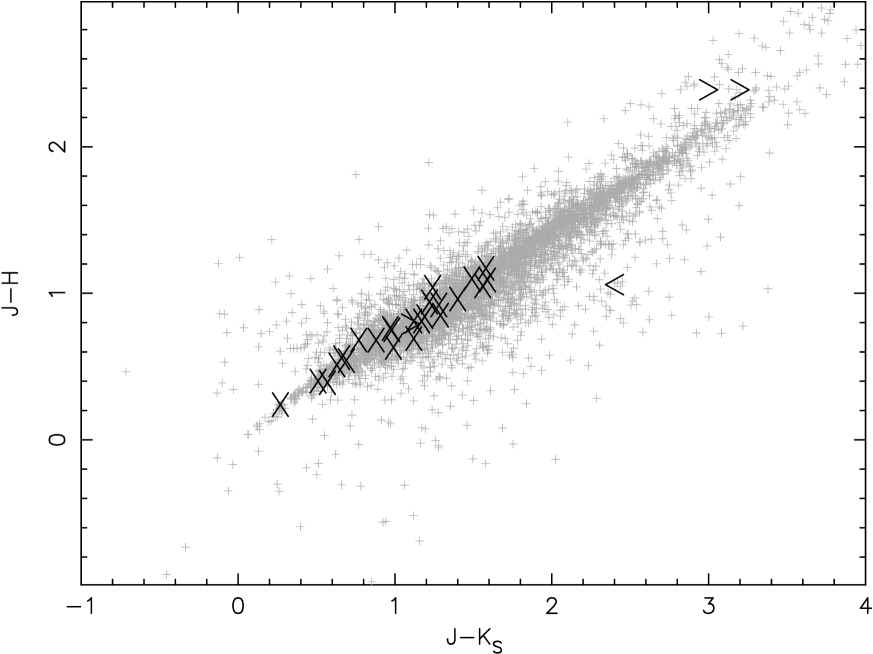
Table 3 shows the magnitudes and colors of the 2MASS counterparts. Figure 3 shows the colors of all of the 2MASS sources in a 12-arcmin radius circle centered on the pointing direction. With two possible exceptions, the inferred counterparts of the X-ray sources appear to be distributed as the field sources. Those that do not appear to be reddened have colors of moderately late-type stars. This is not surprising since the -Cygni field is close to the Galactic plane where approximately 90% of 2MASS sources are stars333 http://www.ipac.caltech.edu/2mass/releases/second/doc/. Although most Galactic-plane 2MASS objects are normal stars, the majority of objects identified with X-ray sources need not be stars. For example, the X-ray emission may arise from a compact companion. The distribution of the colors of the X-ray selected subset, however, seems to reproduce the distribution of the field objects. The two most reddened sources are S208 and S309 which have JK and thus may possibly be background sources (AGNs) absorbed by the Galactic column.
The position of the source S312 is found to match that of the optical K0V-star which has a 2MASS position of and .
2.3 Spectral Analysis
Point-source counts and spectra were extracted from within the radii listed in column 4 of Table 1. The background estimation was determined from creating data sets for each CCD after removing the events from each source region out to a radius 10 times the extraction radius listed in Table 1.
Only a few of the 38 detected sources have sufficient counts to warrant an attempt at an individual spectral analysis. In descending order of the number of detected counts, these are sources S312 (253 cts), S206 (213 cts), S219 (201 cts), S305 (176 cts), S214 (101 cts), and S204 (85 cts). All spectral analyses used CIAO 3.0.2 to extract the pulse invariant (PI) files and CXC CALDB 2.25 calibration files (gain maps, quantum efficiency uniformity and effective area) to generate the appropriate effective area and response functions. The spectral data were corrected for the effects of charge transfer inefficiency produced by proton damage to the front-illuminated CCDs early in the mission. Finally, we accounted for the impacts of molecular contamination on the ACIS filters with the number of days since launch set at 1275. For the absorbing column we used TBABS in XSPEC (v.11.2) with the default cross sections but with the abundances set to Wilms, Allen & McCray (2000). The data were binned with no less than 10 counts per spectral bin. All given errors on spectral parameters are extremes on the two interesting parameters at the 68% confidence range. As noted previously, spectral analysis were restricted to the energy range keV because of the large uncertainties in the ACIS spectral response at low energies.
2.3.1 Source S312 (RX J2020.2+4026)
Three spectral models were applied. The first model, an absorbed power law, resulted in a statistically excellent fit ( of 16.7 for 15 degrees of freedom) but with physically unreasonable parameters such as a very steep power law spectral index of 8.2.
The second model was the thermal, emission-line XSPEC model mekal. With (solar metallicity), we obtained an acceptable fit ( for 15 degrees of freedom) with , and keV. The 1 confidence ranges for the column absorption and temperature are and keV, respectively. The third model, a blackbody with and keV, provides an alternative statistically acceptable representation of the X-ray spectrum (Table 4). The spectrum and residuals of that fit are shown in Figure 4.
From the Hi in the Galaxy (Dickey & Lockman 1990) we compute the column absorption through the Galaxy in the direction to -Cygni to be . This is comparable with the column absorption of sources in -Cygni (Maeda et al. 1999; Uchiyama et al. 2002) and significantly higher than what is found from spectral fits of S312, suggesting that this source is a foreground object.
The low-column mekal spectrum together with the positional identification would appear to establish S312 (RX J2020.2+4026) as the X-ray counterpart to the K0V-star, invalidating its association with the unidentified EGRET source 3EG J2020+4017. This conclusion is bolstered by considering the upper limit to the X-ray luminosity of which we obtained from the X-ray flux of and the distance upper limit of pc. The latter was derived from the star’s spectral type K0 (Brazier et al. 1996) and distance modulus. We note that the luminosity is slightly high suggesting the star is rotating “rapidly” which is mildly inconsistent with the optical spectra.
2.3.2 The other “bright” sources
As with S312 (RX J2020.2+4026) we binned the data to assure at least 10 counts per spectral bin and fit the data for the other relatively bright sources to the absorbed power law, mekal and blackbody models. The results are summarized in Table 4.
S206
About 213 source counts were detected from this source. The data clearly favor the power law spectrum with a photon-index in the 68% confidence range .
S219
This source is detected with 201 source counts near to the edge of the S2 CCD and was seen by ROSAT (1RXH J202111+402807). In contrast to S206, a more complicated spectrum is called for. We tried to fit the data with a two-temperature mekal model (not unusual for stars) which did provide a good fit ( on 14 degrees of freedom). The two best-fit temperatures were 0.2 and 24 keV with the highly uncertain higher temperature component providing only 3% of the total flux. The best-fit absorbing column was .
S305
Similar to S312, all three spectral models provided statistically adequate fits to the spectral data. In this case, however, it is not valid to argue that the power law index is unphysical.
S214 & S204
None of the three model spectral fits are acceptable (as with S219), however, with only a total of seven and five bins of spectral data respectively, it would not be surprising to be able to fit these data with a more complicated model. Both sources have both USNO-B1.0 and 2MASS counterparts.
For the remaining 32 sources, all with fewer than 69 detected source counts, no spectral fitting was attempted. These sources were, however, included in the X-ray color-color diagrams presented in the following section.
2.3.3 X-ray color-color relation
We show two X-ray “color-color” diagrams in Figures 5 and 6. Because of differences in the spectral responses, the data were separated between back- and front-illuminated CCDs, the back-illuminated CCDs being somewhat more sensitive to low energy X-rays. Clearly, since most of these sources were detected with a small number of total counts, the uncertainties are large and it is difficult to draw any firm conclusions. Thus the figures are primarily included for completeness. We note that the hardest sources (S203, S302, S313, S316), those that occupy the upper-right portions of the diagrams, are among those with no USNO and/or 2MASS counterparts and these may be background sources (AGN) absorbed by the Galactic column. The very soft and unabsorbed sources (S315, S219, S403, S207, S210, S217) are likely to be associated with foreground stars and all have optical and infrared candidate counterparts. The infrared colors (Table 3) of all of these objects, except for the candidate counterpart to S219, are those expected for evolved main sequence (primarily K) stars. The counterpart to S219 would have to be a giant or supergiant.
2.4 Time Variability
The paucity of detected counts for the X-ray sources limit the ability to draw many conclusions from the time series. In one case however, S206, the source was quiescent for most of the observation and then suddenly flared as shown in Figure 7. There is also, less compelling, evidence that S219 flared. The flaring nature of S206 and a 2MASS counterpart are all consistent with coronal emission from a star.
2.5 Re-analysis of Archival ROSAT Data
We have re-analyzed the archival ROSAT PSPC data used by Brazier et al. (1996). Source detection algorithms (box car as well as maximum likelihood) found many sources, most of which appear to be associated with the diffuse emission of the remnant G78.2+2.1 as neither of these methods is ideally suited for searching for point sources embedded in extended sources (i.e. patchy background). The X-ray source RX J2020.2+4026 seen by Brazier et al. (1996) was the only point source detected. No other point source was found within the 3EG J2020+4017 error box. Using these data we can thus set a count rate upper limit of PSPC counts/s for a putative X-ray point source located within the region defined by the 68% confidence contour of 3EG J2020+4017. Assuming a power law spectrum with a photon index of two and a column absorption of (Dicky & Lockman 1990), the count rate upper limit corresponds to an energy flux upper limit of and , respectively. For a distance of 1.5 kpc this yields for the upper limit to the isotropic X-ray luminosity.
In addition to the ROSAT PSPC observations, there are four HRI data sets in the ROSAT archive which partly cover the 3EG J2020+4017 error box. These data were taken between 1994 and 1997 with varying exposure times from 10 ksec to 36.5 ksec, respectively, and were not considered in the analysis of Brazier et al. (1996). Table 5 list the observational details. A maximum-likelihood source-detection algorithm with a threshold of found six point sources in the data set 400899h, two in 202534h, one in 500339h and none in 202033h. The source properties are given in Table 6 and the positions are shown in Figure 1.
The region observed in the HRI observation 400899h mostly overlaps our Chandra observations. Of the six sources detected in this HRI observation, two new X-ray sources not seen by Chandra are detected; RX J202137.6+402959 and RX J202057.8+402829. Thus, these sources appear to be variable. The other four HRI sources detected are S214, S219, S204 and S312 (the last is the putative X-ray counterpart of 3EG J2020+4017 proposed by Brazier et al. 1996). Among the other three newly detected sources, only RX J202150.5+401837 is located within the 95% likelihood region for the position of 3EG J2020+4017. The other two sources are located far outside the 99% contour and cannot account for an X-ray counterpart of 3EG J2020+4017.
3 Radio Observations and Data Analysis
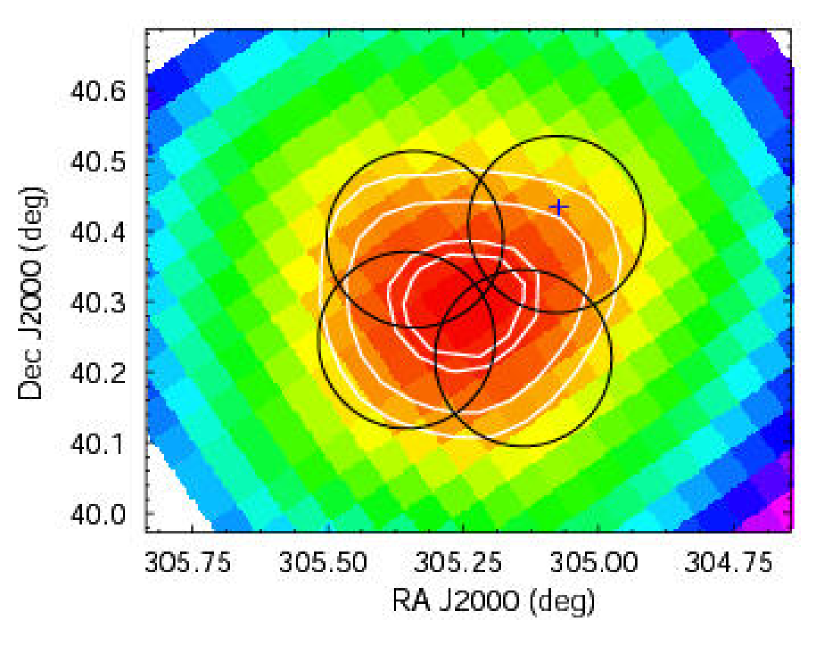
A deep search for radio pulsations from 2CG078+2 was carried out using the GBT on 2003 December 27. The observations were made at a center frequency of 820 MHz using an identical data acquisition and analysis scheme as that described by Camilo et al. (2002) in their detection of 65-ms radio pulsations from the pulsar in SNR 3C 58. Given the uncertain position of the putative pulsar, the observing time was divided into four separate pointings of the 15′ (FWHM) beam: one pointing was approximately centered on RX J2020.3+4026, and the remainder were arranged so as to cover much of the EGRET error region likely to contain the -ray source with 99% probability (Figure 8). Due to time constraints, dwell times of 4 hr for three of the pointings, and 3 hr for the fourth, were used. The pointings are summarized in Table 7. Data were acquired with the Berkeley Caltech Pulsar Machine (BCPM), an analog/digital filter bank (Backer et al. 1997) that divides the frequency band into 96 contiguous channels and samples the incoming voltages of the two orthogonal circular polarizations received by the telescope every 72 s. For these observations, the channel bandwidth was set to 0.5 MHz so that a total band of 48 MHz was recorded. After summing the polarizations, the resulting total-power time samples were written to disk with 4-bit precision for subsequent off-line processing. Known pulsars were successfully detected before and after the 2CG078+2 observations.
The data analysis was carried out at Jodrell Bank using standard Fourier-based pulsar search software routines (for full details, see Lorimer et al. 2000) which are freely available444http://www.jb.man.ac.uk/drl/seek. In order to reduce the volume of data, 12 (10) adjacent time samples were added together prior to dedispersion of the 4-hr (3-hr) observations. The resulting decimated time series had effective sampling times of 864 and 720 s. This choice of decimation was convenient for the periodicity search, which uses a base-two Fourier transform algorithm. For a -point Fourier transform, the effective integration times were 3.9 hr and 3.2 hr. The latter data were zero padded. Each observation was analyzed separately. The data were first dedispersed at 301 trial dispersion measure (DM) values between 0 and 300 cm-3 pc. The expected DM from the NE2001 electron density model (Cordes & Lazio 2002) for and is cm-3 pc, assuming a distance of 1.5 kpc (Landecker, Roger & Higgs 1980). The maximum DM in this direction is 350 cm-3 pc (Cordes & Lazio 2002). The resulting time series were then Fourier transformed and the amplitude spectra searched for significant features. To increase sensitivity to narrow duty-cycle pulses, individual spectra summing the first 2, 4, 8 and 16 harmonics were also searched. The resulting list of candidate signals above a S/N threshold of 6 were then folded in the time domain for visual inspection. No convincing pulsar-like signals were found.
Based on the known system parameters (Camilo et al. 2002) we estimate the sensitivity555We note that the radio limit which we have calculated are valid only at beam center. At the 15’-FWHM point, the sensitivity is estimated to be a factor of two lower. of our observations to be mJy at periods ms and DMs consistent with the 1.5 kpc distance. With a typical duty cycle , this yields Jy. For a distance of 1.5 kpc the 820-MHz luminosity limit is . For an assumed radio spectral index of (see e.g. Lorimer et al. 1995) the corresponding luminosity at 1400 MHz is which is lower than most of the recent deep radio search limits (see e.g. Camilo 2003). If there is a pulsar operating in 3EG J2020+4017, our sensitivity limit suggests that the pulsar either does not produce significant amounts of radio emission or that its geometry is such that the radio beam does not intersect with the line of sight.
4 Discussion and Summary
We have searched a portion of the -Cygni field for possible X-ray counterparts to the intriguing gamma-ray source 3EG J2020+4017 (2CG078+2) using Chandra and ROSAT. We have shown that a previous candidate, RX J2020.2+4026, is almost certainly not the gamma-ray source but identified with a normal star. This conclusion is based on the refined position of the X-ray source, its spectrum and coincidence with both optical and infrared sources and the inferred X-ray luminosity. Further, we have found a total of 38 X-ray sources in the Chandra S2-, S3- and S4-fields which covers only part of the much larger error box containing the location of the EGRET source. A re-analysis of archival ROSAT HRI data revealed three more X-ray sources within the EGRET error box which are not detected in the Chandra observations. Two of these sources are surely variable whereas the third source was found in a region not covered by the Chandra observation. We found that some of the Chandra sources have counterparts that may be main-sequence stars based on their identification with optical objects and 2MASS sources of normal colors. Of course the X-ray emission may not be due to the main sequence star, but can arise from an accreting compact companion. None of the X-ray sources appear to be radio pulsars, down to a limiting sensitivity of for an assumed pulse duty cycle of 4%. This limit also applies to the entire region associated with the 99%-confidence position contours of 3EG J2020+4017.
Determining an upper limit for a putative X-ray point source located within the 68% confidence contour of 3EG J2020+4017 using archival ROSAT PSPC data we found a luminosity upper limit of which is four times smaller than the ROSAT PSPC-deduced luminosity observed from the Vela pulsar (, e.g. Table 3 in Becker & Aschenbach 2002) but about four times higher than the total ROSAT observed X-ray luminosity from Geminga (). We therefore consider it as a valid option that the counterpart of 3EG J2020+4017 is a neutron star with an X-ray luminosity similar to that observed from Vela-like to middle-aged pulsars. An object with such luminosity would not have been detected in the X-ray data from ROSAT which cover that region of the sky. Adopting the SNR age of 5400 yrs and assuming a spin-down to X-ray energy conversion factor of (Becker & Trümper 1997) we are able to constrain the spin-parameters of such a putative neutron star to be , and G, which are consistent with the properties of known Vela- to middle-aged pulsars (e.g. Gonzalez & Safi-Harb 2003, Becker & Pavlov 2001), given the uncertainty of this approach. The ratio of the -ray to soft X-ray flux deduced from our upper limit, , is consistent with this conclusion.
In order to obtain a full census of the X-ray population in the error box of 3EG J2020+4017 further observations with Chandra are required. As the discovery of Geminga has taught us, deep follow-up optical observations of new X-ray sources can also lead to the identification of the nature of a high-energy source. Finally, the measurements we expect from the GLAST mission (launch 2007) should provide a much improved signal-to-noise ratio and a source location better than for this gamma-ray source. This will open the possibility to directly search for pulsar periodicities in the gamma-ray data. In case no pulsar is found, the restricted number of Chandra sources in the GLAST error box will then be prime candidates for even deeper searches for counterparts.
References
- (1) Backer, D.C., Dexter, M.R., Zepka, A., Ng, D., Werthimer, D.J., Ray, P.S., Foster, R.S., 1997, PASP, 109, 61
- (2) Becker, W., Aschenbach, B., 2002, in Proceedings of the WE-Heraeus Seminar on Neutron Stars, Pulsars and Supernova remnants, Eds. W.Becker, H.Lesch & J/Trümper, MPE-Report 278, 64, (available from astro-ph/0208466)
- (3) Becker, W., Pavlov, G.G., 2001, in The Century of Space Science, eds. J.Bleeker, J.Geiss & M.Huber, Kluwer Academic Publishers, p721 (available from astro-ph/0208356).
- (4) Becker, W., Trümper, J., 1997, A&A, 326, 682
- (5) Bertsch, D.L., Hartman, R.C., Hunter, S.D. et al., 2000, in Proc. 5th Compton Symposium, AIP-CP 510, p504
- (6) Brazier, K.T.S., Kanbach, G., Carraminana, A., et al, 1996, MNRAS, 281, 1033
- (7) Camilo, F., Bell, J.F., Manchester, R.N., Lyne, A.G., Possenti, A., Kramer, M., Kaspi, V.M., Stairs, I.H., D’Amico, N., Hoobs, G., Gotthelf, E.V., Gaensler, B.M., 2001, ApJ, 557, L51
- (8) Camilo, F., Stairs, I.H., Lorimer, D.R., Backer, D.C., Ransom, S.M., Klein, B., Wielebinski, R., Kramer, M., McLaughlin, M.A., Arzoumanian, Z., Müller, P., 2002, ApJ, 571, L41
- (9) Camilo, F., 2003, in Radio Pulsars, Eds M.Bailes, D.J.Nice, and S.E.Thorsett, Astronomical Society of the Pacific, San Francisco
- (10) Carraminana, A., Chavushyan, V., Zharikov, S., et al., 2000, in Proc. 5th Compton Symposium, AIP-CP 510, p49
- (11) Cordes, J.M., Lazio, T.J.W., 2002, astro-ph/0207156
- (12) D’Amico, N., Kaspi, V.M., Manchester, R.N., et al. 2001 ApJ 552, L45
- (13) Dickey, J. M., Lockman, F. J., 1990, Ann. Rev. Astron. Astrophys., 28, 215
- (14) Fleming, T.A., Molendt, S., Maccacaro, T., Woltjer, A., 1995, ApJS, 99, 701
- (15) Green, D.A., 1989, A&AS, 78, 277
- (16) Gil, J.A., Khechinashvili, D.G., Melikidze, G.I., 1998, MNRAS, 298, 1207
- (17) Gonzalez, M., Safi-Harb, S., 2003, ApJ, 591, 143
- (18) Halpern, J.P., Gotthelf, E.V., Mirabal, N., Camilo, F., 2002, ApJ, 573, L41
- (19) Halpern, J.P., Eracleous, M., Mukherjee, R., et al. 2001a, ApJ 551, 1016
- (20) Halpern, J.P., Camilo, F., Gotthelf, E. V., et al. 2001b, ApJ 552, L125
- (21) Hartman, R.C., Bertsch, D.L., Bloom, S.D., et al., 1999, ApJS, 123, 79
- (22) Hessels, J.W.T., Roberts, M.S.E., Ransom, S.M., Kaspi, V.M., Romani, R.W., Ng, C.Y., Freier, P.C.C., Gaensler, B.M., 2004, astro-ph/0403632
- (23) Higgs, L.A., Landecker, T.L., and Roger, R.S., 1977, AJ, 82, 718
- (24) Kanbach, G., Bertsch, D.L., Dingus, B.L., et al., 1996, in Proc. 3rd Compton Symposium, A&AS, 120, 461
- (25) Kanbach, G., 2002, in Proc. of the 270. WE-Heraeus Seminar on Neutron Stars, Pulsars and Supernova Remnants, eds. W.Becker, H.Lesch and J-Trümper. MPE-Report 278, p91 (astro-ph/0209021)
- (26) Kramer, M., Bell, J.F., Manchester, R.N. et al., 2003, MNRAS 342, 1299
- (27) Kuzmin, A. D.; Losovkii, B. Y., Pisma Astron. Zh., 1997, 23, 323
- (28) Landecker, T.L., Roger. R.S., and Higgs, L.A., 1980, A&AS, 39, 133
- (29) Lorimer, D.R., Kramer, M., Müller, P., Wex, N., Jessner, A., Lange, C., Wielebinski, R., 2000, A&A, 358, 169
- (30) Lorimer, D.R., Yates, J.A., Lyne, A.G., Gould, D.M., 1995, MNRAS, 273, 411L
- (31) Maeda, Y., Koyama, K., Yokogawa, J., Skinner, S., 1999, ApJ 510, 967
- (32) Mayer-Hasselwander, H.A., Simpson, G., 1990, in the EGRET Science Symposium, eds C.Fichtel, S.Huntre, P.Sreekumar, F.Stecker, NASA, VP-3071, p153
- (33) Merck, M., Bertsch, D.L., Dingus, B.L., et al., 1996, in Proc. 3rd Compton Symposium, A&AS, 120, 465
- (34) Mirabal, N., Halpern, J.P., 2001, ApJ 547, L137
- (35) Monet, D.G., Levine, S.E., Canzian, B., et al., 2003, AJ, 125,984
- (36) Nice, D.J., Sayer, R.W.,1997, ApJ, 476, 261
- (37) Reimer, O., Brazier, K. T. S., Carraminana, A., et al., 2001, MNRAS, 324, 772
- (38) Reimer, O., Bertsch, D.L., 2001, in Proc. 27th ICRC (Hamburg), Ed. M.Simon, E.Lorenz, M.Pohl, Vol.6, p2546
- (39) Roberts, M.S.E., Hessels, J.W.T., Ransom, S.M., Kaspi, V.M., Freire, P.C.C., Crawford, F., Lorimer, D.R., 2002, ApJ, 577, L19
- (40) Roberts, M., Ransom, S., Hessel, J., et al, 2004, in Young Neutron Stars and their environments, IAU Symposium, Vol 218, eds. F.Camilo and B.Gaensler
- (41) Romero, G.E., Benaglia, P., Torres, D. F., et al., 2000, in Proc. 5th Compton Symposium, AIP-CP 510, p509
- (42) Stocke, J.T., Morris, S.L., Gioia, et al.,1991, ApJS, 76, 813
- (43) Sturner, S.J., Dermer, C.D., 1995, A&A, 293, L17
- (44) Swanenburg, B.N., Bennett, K., Bignami, G. F., et al.,1981, ApJ, 243, L69
- (45) Swartz, D. A., Ghosh, K.K., McCollough, M.L., Pannuti, T.G., Tennant, A.F. & Wu, K. 2003, ApJS, 144, 213
- (46) Thompson, D.J., Fichtel, C. E., Kniffen, D. A., et al, 1975, ApJ, 200, L79
- (47) Torres D.F., Butt, Y.M., Camilo, F., 2001, ApJ 560, L155
- (48) Uchiyama Y., Takahashi, T., Aharonian, F.A., Mattox, J.R., 2002, ApJ, 571, 866
- (49) Wallace P.M., Halpern, J.P., Magalhaes, A.M., et al., 2002 ApJ, 569, 36
- (50) Wendker, H.J., Higgs, L.A., and Landecker, T.L., 1991, A&A, 241, 551
- (51) Wilms,J., Allen,A. & McCray,R. 2000, ApJ, 542, 914
- (52) Yadigaroglu, I.-A., and Romani, R.W., 1995, ApJ, 449, 211
| NAME | R.A. | Dec. | a | c | d | USNOe | 2MASSe | ROSATe | |
|---|---|---|---|---|---|---|---|---|---|
| (J2000) | (J2000) | () | () | () | () | () | |||
| S401 | 304.86758 | 40.436279 | 13.6 | 49 | 5.7 | 1.25 | 0.61&1.55 | ||
| S402 | 304.88129 | 40.373795 | 13.8 | 25 | 3.9 | 1.72 | 1.65 | ||
| S403 | 304.92621 | 40.362309 | 10.1 | 69 | 6.7 | 0.87 | 1.05 | 1.13 | |
| S301 | 304.97339 | 40.455490 | 4.54 | 13 | 3.0 | 0.88 | 0.70 | 0.63 | |
| S302 | 304.97769 | 40.468494 | 4.61 | 36 | 5.2 | 0.65 | |||
| S303 | 304.99615 | 40.398434 | 3.75 | 14 | 3.1 | 0.76 | 0.85 | 1.29 | |
| S304 | 305.00381 | 40.365112 | 5.03 | 14 | 3.0 | 0.94 | 1.15 | 1.41 | |
| S305 | 305.00769 | 40.434021 | 2.63 | 176 | 11.2 | 0.47 | 0.56 | ||
| S306 | 305.01837 | 40.457535 | 2.47 | 23 | 4.3 | 0.55 | |||
| S307 | 305.02713 | 40.412449 | 2.19 | 25 | 4.5 | 0.52 | 0.37 | 0.39 | |
| S308 | 305.02737 | 40.374905 | 3.60 | 28 | 4.8 | 0.61 | 0.25 | 0.36 | |
| S309 | 305.05789 | 40.394272 | 2.04 | 15 | 3.3 | 0.55 | 0.17 | ||
| S310 | 305.06354 | 40.486912 | 2.46 | 12 | 3.1 | 0.63 | 0.95 | 1.05 | |
| S311 | 305.07104 | 40.446281 | 1.21 | 44 | 5.8 | 0.47 | 0.30 | 0.25 | |
| S312 | 305.07147 | 40.437424 | 1.14 | 253 | 13.7 | 0.46 | 0.27 | 0.30 | 5.9f |
| S313 | 305.08884 | 40.448517 | 1.21 | 20 | 3.7 | 0.48 | |||
| S314 | 305.09262 | 40.490631 | 2.57 | 22 | 4.0 | 0.56 | 0.13 | ||
| S315 | 305.10596 | 40.484375 | 2.37 | 12 | 3.0 | 0.61 | 0.65 | 0.41 | |
| S316 | 305.11560 | 40.440331 | 1.40 | 11 | 3.1 | 0.52 | |||
| S201 | 305.14136 | 40.473434 | 2.68 | 10 | 2.9 | 0.68 | 0.34 | 0.62 | |
| S202 | 305.15140 | 40.494373 | 3.97 | 17 | 3.5 | 0.73 | 0.80 | 0.64 | |
| S203 | 305.15570 | 40.495060 | 4.18 | 11 | 2.8 | 0.88 | |||
| S204 | 305.17081 | 40.451115 | 3.26 | 85 | 7.9 | 0.50 | 0.22 | 0.35 | 1.2g |
| S205 | 305.17349 | 40.380219 | 4.65 | 29 | 4.7 | 0.69 | 0.73 | ||
| S206 | 305.18216 | 40.450073 | 3.82 | 213 | 12.4 | 0.48 | 0.31 | ||
| S207 | 305.18600 | 40.430450 | 3.93 | 10 | 2.9 | 0.87 | 0.78 | 1.03 | |
| S208 | 305.21335 | 40.403984 | 6.05 | 16 | 3.4 | 1.02 | 0.84 | ||
| S209 | 305.21414 | 40.509041 | 8.20 | 28 | 4.2 | 1.04 | 1.73 | 1.66 | |
| S210 | 305.21881 | 40.473904 | 6.70 | 24 | 3.8 | 0.95 | 0.55 | 0.55 | |
| S211 | 305.21906 | 40.408849 | 6.35 | 66 | 7.0 | 0.65 | 0.43 | 0.62 | |
| S212 | 305.22256 | 40.507294 | 8.70 | 47 | 5.9 | 0.89 | 1.54 | 1.61 | |
| S213 | 305.23041 | 40.474827 | 7.60 | 33 | 4.2 | 0.95 | 0.91 | 0.63 | |
| S214 | 305.24078 | 40.474091 | 8.44 | 101 | 8.2 | 0.68 | 0.60 | 0.40 | 2.9h |
| S215 | 305.24927 | 40.378075 | 9.95 | 17 | 3.1 | 1.52 | 0.91 | 0.95 | |
| S216 | 305.25110 | 40.485874 | 9.80 | 33 | 4.3 | 1.12 | 1.63 | 1.10 | |
| S217 | 305.27808 | 40.430069 | 11.2 | 24 | 3.8 | 1.47 | 0.97 | 0.97 | |
| S218 | 305.29422 | 40.513210 | 15.8 | 35 | 4.0 | 1.66 | 0.57 | ||
| S219 | 305.29767 | 40.468163 | 13.9 | 201 | 11.5 | 0.74 | 0.38 | 0.70 | 2.4i |
Note. —
a Extraction radius.
b Approximate number of source counts.
c Detection signal-to-noise ratio.
d X-ray position uncertainty ( radius).
e Radial separation between X-ray position and cataloged position of counterpart.
f 1RXH J2020.2+4026; the positional uncertainty is 6 arcsec.
g 1RXH J202040.9+402704; the positional uncertainty is larger than the separation (2-3 arcsec)
h 1RXH J202057.8+402829; the positional uncertainty is 1 arcsec.
i 1RXH J202111.4+402807; the positional uncertainty is 2 arcsec.
| NAME | R.A. | Dec. | a | R.A. | Dec. | a | b |
|---|---|---|---|---|---|---|---|
| (J2000) | (J2000) | (J2000) | (J2000) | () | |||
| USNO | USNO | 2MASS | 2MASS | ||||
| S401 | 304.867803 | 40.436275 | 0.041 | ||||
| S401 | 304.868070 | 40.436495 | 0.041 | ||||
| S402 | 304.881105 | 40.373360 | 0.117 | ||||
| S403 | 304.926575 | 40.362225 | 0.020 | 304.926589 | 40.362183 | 0.030 | 0.16 |
| S301 | 304.973164 | 40.455400 | 0.021 | 304.973295 | 40.455330 | 0.031 | 0.44 |
| S303 | 304.996045 | 40.398212 | 0.015 | 304.995913 | 40.398125 | 0.023 | 0.48 |
| S304 | 305.003723 | 40.364800 | 0.023 | 305.003740 | 40.364723 | 0.035 | 0.28 |
| S305 | 305.007841 | 40.434124 | 0.009 | ||||
| S307 | 305.027000 | 40.412425 | 0.007 | 305.027043 | 40.412365 | 0.011 | 0.25 |
| S308 | 305.027320 | 40.374964 | 0.010 | 305.027281 | 40.374832 | 0.015 | 0.49 |
| S309 | 305.057841 | 40.394245 | 0.012 | ||||
| S310 | 305.063206 | 40.486845 | 0.010 | 305.063218 | 40.486755 | 0.015 | 0.33 |
| S311 | 305.070998 | 40.446359 | 0.006 | 305.071003 | 40.446217 | 0.009 | 0.51 |
| S312 | 305.071387 | 40.437464 | 0.005 | 305.071389 | 40.437366 | 0.008 | 0.35 |
| S314 | 305.092591 | 40.490601 | 0.012 | ||||
| S315 | 305.105898 | 40.484550 | 0.010 | 305.105912 | 40.484482 | 0.015 | 0.25 |
| S201 | 305.141242 | 40.473467 | 0.012 | 305.141188 | 40.473324 | 0.018 | 0.54 |
| S202 | 305.151131 | 40.494459 | 0.014 | 305.151193 | 40.494289 | 0.021 | 0.64 |
| S204 | 305.170775 | 40.451170 | 0.007 | 305.170747 | 40.451031 | 0.010 | 0.51 |
| S205 | 305.173353 | 40.380392 | 0.013 | ||||
| S206 | 305.182074 | 40.450016 | 0.009 | ||||
| S207 | 305.186253 | 40.430348 | 0.020 | 305.186255 | 40.430241 | 0.030 | 0.39 |
| S208 | 305.213189 | 40.403786 | 0.041 | ||||
| S209 | 305.214453 | 40.508625 | 0.028 | 305.213771 | 40.508675 | 0.042 | 1.88 |
| S210 | 305.218609 | 40.473920 | 0.024 | 305.218624 | 40.473850 | 0.035 | 0.26 |
| S211 | 305.219192 | 40.408425 | 0.011 | 305.219198 | 40.408352 | 0.017 | 0.26 |
| S212 | 305.223092 | 40.507159 | 0.021 | 305.223083 | 40.507088 | 0.031 | 0.26 |
| S213 | 305.230259 | 40.475053 | 0.024 | 305.230230 | 40.474934 | 0.036 | 0.44 |
| S214 | 305.240995 | 40.474125 | 0.012 | 305.240870 | 40.474003 | 0.018 | 0.56 |
| S215 | 305.249534 | 40.378228 | 0.061 | 305.249506 | 40.378269 | 0.090 | 0.17 |
| S216 | 305.250842 | 40.486821 | 0.033 | 305.250918 | 40.486145 | 0.049 | 0.53 |
| S217 | 305.278420 | 40.429992 | 0.057 | 305.278386 | 40.429932 | 0.085 | 0.24 |
| S218 | 305.294173 | 40.513363 | 0.109 | ||||
| S219 | 305.297639 | 40.468059 | 0.015 | 305.297601 | 40.467976 | 0.022 | 0.32 |
Note. —
a The average number of accidential coincidences expected in the region searched.
b Angular separation between the USNO and 2MASS candidate counterpart.
| Source | J | H | KS | JH | HKS | JKS | ||||||
|---|---|---|---|---|---|---|---|---|---|---|---|---|
| S201 | 14.821 | 0.038 | 14.136 | 0.053 | 13.706 | 0.061 | 0.685 | 0.065 | 0.430 | 0.081 | 1.115 | 0.072 |
| S202 | 14.458 | 0.038 | 13.702 | 0.037 | 13.485 | 0.05 | 0.756 | 0.053 | 0.217 | 0.062 | 0.973 | 0.063 |
| S204 | 13.243 | 0.029 | 12.566 | 0.032 | 12.359 | 0.036 | 0.677 | 0.043 | 0.207 | 0.048 | 0.884 | 0.046 |
| S206 | 14.516 | 0.051 | 13.921 | 0.051 | 13.796 | 0.069 | 0.595 | 0.072 | 0.125 | 0.086 | 0.72 | 0.086 |
| S207 | 15.235 | 0.052 | 14.678 | 0.070 | 14.58 | 0.12 | 0.557 | 0.087 | 0.098 | 0.139 | 0.655 | 0.131 |
| S208 | 17.597a | 15.246 | 0.133 | 14.614 | 0.12 | 0.632 | 0.179 | |||||
| S209 | 14.281 | 0.052 | 13.232 | 0.068 | 12.725 | 0.063 | 1.049 | 0.086 | 0.507 | 0.093 | 1.556 | 0.082 |
| S210 | 14.648 | 0.038 | 13.685 | 0.039 | 13.249 | 0.043 | 0.963 | 0.054 | 0.436 | 0.058 | 1.399 | 0.057 |
| S211 | 13.503 | 0.026 | 12.695 | 0.021 | 12.338 | 0.03 | 0.808 | 0.033 | 0.357 | 0.037 | 1.165 | 0.040 |
| S212 | 11.468 | 0.022 | 11.075 | 0.020 | 10.9 | 0.023 | 0.393 | 0.030 | 0.175 | 0.030 | 0.568 | 0.032 |
| S213 | 14.99 | 0.045 | 14.151 | 0.052 | 13.802 | 0.063 | 0.839 | 0.069 | 0.349 | 0.082 | 1.188 | 0.077 |
| S214 | 12.674a | 11.851 | 0.035 | 11.606 | 0.039 | 0.245 | 0.052 | |||||
| S215 | 14.361 | 0.036 | 13.29 | 0.036 | 11.96a | 1.071 | 0.051 | |||||
| S216 | 13.736 | 0.028 | 12.929 | 0.031 | 12.615 | 0.034 | 0.807 | 0.042 | 0.314 | 0.046 | 1.121 | 0.044 |
| S217 | 11.733 | 0.021 | 11.497 | 0.018 | 11.463 | 0.018 | 0.236 | 0.028 | 0.034 | 0.025 | 0.27 | 0.028 |
| S218 | 14.9a | 15.591 | 0.136 | 13.743a | N/A | |||||||
| S219 | 11.927 | 0.021 | 11.252 | 0.018 | 11.155 | 0.017 | 0.675 | 0.028 | 0.097 | 0.025 | 0.772 | 0.027 |
| S301 | 14.915 | 0.039 | 13.742 | 0.037 | 13.337 | 0.042 | 1.173 | 0.054 | 0.405 | 0.056 | 1.578 | 0.057 |
| S303 | 15.776 | 0.069 | 14.678 | 0.064 | 14.283 | 0.091 | 1.098 | 0.094 | 0.395 | 0.111 | 1.493 | 0.114 |
| S304 | 15.764 | 0.068 | 14.914 | 0.076 | 14.479 | 0.103 | 1.750 | 0.102 | -0.465 | 0.128 | 1.285 | 0.123 |
| S305 | 11.185 | 0.023 | 10.783 | 0.018 | 10.673 | 0.016 | 0.402 | 0.029 | 0.11 | 0.024 | 0.512 | 0.028 |
| S307 | 14.559 | 0.033 | 13.225 | 0.026 | 12.636 | 0.026 | 1.334 | 0.042 | 0.589 | 0.037 | 1.923 | 0.042 |
| S308 | 14.29 | 0.039 | 13.375 | 0.063 | 13.007 | 0.036 | 0.915 | 0.074 | 0.368 | 0.073 | 1.283 | 0.053 |
| S309 | 17.863a | 15.472 | 0.118 | 14.683 | 0.125 | 0.118 | 0.789 | 0.172 | ||||
| S310 | 15.37 | 0.052 | 14.331 | 0.049 | 14.127 | 0.076 | 1.039 | 0.071 | 0.204 | 0.090 | 1.243 | 0.092 |
| S311 | 15.181 | 0.054 | 14.246 | 0.054 | 13.957 | 0.067 | 0.935 | 0.076 | 0.289 | 0.086 | 1.224 | 0.086 |
| S312 | 12.373 | 0.022 | 11.83 | 0.021 | 11.686 | 0.017 | 0.543 | 0.030 | 0.144 | 0.027 | 0.687 | 0.028 |
| S314 | 16.492 | 0.135 | 15.4 | 0.107 | 14.906 | 0.158 | 1.092 | 0.172 | 0.494 | 0.191 | 1.586 | 0.208 |
| S315 | 15.365 | 0.052 | 14.738 | 0.062 | 14.38 | 0.101 | 0.627 | 0.081 | 0.358 | 0.119 | 0.985 | 0.114 |
| S402 | 14.456 | 0.038 | 13.702 | 0.035 | 13.477 | 0.045 | 0.754 | 0.052 | 0.225 | 0.057 | 0.979 | 0.059 |
| S403 | 13.262 | 0.023 | 12.749 | 0.024 | 12.634 | 0.028 | 0.513 | 0.033 | 0.115 | 0.037 | 0.628 | 0.036 |
Note. —
a Lower limit.
| Source | Modela | or kT (keV) | |||
|---|---|---|---|---|---|
| S312 | PL | 16.6 | 15 | 1.07 (0.801.45) | 8.2 (6.810.0) |
| S312 | MEKAL | 22.3 | 15 | 0.00 (0.000.05) | 0.77 (0.680.83) |
| S312 | BB | 14.6 | 15 | 0.37 (0.220.61) | 0.14 (0.120.15) |
| S206 | PL | 18.7 | 16 | 0.01 (0.000.15) | 1.92 (1.672.36) |
| S206 | MEKAL | 43.4 | 16 | 1.2 | 1.0 |
| S206 | BB | 32.8 | 16 | 0.0 | 0.5 |
| S219 | PL | 29.8 | 16 | 0.5 | 5.4 |
| S219 | MEKAL | 49.2 | 16 | 0.0 | 1.0 |
| S219 | BB | 33.9 | 16 | 0.0 | 0.2 |
| S305 | PL | 18.2 | 12 | 0.48 (0.160.82) | 2.98 (2.51 3.89) |
| S305 | MEKAL | 17.8 | 12 | 1.28 (1.071.51) | 0.70 (0.59 0.82) |
| S305 | BB | 21.7 | 12 | 0.0 (0.00.20) | 0.39 (0.32 0.44) |
| S214 | PL | 12.3 | 6 | 0.2 | 3.2 |
| S214 | MEKAL | 9.7 | 6 | 0.9 | 0.9 |
| S214 | BB | 14.6 | 6 | 0.0 | 0.3 |
| S204 | PL | 7.75 | 4 | 0.0 | 2.6 |
| S204 | MEKAL | 11.6 | 4 | 1.0 | 1.0 |
| S204 | BB | 12.0 | 4 | 0.0 | 0.4 |
.
| Seq. | Start date | Exposure | R.A. (J2000) | Dec. (J2000) |
|---|---|---|---|---|
| number | (YMD) | (sec) | (HMS) | (DMS) |
| 202033h | 1994 11 15 | 10536 | 20 20 28.08 | 41 21 36 |
| 202534h | 1997 06 06 | 10370 | 20 22 14.04 | 40 15 36 |
| 400899h | 1996 11 02 | 36552 | 20 21 04.08 | 40 26 24 |
| 500339h | 1994 11 14 | 18761 | 20 19 48.00 | 40 03 00 |
| Data | Source | R.A. (J2000) | Dec. (J2000) | HRI rate | Chandra |
|---|---|---|---|---|---|
| cts/s | |||||
| 400899h | RX J202137.6+402959 | 305.407035 | 40.499979 | — | |
| 400899h | RX J202057.8+402829 | 305.240996 | 40.474830 | S214 | |
| 400899h | RX J202111.3+402806 | 305.297479 | 40.468571 | S219 | |
| 400899h | RX J202040.8+402704 | 305.170322 | 40.451285 | S204 | |
| 400899h | RX J202130.5+402649 | 305.377281 | 40.447124 | — | |
| 400899h | RX J202016.8+402614 | 305.070074 | 40.437480 | S312 | |
| 202534h | RX J202240.0+401900 | 305.666926 | 40.316753 | — | |
| 202534h | RX J202150.5+401837 | 305.460420 | 40.310447 | — | |
| 500339h | RX J201950.8+395752 | 304.961886 | 39.964551 | — |
| R.A. (J2000) | Dec. (J2000) | Dwell |
|---|---|---|
| (HMS) | (DMS) | (hour) |
| 20 20 18.07 | 40 24 35.1 | 4 |
| 20 21 21.53 | 40 23 21.7 | 4 |
| 20 21 25.06 | 40 14 47.1 | 4 |
| 20 20 33.07 | 40 13 15.7 | 3 |