Gravitational lensing in a concordance LCDM universe: The importance of secondary matter along the line of sight
Abstract
To date, in almost all strong gravitational lensing analyses for modeling giant arc systems and multiple quasar images, it has been assumed that all the deflecting matter is concentrated in one lens plane at a certain distance— the thin lens approximation. However, in a few observed cases, lenses at more than one redshift have been identified as contributing to the image splitting.
Here we report on a quantitative investigation of the importance and frequency of significant multiple lensing agents. We use multi-lens plane simulations to evaluate how frequently two or more lens planes combined are essential for multiple imaging, as compared with the cases where a single lens plane alone provides enough focusing to be supercritical.
We find that the fraction of cases for which more than one lens plane contributes significantly to a multi-image lensing situation is a strong function of source redshift. For sources at redshift unity, 95% of lenses involve only a single mass concentration, but for a more typical scenario with, e.g., a source at a redshift of , as many as 38% of the strongly lensed quasars/arcs occur because of a significant matter contribution from one or more additional lens planes. In the 30% to 40% of cases when additional planes make a significant contribution, the surface mass density of the primary lens will be overestimated by about 15% to 20%, if the additional contributions are not recognized.
1 Introduction
By now of order 100 multiple quasar systems are known (cf. Kochanek et al. 2004), as well as more than 100 galaxy clusters which produce giant luminous arcs (for a selection, see Table 2 of Wambsganss, Bode & Ostriker, 2004). Usually it is assumed that modeling the matter distribution as a thin lens, i.e. putting all the matter responsible for the light deflection into one lens plane of zero thickness, is a good enough approximation (Schneider, Ehlers & Falco 1992). And indeed, most systems can be modeled well using this simplification. However, for some multiply imaged quasars no good models can be found within this framework (e.g. for the quadruple system B1422+231, see Kormann et al. 1994), and on the observational side there are instances where galaxies at two different redshifts have been identified as contributing to the lensing (e.g. B1422+231, see Tonry 1998, or for B2114+022, see Augusto et al. 2001 and Chae, Mao & Augusto 2001).
There is one a priori reason to expect that the contribution of multiple lens planes may be important. If we consider a representative shell of the universe centered around redshift with comoving thickness Mpc, and examine the distribution of surface mass densities, we find that the fraction of ray bundles encountering more than the critical surface mass density111 , where and are the gravitational constant and the velocity of light, , , and , are the angular diameter distances observer-source, observer-lens, and lens-source,respectively. (here evaluated for a source redshift of ) is only (and of course proportional to ). But, more to the point, this fraction steeply declines with increasing : at (for more details see in Wambsganss, Bode & Ostriker 2004b). Thus, there are many rays along which the surface mass density is just subcritical for each one that is supercritical. And for each slightly subcritical ray, a small additional mass concentration along the line-of-sight can make a significant difference in its behavior.
So far no quantitative estimate exists on how frequently a second matter clump along the line of sight contributes significantly to the light deflection caused by a near critical primary matter concentration, hence affecting the image geometry as well as the intensity ratios. In these instances, a relatively small “boost”’ from an overdense region elsewhere along the line of sight will make this line-of-sight supercritical. In fact, we find that for a source redshift of approximately 30% of the cases of strong lensing are produced by multiple disparate matter planes, and averaged over all cases, the secondary matter contribution is 13.2% 13.4% of the critical density.
Here we present results based on multiple lens plane rayshooting simulations, using very high resolution LCDM N-body simulations for the pseudo-3D matter distribution. By following light rays through many lens planes up to high source redshift, we model the behavior of realistic light bundles. In Section 2 we briefly describe the underlying simulations and the method we use to evaluate the importance of more than one lens plane. In Section 3 we present our results on how important two, three or more lens planes are for strong lensing of sources at different redshifts. Summary and conclusion can be found in Section 4.
2 Method
We performed ray shooting simulations in order to quantitatively determine strong and weak lensing properties of a concordance LCDM model, as described in detail in Wambsganss, Bode & Ostriker (2004b). This cosmological model has the following parameters: matter content , cosmological constant , Hubble constant km/sec/Mpc, linear amplitude of mass fluctuations =0.95, and primordial power spectral index =1 (consistent with the 1 WMAP derived cosmological parameters, see Spergel et al. 2003, Table 2). The simulation, carried out with the TPM code (Bode & Ostriker 2003), has a comoving side length of Mpc; the cubic spline softening length was set to kpc, producing a ratio of box size to softening length of . We used particles, with the individual particle mass being M⊙, so that a large halo, similar to those which produce the observed giant arcs, would be represented by of order particles which is enough to allow a fair representation of both the inner cusp and of significant substructure.
We produced lens screens out to , the centers of the lens screens correspond to comoving distances of Mpc, where . The comoving average surface mass density of the lens planes is kpc g cm More details on the numerical scheme can be found in Wambsganss et al. (2004b). A first result on the statistics of giant luminous arcs was published as Wambsganss, Bode & Ostriker (2004a).
The following analysis was carried out in order to evaluate the importance of secondary, tertiary etc. lens planes. In each ray shooting run, we use a grid of 8002 rays to cover an area of about 20 arcmin on a side. Each ray with starting position is followed backward to a given source redshift (we used 7 different values: 0.5, 1.0, 1.5, 2.5, 3.7, 4.8, and 7.5). At each of the lens screens we determined the surface mass density of the matter pixels in units of the critical surface mass density at that redshift: Then we identified the highest value of for fixed angular position . If this value was above unity (“supercritical”), that particular lens plane alone would be enough to produce strong lensing/multiple imaging at this particular position. If this condition was not fulfilled ( for all out to the source), we checked whether the sum of the two highest values of along this line combined would exceed the critical value. If so, this would imply that the combination of two planes could produce multiple imaging, whereas each individual plane still is sub-critical. If this was not the case either, we did the same exercise for the combination of the three, four, and five highest surface mass density values along this particular ray position . We did this for all angular positions in 100 different realizations, and for all the seven source redshifts.
3 Results
In Figure 1 the fraction of lines-of-sight for which a second (third, fourth, fifth) lens plane contributes to reaching the critical value of the surface mass density is displayed. The top panel indicates the contribution of secondary, tertiary etc. planes, expressed as a fraction of the frequency for which a single plane is supercritical; the bottom panel shows this contribution as the fraction of all multiple image cases, including the ‘single plane’ cases (thus the symbols in the bottom panel add upp to unity).
The star symbol in Figure 1 indicates the situation in which two planes combined exceed the critical surface mass density. This fraction is slowly increasing for increasing source redshift: for , lines-of-sight in which two planes combined are super-critical are about 8% compared to the single-lens plane cases. This fraction, however, monotonically increases to over 20% for and reaches more than 40% for . The other symbols indicate cases in which three (triangle), four (cross) and five (pentagon) lines-of-sight combined exceed the critical value of the surface mass density. The overall importance of additional planes goes down, the larger the number of significantly contributing lens planes is; but in all cases the contribution is monotonically increasing with source redshift. In the bottom panel of Figure 1, the thick circles indicate the fraction of all supercritical lines-of-sight which are produced by a single lens plane: it starts as high as 95% for a source redshift of , and then it drops monotonically to a value of 50% for the highest source redshift of .

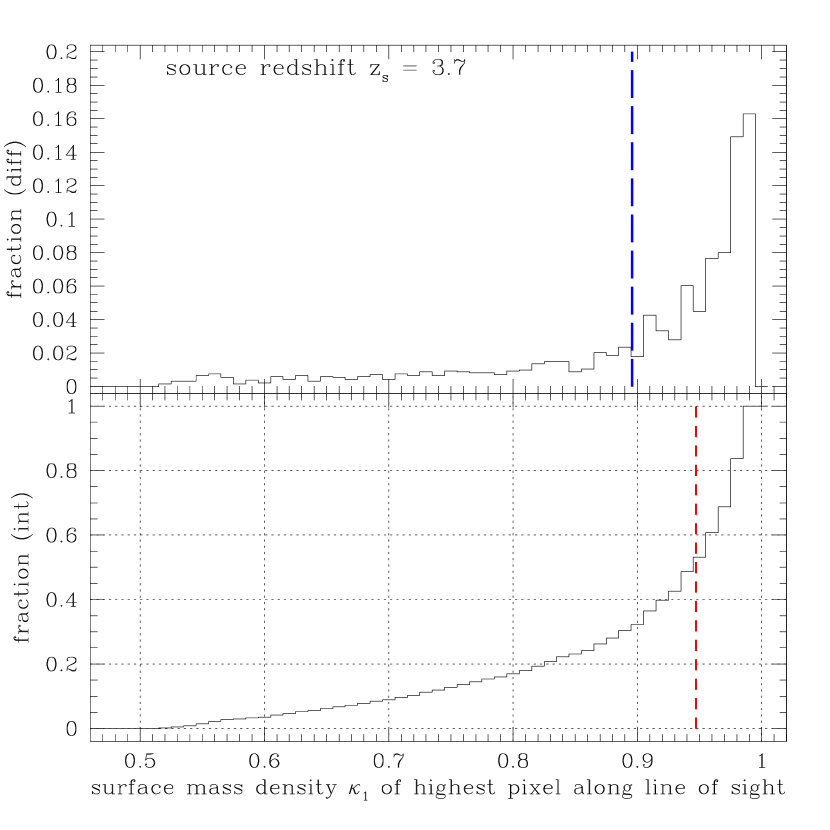
In cases where two lens planes combined to reach the critical surface mass density level, what is the relative contribution of the two? In Figure 2 this question is answered for a source redshift of . The histogram in the top panel shows the relative distribution of the primary lens plane. It is very low and flat for values of (by definition, the “primary” plane in this case has to have ). Then the histogram steepens with the peak at -values just below unity. This means even in a situation in which two lens planes are necessary for critical lensing, the large majority of cases are dominated by one lens plane. The mean of the highest surface mass density value for cases in which two planes contribute is: . The bottom panel shows the integrated fraction of these cases in which the primary plane have , but . It is easy to read off the median: in 50% of the cases in which two planes contribute, the primary plane has .
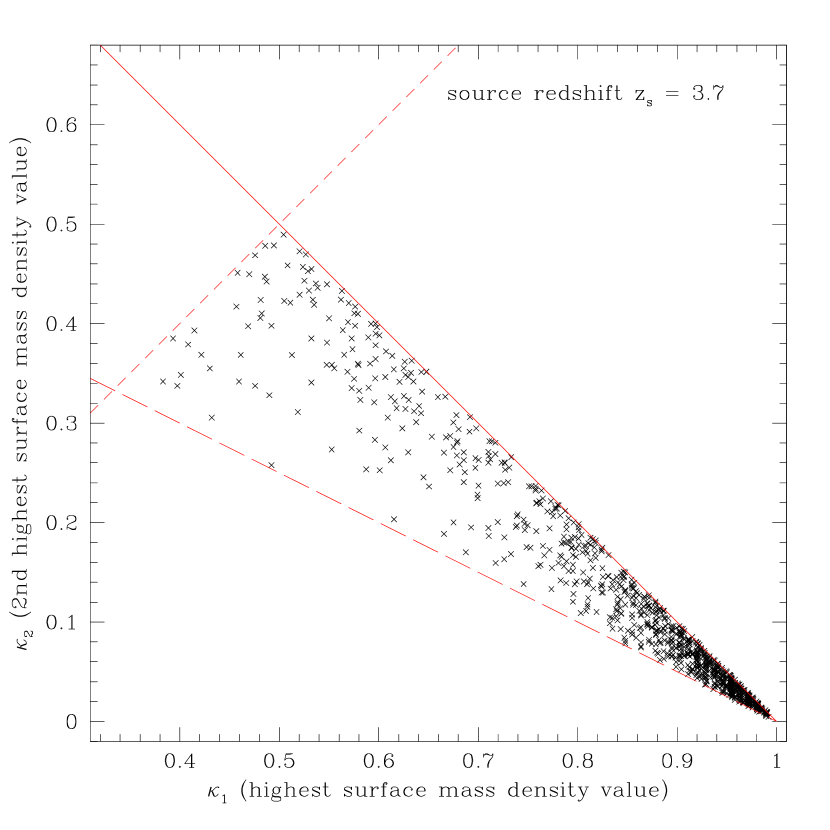
The same question can be asked about cases in which three planes combined reached the critical value of the surface mass density. In Figure 3, each point represents one pair (,), i.e. the highest and the second highest value of the surface mass density along the line of sight. All points fulfill the criterion , and hence have to be left of the solid line. One can read off the (minimum) value of the third contribution by the vertical distance of each point to this line. Most points are concentrated close to the solid line, which means in most cases the third plane contribution is small. The distribution of points is limited towards the top left by the relation (short-dashed line). Points close to this line represent cases for which the two highest matter concentrations along the line of sight are comparable. The long-dashed line limiting the distribution towards the bottom is given by the relation = 1: the secondary and tertiary contributions are nearly equal for points near this line. The overall distribution of the points clearly have the highest density towards the lower right, which means that in most of the “three-planes-contribute” cases, one plane clearly dominates as well.
Given an observed strong lensing situation, the probability that a single lens plane alone has a super-critical surface mass density can be read off from the bottom part of Figure 1 as a function of source redshift. An interesting question concerns a variant of this: what is the average contribution of the secondary lens planes to the surface mass density in those cases in which two, three or more lens planes contribute significantly? This question can be answered by looking at Figure 4. Here only the cases in which two or more lens planes combined reach the critical surface mass density are shown. The two sets of lines show the average surface mass density of the dominant lens plane including its dispersion as a function of source redshift (top, between ), and the combined average surface mass density of the secondary, tertiary or higher order lens planes which combined with the dominant one make this line of sight supercritical (bottom, between ). A single mass concentration is clearly dominating. Thus, in the typical case, if a cluster of galaxies is known to be acting as a lens, its surface mass density will be overestimated by 15% to 20% in the 30% to 40% of the cases when two or more lens planes contribute significantly.

4 Discussion
A small fraction of the sky is covered by regions that have a surface mass density equal to the cosmic value capable of producing multiple images, and this fraction declines rapidly with increasing surface mass density , for . Thus many regions that are subcritical will be boosted over the threshold by additional chance accumulations of mass at unrelated distances, which intersect the line of sight defined by: observer main lens source. For source redshifts above this occurs in 30% to 40% of the cases, and in these cases on average 15% to 20% of the lensing mass is in the chance alignments.
This phenomenon has severe consequences which must be considered when using strong lenses as a tool in cosmological investigations. Primary among them are the following:
-
1.
the probability of strong lensing increasing with source redshift more steeply than would be computed by the single sheet approximation;
-
2.
masses of individual clusters will be overestimated by gravitational lensing techniques as compared to those using internal cluster velocity dispersions and/or X-ray temperatures;
-
3.
substructure may be incorrectly inferred to exist within lensing systems and time delays incorrectly computed.
While the effects are not large, they are systematic and lensing systems should be analyzed with consideration of these gravitational contaminations.
As a consequence, these effects will lead to a systematic error in the analyses of lensing clusters such that the “best fit” single lens plane gravitational lens models may overestimate the cluster mass by up to 10% (depending in detail on lens and source redshifts). Correspondingly this effect may introduce a systematic bias in the determination of the Hubble constant of quasar lens systems which is usually based on the “thin lens approximation” (cf. Kochanek 2003, and Kochanek & Schechter 2004). Further and more quantitative investigations of the implications of unrecognized secondary mass contributions are beyond the scope of this letter and will be done in subsequent analyses.
References
- (1) Augusto, P., Browne, I.W.A., Wilkinson, P.N., Jackson, N.J., Fassnacht, C.D. et al.: 2001, MNRAS 326, 1007
- Bode & Ostriker (2002) Bode, P. & Ostriker, J.P. 2003, ApJS, 145, 1
- (3) Chae, K.-H., Mao, S., Augusto, P.: 2001, MNRAS 326, 1015
- (4) Kormann, R., Schneider, P., Bartelmann, M. 1994, A&A 286, 357
- (5) Kochanek, C.S., Falco, E.E., Impey, C., Lehar, J., McLeod, B., Rix, H.-W., 2004, http://cfa-www.harvard.edu/glensdata/
- K (03) Kochanek, C.S., 2003, ApJ 583, 49-57
- KS (04) Kochanek, C. S., Schechter, P. L., 2004, in: “Measuring and Modeling the Universe”, (Carnegie Observatories Centennial Symposia) p.117, ed. W. L. Freedman (Cambridge University Press, Cambridge, 2004)
- (8) Schneider, P., Ehlers, J., Falco, E.E. 1992, “Gravitational Lenses” (Springer-Verlag, Berlin, 1992)
- Spergel et al. (2003) Spergel, D.N., Verde, L., Peiris H.V., Komatsu E., Nolta M.R., et al. 2003, ApJS, 148, 175
- (10) Tonry, J. L. 1998, AJ 115, 1
- Wambsganss et al. (2004a) Wambsganss, J., Bode, P., & Ostriker, J.P. 2004a, ApJ, 606, L93
- Wambsganss et al. (2004b) Wambsganss, J., Bode, P., & Ostriker, J.P. 2004b ApJ (to be submitted)