11email: hrkloeck@astro.rug.nl 22institutetext: ASTRON, Westerbork Observatory, P.O. Box 2, 7990 AA Dwingeloo, The Netherlands
An embedded circumnuclear disk in Mrk 273
Radio observations using very long baseline interferometry
(VLBI) and the Westerbork interferometer have been carried out to
study the hydroxyl Megamaser emission in Mrk 273 at different spatial
resolutions. Line and continuum observations were carried out by the
European VLBI network (EVN) at 1.6 GHz and display a number of
distinct structural components in the central arcsec2 region.
The observed continuum emission shows three prominent regions with
both flat and steep spectral indexes.
The hydroxyl (OH) emission detected by the EVN measurements accounts
for only 12 percent of the total OH emission in Mrk 273, but it does
show the same dominant 1667 MHz line emission components as the WSRT
observations. The spatial distribution of the maser emission provides
a high resolution view of the molecular environment in the nuclear
region. The OH emission has only been detected toward a distinct radio
source in the northern nucleus with a spatial extent of 108 pc. The OH
emission is only partially superposed on the radio continuum and is
associated with the near-infrared emission source. The low pump
efficiency of the maser and the OH main-line ratio suggest that this
emission originates in an optically thin and unsaturated maser
environment with a complex pumping scheme that cannot be explained by
radiative infrared pumping with a single dust temperature. The
specific line emission pattern and the line-of-sight velocities
indicate the organized structure of an edge-on disk/TORUS with a
Keplerian rotation surrounding a central object with a binding mass of
M⊙.
Key Words.:
galaxies: individual: Mrk 273, – masers – galaxies: ISM – galaxies: kinematics and dynamics1 Introduction
Extragalactic hydroxyl (OH main-lines) emission has been studied since the early eighties (Baan et al., 1982), establishing a new class of extragalactic masers with unexpected isotropic luminosities of several magnitudes higher than the most luminous galactic counterparts (e.g. W3(OH)). The OH Megamaser (OH-MM) galaxies are a sub-sample of the ultra-luminous infrared galaxies (ULIRG) that are morphologically peculiar due to ongoing mergers. The nuclei exhibit phenomena related to (circum-nuclear) starburst (SBN) activity and/or the presence of an active galactic nucleus (AGN). The high molecular and dust content of the nuclear regions together with the nuclear activity render these sources ideal probes for studying the circumnuclear environment. The exceptional line width of the OH emission has been thought to exclusively trace the circumnuclear environment close to a central power source (e.g. see Klöckner & Baan, 2003). So far, only a small fraction of the prominent OH-MM galaxies has been observed by using very long baseline interferometry. These studies have shown a rather complex picture of continuum and the maser emission inside the nuclear region (for a detailed list see Klöckner & Baan, 2002).
The galaxy Mrk 273 (UGC 08696, IRAS 134285608) has been classified as a ULIRG with an infrared luminosity of LFIR = L⊙. Its warm infrared color (ratio of the 60 m to 100 m IRAS flux of 1.02) suggests that the bulk of the infrared excess is associated with dust heated by nuclear star formation rather than by a dominant contribution of an accretion disk (Sanders & Mirabel, 1996, and references therein). In the optical Mrk 273 displays a morphologically disturbed structure with a thin tidal tail extending towards the south by 50 arcsec (1.3 arcsec 1 kpc)111The optical redshift of z = 0.03778, q0= 0.5 km s-1 and H0= 75 km s-1 Mpc-1 are used for all further estimates in this paper; therefore 1 mas corresponds to 0.7389 pc. and a fan-like plume. The infrared excess, the distinct morphology and the observed soft X-ray halo of 50″ 30″ indicate a merger event within the last 108 yrs (Knapen et al., 1997). The fan-like plume itself is 15″ in size and has a rather complex structure consistent with the inner interaction region in a galactic merger. The central region of Mrk 273 harbors prominent dust lanes, ionized gas, and several sources visible at different emission bands, which complicates the diagnosis of the nuclear energetics. Strong optical emission lines from two distinct regions indicate the presence of a low-luminosity LINER nucleus in the north with a size of around 1 arcsec and a Seyfert 2 nucleus located 4 arcsec towards the southwest (Colina et al., 1999).
The LINER source in the north reveals both diffuse and compact radio emission components, which support the notion of enhanced star formation as well as the optical classification (Carilli & Taylor, 2000). On the other hand, hard X-ray emission has only been detected towards this source, which indicates either a heavily obscured high-luminosity AGN or a less obscured low-luminosity AGN as a nuclear power plant (Xia et al., 2002). The kinematical structure of this northern source has been well studied at various resolutions using [O III], HI, CO, and OH line emission. These observations give evidence of a disk-like structure of less than 800 mas in size (Colina et al., 1999; Schmelz et al., 1988; Downes & Solomon, 1998; Schmelz et al., 1987).
The southern Seyfert 2 source shows enhanced emission in the near-infrared (NIR), only soft X-ray emission, and almost no emission in the radio, which indicates either another dust enshrouded AGN or the possible interaction region of an ionization cone of the northern nucleus (Knapen et al., 1997; Xia et al., 2002). Radio observations of the central part of Mrk 273 reveal one additional object to the south-east of the northern nucleus, which has no NIR counterpart and no hard X-ray emission. However, this source does show a distinct jet-like morphology in the radio and displays faint HI absorption and CO emission indicating a possibly outflow from one additional nucleus into the surrounding ISM (Knapen et al., 1997; Downes & Solomon, 1998; Carilli & Taylor, 2000).
New WSRT and EVN observations of the OH line and the continuum emission in the Megamaser galaxy Mrk 273 are presented in this paper. The OH emission structure at the northern nucleus and the continuum structure are used to understand the kinematics and the physical properties of the environment in the nuclear region.
2 Observations and data reduction
The hydroxyl line- and continuum emission in Mrk 273 was observed with the Westerbork Synthesis Radio Telescope [WSRT] and the European VLBI Network [EVN]. The observations reveal structures spanning scale sizes of about three orders of magnitude ranging from galactic to nuclear scales.
The WSRT observations were made on 7 February 2002 with two hours of on-source observations and respectively 3 and 4 min on the calibrator 3C 286 at the beginning and the end of the on-source observation. The dual polarization line observations had a bandwidth of 20 MHz using a rest frequency between the two hydroxyl main lines (1666 MHz) and a heliocentric velocity of 11326 km s-1. The set-up with 256 channels gave a velocity coverage of about 3734 km s-1 and a velocity resolution of about 14.6 km s-1 per channel. At the source distance, the OH emission lines are red-shifted out of the protected band and into the band where the GLONASS global positioning satellite system operates. As a result considerable radio frequency interference (RFI) was encountered in the measurements. The cross correlation products produced by the WSRT interferometer were used to eliminate the influence of RFI on the data. The amplitude and gain calibrations were performed after applying the Tsys measurements to the data. The RFI-affected data set of the calibrator source was excised iteratively with an automated calibration and flagging procedure based on individual tasks from the Astronomical Imaging Processing System [AIPS]. After final editing of the calibrator, the phases and the band-pass corrections (frequency dependent gains) were used to calibrate the dataset of the target source. Final RFI excising of the data of the target source was performed using the same automatic excising method (for a detailed description see Klöckner, 2004). Observations of a few hours with the east-west WSRT array result in a relatively poor UV-coverage and detailed imaging was not carried out using this dataset. After applying all corrections to the data set of the program source, a Total-Power emission spectrum was produced from the data in the UV plane (see Fig. 3).
The EVN observations of Mrk 273 were made on 10 February 2000 using seven antennae Effelsberg, Onsala [85 ft], Jodrell Bank [Lovell], Medicina, Noto, Torun and the phased WSRT array. Due to weather and technical problems only half of the scheduled 12 hrs observation have been used. The data were processed with the correlator at the Joint Institute for VLBI in Europe [JIVE] in Dwingeloo. To observe both OH main-line emissions (1667 and 1665 MHz), the band pass was centred at a mid frequency of 1666.38 MHz and assuming a optical heliocentric velocity of 11350 km s-1. The observations used a total bandwidth of 8 MHz covering a velocity range of 1494 km s-1 in two polarizations, 256 channels and 2 bit correlation, which leads to a velocity resolution of 5.8 km s-1 per channel in the source rest frame. The observation was performed in phase referencing mode, using a 13 minute (10 + 3 minutes) cycle to cover the target source Mrk 273 and the phase-calibrator source J 13375501. The projected telescope spacings lead to a synthesized beam width of minimal 30 mas. Data reduction and analysis was performed using AIPS in combination with routines from the Groningen Image Processing System [GIPSY]. Before standard calibration of the UV-dataset were performed, new accurate positions were applied for those telescopes that are not part of the geodetic network (Charlot et al., 2002). The observational data was a-priori gain calibrated by using the system temperatures measured at each individual telescope. The phases were then calibrated by initial fringe finding followed by a full self-calibration procedure on the phase calibrator. The bandpass of the system was calibrated by using the phase-calibrator source, because no simultaneous measurement at all telescopes of the scheduled band pass calibrator (3C 286) had been recorded. Further improvement of the calibration could be achieved by performing an additional self-calibration procedure on the channel with the highest line flux and applying these phase corrections to the other channels. Imaging of the line and continuum emission was produced after applying the final calibration to all channels in the UV-dataset.
3 Results
3.1 Radio continuum

The low-resolution (14″) continuum flux density at 1660 MHz was obtained from the off-line emission in the WSRT spectrum to be 102 mJy. This value is 13 to 22 percent lower than the catalogued estimates of the NVSS and the FIRST databases at 1.4 GHz. Although the catalogue images display unresolved point sources, they also show differences in continuum flux densities on scale sizes between their spatial resolution of 5.4″ and 45″. This could indicate the presence of a low brightness temperature continuum structure on a scale size between these spatial resolutions. The flux discrepancy with the WSRT observations could indicate a steep spectral index of Mrk 273 or it is caused by the influence of RFI, which would lead to an increase of the system temperature and a reduction of the continuum level. The low resolution NVSS radio data was compared with the catalogued infrared emission. The resulting q-value defined as log (LFIR/Lradio) of 2.28 is slightly lower than the values typically seen in star-forming galaxies, which indicates that any radio core and radio jet or lobe component only make a minor contribution to the total radio emission of Mrk 273 (Yun et al., 2001).
The complex continuum structure in the central region of 1 square degree of Mrk 273 has been studied in previous observations. The continuum structure presented in Fig. 1 displays multiple sources matching the known northern and south-eastern structures in the nuclear region (natural weighted data set of 7147 mas resolution). The south-eastern component splits into a marginally resolved triple source at position angle PA 25∘. In the uniform weighted map at a slightly higher resolution of 4134 mas, the southern source of this triple structure reveals two emission components, whereas the northern source remains unresolved. The observed emission structures are consistent with existing VLBA observations of the south-eastern region (1.3 GHz) at somewhat lower resolution of 50 mas (Carilli & Taylor, 2000). Therefore, the EVN data partially trace the organized structure of the southeast source comprising an amorphous double jet of 370 mas in extent. The central source has a brightness temperature on the order of 105 K, and is characterized by a relatively flat spectral index (, F) between 1.6 and 5 GHz of 0.260.05 (5 GHz data taken from Knapen et al., 1997). Similar values have been found in a sample of ULIRGs, which suggests that synchrotron emission could be the dominant emission process in such sources (Crawford et al., 1996).
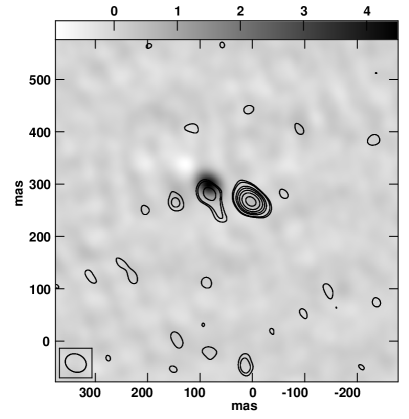
The continuum emission in the northern source of the nuclear region in Mrk 273 shows an east-west elongated structure of 213 mas in size (Fig. 1). At the resolution of 4131 mas, the northern radio emission (Fig. 2) splits into two components spatially separated by 77 mas in east-west direction. Each component shows a brightness temperature on the order of 105 K. The western component is somewhat brighter and slightly extended towards PA = 33∘, whereas the emission at the eastern component fades towards the south. Similar characteristics for both continuum components have been found with the VLBA + VLA at 1.3 GHz, which have a slightly higher brightness temperature (Carilli & Taylor, 2000). Observations at 5 GHz with the MERLIN array, with a resolution that is almost comparable to that of the present EVN data, show enhanced continuum emission at the eastern source as compared with the western source, which trend is also seen in the NIR emission (Carilli & Taylor, 2000; Knapen et al., 1997). The spectral index of both continuum sources is rather different between 1.6 and 5 GHz with values of and , respectively. The flat spectrum suggests purely thermal emission possibly caused by photo-ionization of the ISM by star formation. While a steep spectrum at the eastern source would indicate free-free absorption of the thermal emission or the synchrotron emission, the radio continuum at these frequencies does not provide clear clues of the nature of the nuclear engine (Condon, 1992). Comparing the structures observed with the EVN with images obtained by the VLBA + VLA array at 1.3 GHz shows that these EVN observations, even with very poor UV-coverage at short baselines, trace the inner part of the structures in the northern nucleus of Mrk 273 (see Fig. 2 in Carilli & Taylor, 2000). The VLBA+VLA datashow both sources to be embedded in a diffuse emission structure extending over 500300 mas.
3.2 The line emission
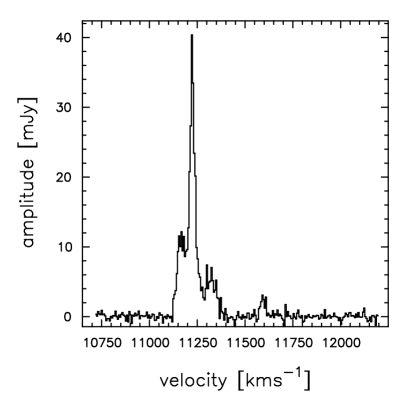
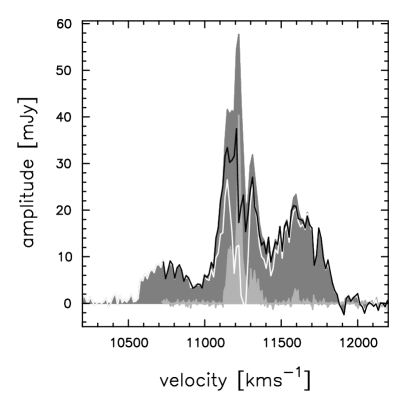
It has become known that for extragalactic OH maser sources only a small fraction of the total OH emission can be detected by observations at parsec resolution. The high resolution EVN measurements for Mrk 273 reveal only 12 percent of the hydroxyl emission at low resolution obtained using the WSRT (Fig. 3 and Fig. 4). A detailed comparison of the individual line emission component presented in Fig. 7 shows that the central 1667 MHz line may account for some 85% of the EVN data, whereas the broader emission features could not be recovered at all. The properties of the individual line emission components have been listed in Table 1.
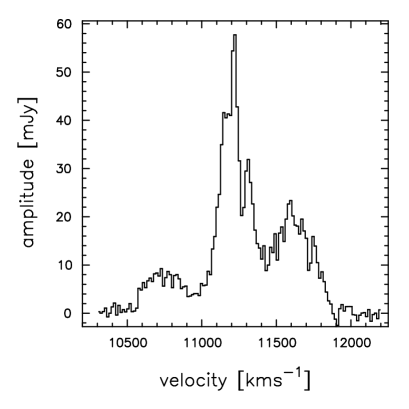
Extragalactic hydroxyl masers generally show dominant 1667 MHz emission and are accompanied by weak (or sometimes non-existent) 1665 MHz line emission. At low resolution the OH spectrum shows three features covering a total velocity range of 1257 km s-1. Such exceptional velocity ranges have also been seen in other Megamaser galaxies that are characterized by a violent circum-nuclear environment such as Arp 220, IRAS 140700525, and III Zw 35 (Baan et al., 1989, 1992; Pihlström et al., 2001). The large velocity range of the observed hydroxyl emission at WSRT scales complicates the identification of individual line features with one of the hydroxyl transitions. The theoretical velocity offset of both maser lines is 365.6 km s-1 at the assumed redshift of Mrk 273 of 0.03778 and in the reference frame of the 1667 MHz line. Therefore, line features up to about 11400 km s-1 will certainly be 1667 MHz features, whereas the line features around 11600 km s-1 could be associated with the 1665 MHz OH main line. The WSRT spectrum indicates a 1667/1665 MHz main-line ratio of about 1.7, which is close to the 1.8 local-thermodynamic-equilibrium (LTE) value.
The line emission feature at the lowest velocity has been seen in the early observation but has not been identified as such in the literature222Not taking this particular line emission feature into account in the observational set-up will cause systematic errors for the kinematics and the OH content of low resolution investigations of the hydroxyl emission in Mrk 273. (first detected by Staveley-Smith et al., 1992). This component centred at 10773 km s-1 and with a width of about 380 km s-1 complicates the interpretation of the maser emission as it highlights gas at a non-systemic velocity. The sub-structure of the main emission line at a velocity of around 11200 km s-1 shows three distinct components. The broad feature at 11600 km s-1 has a line width of 334 km s-1 (FWHM), which is incidentally of the same order of magnitude as that of the broad line at 10773 km s-1.
The EVN measurements in Fig. 4 show a less complicated emission spectrum because some of the broad emission has disappeared and the emission features can be easily associated with the two hydroxyl transitions. The velocity range of the emission at this resolution is 484 km s-1, which is one third of the observed velocity range at WSRT resolution. The spectrum displays strong emission features at 11200 km s-1 associated with the 1667 MHz line and a weak emission line at 11600 km s-1. The clear triple structure of the strong 1667 MHz emission changes dramatically as the fluxes of the f2 and f4 features are reduced at higher resolution (Table 1). The weak emission feature (f5) at 11600 km s-1 can be identified as 1665 MHz emission using the velocity offset of 369.9 km s-1 relative to the strongest 1667 MHz line feature f3.
| WSRT | EVN | |||
|---|---|---|---|---|
| – f1 component – | ||||
| center velocityf1 | [ km s-1] | 10773.3 | ||
| peak fluxf1 | [mJy] | 7.840.57 | ||
| FWHMf1 | [ km s-1] | 378.84 36.05 | ||
| Lf1 | [L] | 106.9912.78 | ||
| – f2 component – | ||||
| center velocityf2 | [ km s-1] | 11161.8 | 11168.0 | |
| peak fluxf2 | [mJy] | 39.341.00 | 11.630.43 | |
| FWHMf2 | [ km s-1] | 128.644.44 | 51.792.75 | |
| Lf2 | [L] | 195.418.38 | 23.281.51 | |
| – f3 component – | ||||
| center velocityf3 | [ km s-1] | 11223.3 | 11224.4 | |
| peak fluxf3 | [mJy] | 33.741.74 | 33.930.67 | |
| FWHMf3 | [ km s-1] | 44.42.70 | 29.90.77 | |
| Lf3 | [L] | 58.474.66 | 39.601.23 | |
| – f4 component – | ||||
| center velocityf4 | [ km s-1] | 11314.2 | 11299.8 | |
| peak fluxf4 | [mJy] | 25.801.16 | 5.240.28 | |
| FWHMf4 | [ km s-1] | 90.975.57 | 114.8611.23 | |
| Lf4 | [L] | 93.057.07 | 0.920.27 | |
| – f5 component – | ||||
| center velocityf5 | [ km s-1] | 11594.6 | 11594.3 | |
| peak fluxf5 | [mJy] | 19.760.60 | 2.710.51 | |
| FWHMf5 | [ km s-1] | 334.5614.16 | 30.886.75 | |
| Lf5 | [L] | 274.8714.32 | 3.481.00 |
At a spatial resolution of a few milli-arcsec of the EVN data, the OH emission has been found exclusively toward the northern source of the nuclear region in Mrk 273 (see Fig. 2).
The OH emission structure has an extent of 146 mas and partially covers the eastern continuum component. A marginal (3.5 ) line emission component at 11326 km s-1 and a line width of 54 km s-1 (FWHM) has been detected toward the western continuum component. The centroid of the line emission at the eastern source is displaced about 23.2 mas towards the north relative to the continuum emission (Fig. 5). There is an asymmetry in the intensity of the line features f2 and f4 that is most likely caused by the association of feature f2 with the northern part of the continuum emission serving as a background for maser amplification. A comparison of the properties of the individual OH line components in table 1 shows that the EVN data accurately traces the most compact and dominant OH emission seen towards Mrk 273.
4 Discussion
4.1 Understanding the hydroxyl emission
The hydroxyl emission in Mrk 273 displays characteristics that are typical of extragalactic OH Megamaser sources, where at high spatial resolution only a small fraction of the low resolution hydroxyl emission is detected (Lonsdale et al., 1998; Diamond et al., 1999; Klöckner et al., 2003). The excitation mechanism of the OH molecules in Mrk 273 is most likely a radiative pump provided by the infrared radiation field similar to the conclusions for other OH-MM (Baan, 1989; Henkel & Wilson, 1990; Skinner et al., 1997).
Mrk 273 exhibits two distinct near-infrared emission regions at arcsec-scales (south-west and north) with slightly stronger emission towards the northern nuclear source where also the OH emission has been detected (Knapen et al., 1997). By using the ratios of the individual near-infrared measurements of the two sources in in Mrk 273, the infrared excess seen towards the northern source is estimated to be 5.96 L⊙. Considering the spectral width of the OH emission (e.g. rOH= 6.73 MHz) and the applying this to the infrared emission (rFIR), a lower limit of the OH pumping efficiency can be estimated using the following ratio:
| (1) |
where LOH and LFIR are the luminosities. The large scale OH emission in Mrk 273 shows a pump efficiency of the order of 0.29 percent. An upper limit for the efficiency of 0.40 % can be found by using the maximum infrared flux of the pump transition being closest to the black body peak and the maximum peak flux of the observed OH line emission (for the OH transitions see: Destombes et al., 1977). Nevertheless, in both cases the low pump efficiency indicates an unsaturated maser process. Because the maser emission would be saturated if every available pumping event (in this case a infrared photon) produces a maser photon with an efficiency that depends only on the details of the pumping scheme (see page 81: Elitzur, 1992). Saturation would occur when the measure of amplification by the maser process directly affects the pumping efficiency. The ratio of the maser intensity at with saturation takes place in the 1667 MHz hydroxyl line is about unity:
| (2) |
where Isat is the intensity at saturation of the maser, Iunsat is the unsaturated maser intensity, A the Einstein coefficient of the 1667 MHz transition, POH is the efficiency as defined above, and is the loss rate. The loss rate is generally of the same order as the collision rate. For OH in HI regions, it has been shown that the OH-ion interaction is the most important collision process, which leads to a collision rate of NHI, where NHI is the hydrogen density (Rogers & Barrett, 1968). The hydrogen density is not generally known but it can be estimated using the molecular hydrogen abundance. The abundance of the molecular hydrogen has been dynamically modeled for Mrk 273 to be 1860 H2 molecules per cm-3 in the northern nucleus (Downes & Solomon, 1998). The relative abundance of HI to molecular hydrogen is assumed to be similar to the galactic value of 20 (valid for the inner 300 pc in the Milky Way; Güsten, 1989). For a saturation ratio = 1, the natural logarithm of the gain threshold for maser amplification in Mrk 273 as expressed in Eqs. 2 is 10.8; above this value saturated maser emission is expected. The saturation parameter can be estimated observationally by determining the optical depth form either the maser main-lines or one maser line in combination with the continuum emission (for an explanation see Henkel & Wilson, 1990; Goss, 1968). Since a clear separation of the two OH main lines is not possible for the WSRT observation, an upper limit on the gain of 0.43 can be estimated using the continuum and the peak flux of 0.43 of the 1667 MHz line emission. An additional constraint on the amplification process can be made using the low resolution WSRT OH data and assuming that the radio continuum observed in the northern source serves as a background for the more diffuse OH emission, which is missed at the resolution of the EVN. The continuum mission in the northern source in Mrk 273 has been imaged in detail with the VLBA, showing a diffuse continuum structure being punctuated by a number of compact sources (SNRs) with brightness temperatures larger than 3 K (Carilli & Taylor, 2000). The maximal brightness temperature of the diffuse maser emission can be estimated from the missing line emission features in the EVN data and the corresponding features in the MERLIN observation (Yates et al., 2000). The diffuse maser emission that is not seen by the EVN observations accounts for brightness temperatures of the order of 4 K. Within the classical OH maser amplification model, these assumptions suggest a maximal gain of about 2.01, which is significantly lower than the estimated saturation threshold (Baan, 1989, 1985; Baan et al., 1982).
A further constraint on the nature of the maser emission follows from evaluating the level populations to estimate the main-line ratios. Since the excitation mechanism of the OH molecules is most likely radiative pumping, the integrated infrared emission field determines the OH main-line ratio. Assuming a spectral-temperature of a single black-body or a single grey-body, the population in the OH ground level () follows from the population cascade of the rotational and vibrational levels (Destombes et al., 1977). By solving the rate equations for the individual levels up to J = 9/2, a gray-body temperature of 63 K and a black-body temperature of 68 K suggest a main-line ratio ranging from 1.98 or 3.00, respectively (note that for the gray body estimate additional infrared data has been used from Klaas et al., 2001). It has been mentioned that the extreme kinematics in Mrk 273 will affect the diffuse OH main-line emission and the main-line ratio, which may lead to systematic errors. Nevertheless, the velocity difference of the individual f3 and f5 features suggests that these are a line pair. At low resolution their line ration is 1.71 (see table 1), which is close to the LTE value of 1.8 and can not be explained by an infrared pumping scheme. At high resolution in the EVN data, the main line ratio is 12.5 based on a clear identification of both OH lines, which is a value that cannot be produced by the infrared radiation field with a single spectral temperature. Therefore, in order to obtain a detailed model of the observed line ratios, detailed modelling of the radiation field and of the level populations needs to be employed, which will be done elsewhere. The overall maser emission process can thus be further constrained to be an unsaturated maser, because for a saturated maser the process would only depend on the details of the infrared pumping scheme.
The OH emission at EVN resolution as shown in Fig. 2 only shows enhanced maser emission at the eastern source, where the NIR emission is a factor 2 stronger relative to the western source (Knapen et al., 1997). Since the dominant pumping lines of the OH molecule fall in the NIR, a strong OH maser versus FIR dependence could be expected. A similar connection has been found for Arp 220, where a diffuse emission structure follows the NIR intensity contours (Baan & Haschick, 1984). The spatial distribution of the continuum emission and of the OH emission suggests that the diffuse continuum emission serves as a background for the amplification. The difference in intensity of the f3 and f4 1667 MHz line features is possibly caused by the difference in background continuum at these locations. The location of the individual line features with respect to this continuum emission follows from the velocity field shown in Fig. 5.
A clear discrimination of the OH main-lines and still small systematic errors in determining the line ratios may lead to an accurate estimate of the OH column density. Assuming that both main-line components f3 and f5 and the continuum originate along the same line of sight, the optical depth of the OH can be estimated to be = 3.20, which corresponds to a column density of (for explanation see Goss, 1968). An estimate of the optical depth also follows from a comparison of the continuum emission and the properties of f3 leading to the apparent optical depth of 4.30 (the different ways of estimating the optical depth are described in Henkel & Wilson, 1990). Combining these estimates for the optical depth suggests a covering factor of 0.32, that accounts for how much the OH emission clouds cover the underlying continuum emission. Altogether, the pumping efficiency, the infrared emission, the optical depth, and the estimate of the saturation threshold indicate that the hydroxyl emission in Mrk 273 is spatially extended between a thousand and a few tens of parsecs and is explained by an unsaturated maser emission process.
4.2 The nuclear kinematics
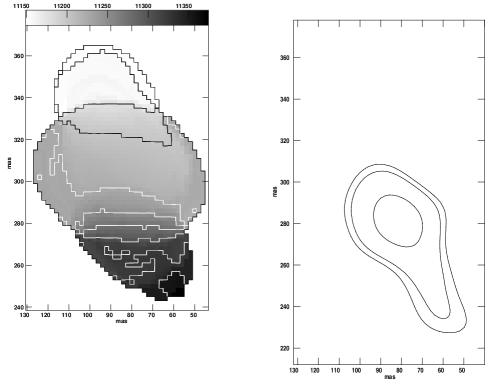
The combination of OH data from the EVN and the WSRT traces the hierarchical structure of the circum-nuclear environment from a few tens of parsec up to kilo parsec scales in the northern nucleus of Mrk 273. The kinematical pattern has been imaged using several molecular tracers leading to a gas disk hypothesis for the northern nucleus (Cole et al., 1999; Downes & Solomon, 1998). In particular, MERLIN imaging of the neutral hydrogen absorption at spatial resolution of 200 mas shows a nuclear disk of about 800 mas in extent. The kinematics of this disk is explained by solid-body rotation with an velocity gradient of about 1.390.003 km s-1 per mas (1.88 km s-1 pc-1) in east-west direction (Cole et al., 1999). On the other hand, MERLIN data of the OH emission at a similar resolution displays a rather complicated picture in which individual maser clumps do not provide any clear indication of a disk structure at similar scale sizes (Yates et al., 2000). At a resolution comparable to that of the EVN observations (see Fig. 5), the VLBA HI data show that the northern nucleus is spatially resolved showing a 500 300 mas extended disk traced by HI in absorption with a slightly lower velocity gradient of 1.5 km s-1 per mas (2.0 km s-1 pc-1) east-west direction than the OH and with an apparent flattening of the velocity at larger radii (Carilli & Taylor, 2000). The OH emission in the current EVN data is unexpectedly different from the earlier data in that the velocity gradient is north-south along the major axis of the emission (Fig. 2). Apparently the OH traces a sub-structure in the nuclear region that has emission velocities similar to those of the HI at lower resolution. At the location where the OH emission indicates a clear north-south gradient (see Fig. 5), the HI absorption shows a flaring velocity field associated with distinctly different kinematics.
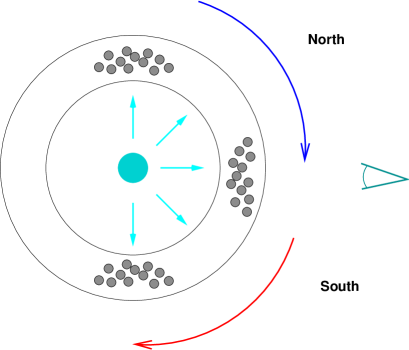
The kinematical pattern of the OH line emission is shown in the position-velocity (PV) diagram in Fig. 6 and displays two almost similar velocity patterns for each of the OH main-lines transitions. The features at the bottom of the PV-diagram represent the three major components of the 1667 MHz line as seen in Fig. 4. The velocity structure shows an organized velocity field of Keplerian rotation around a central object with no evidence of flattening at larger distances. The spatial extent and the overall north-south velocity leads to a gradient of 1.62 0.37 km s-1 per mas (2.19 km s-1 pc-1), which is of the same order of magnitude as the MERLIN and VLBA estimates for the east-west gradient in HI. The same velocity pattern repeats with significantly lower intensity in the upper part of the PV-diagram, where the 1665 MHz line is found.

The specific emission pattern of the OH emission (in particular of the 1667 MHz line) with a bright centre feature and two weaker components at the edges is related to the maser amplification itself. We note that the relative amplification of the maser emission is proportional to the ratio of the OH column density over the OH velocity dispersion (e.g. see: Greenhill et al., 1995). In order to simulate the representative emission pattern seen in the EVN spectrum in Fig. 4, a 3-dimensional disk and torus geometrical structure has been modelled in order to solve for the line-of-sight maser amplification. In these geometries the amplification is calculated on the basis of randomly distributed maser clouds within the disk. To produces the smooth emission line spectrum that is common for all OH Megamaser galaxies, each individual OH cloud needs to be extended and exhibit internal velocity dispersion or turbulence. For a 107.9 pc (146 mas) extended structure and an enclosed mass on the order of M⊙, the kinematics of a solid body rotation, suggested by the HI absorption measurements (Cole et al., 1999), does not account for the spectral signature and the velocity range traced by the observed line features f2, f3, and f4. The specific triple structure of the OH 1667 MHz line emission can only be reproduced by either a disk or a torus structure with Keplerian kinematics and seen almost edge-on with deviations in the inclination of less then 10∘ (for the dependence of the spectral signature of maser emission on geometry and the line-of-sight, see Klöckner, 2004).
Therefore, the OH emission line traced by the EVN observations is explained by an almost edge-on disk or torus with Keplerian kinematics placed at PA= 15∘ of the eastern source in the northern nucleus of Mrk 273.
At larger scale sizes the MERLIN data of the OH emission show no clear kinematical pattern. On the other hand, the WSRT spectrum (Fig. 3) shows an emission feature (f1) blue-shifted by about 450 km s-1. The presence of this feature could indicate a more disturbed environment and may explain the complicated emission pattern in the MERLIN data. Because of the large velocity range of the OH emission this feature did not get recognized in earlier observations. Since no imaging data of this OH feature is available, only an indirect comparison with optical spectroscopy could be made. The OIII line emission shows two distinct lines with different energetics at the northern nucleus (note that the spatial resolution of the reported observations is about 0.9 ″, Colina et al., 1999). One OIII component indicates a highly ionized gas phase with a rather disturbed velocity field and velocity components predominantly 600 km s-1 blue-shifted. This velocity shift is almost in agreement with the velocity difference seen for the OH feature f1 traced by the OH emission. The other OIII line component indicates low-excitation gas that traces a rather organized velocity field oriented in east-west direction. The orientation and the velocity range of about 2400 km s-1 indicate that this line traces nuclear kinematics similar to those derived by radio observations at comparable resolution (Colina et al., 1999; Cole et al., 1999).
The OH emission seen in Mrk 273 is possibly associated with both the
high and the low energy gas phase in the northern nucleus. The broad
blue-shifted OH and optical emission lines are most likely associated
with a starburst driven molecular outflow. Such a scenario has been
proposed and observed in other OH Megamaser sources such as Arp 220 or
III Zw 35 (Baan et al., 1989). If a molecular outflow takes
place, the OH molecules must be contained in some dusty layer
expanding from the nuclear starburst traced in the radio continuum
(Carilli & Taylor, 2000). The symmetry of the residual spectrum
seen in Fig. 7, where the EVN emission is subtracted
from the WSRT emission spectrum would then account for the diffuse OH
component on scale sizes of a few hundreds of parsec. The kinematics,
the source extent, and the enclosed mass estimates of the HI
absorption lines can be used to model the line-of-sight amplification
of the maser clouds embedded in a circular layer and their spectral
signature. Such a setup results into two distinct spectral line
features at both edges of the spectrum, each having a velocity
dispersion of a few hundreds km s-1 and covering a similar velocity
range as the residual OH emission
(Fig. 7). Therefore, the OH spectrum at velocities
higher than systemic would show a superposition of both OH main-lines
(see Fig. 3) and would explain the complicated OH
velocity pattern seen at MERLIN resolution.
5 Conclusions
The flux density of the central line emission features of the single-dish emission of Mrk 273 has been mostly recovered in a region of around 108 pc at the eastern of the northern radio components. The distinct velocity pattern and spectral shape of the maser spectrum indicates that the emission originate in an almost edge-on disk or torus covering the radio source. Observational data from various wavelength regimes do not yet provide a completely consistent picture of the nature of the nuclear power plant in the northern nucleus.
In the infrared, the total extent of the northern nucleus can be determined by either a single gray-body emission area of about 418 pc or a blackbody emission area of about 340 pc. These estimates are remarkably consistent with the maximum extent of 370 pc found for the radio continuum by the VLBA array and suggest that star-formation is taking place on these scale sizes (Carilli & Taylor, 2000). In addition, EVN observation and other at higher resolution show a distinct region of enhanced continuum emission located in the central part in the northern nucleus of maximal 157 pc in extent. The combined presence of these two distinct morphologies indicates that both a starburst and an active galactic nucleus are present in the northern nucleus of Mrk 273, which is optically classified as a LINER 1. In addition, the northern nucleus shows exclusively hard X-ray emission indicating either a heavily obscured high-luminosity AGN or a low-luminosity AGN that mimics a LINER 1 spectrum with photo-ionization due to hard photons (Terashima et al., 2000). The HI column density that is required to block the entire soft X-ray emission towards the northern region is 4.1 1023 cm-2, which is quite similar to estimates in the mid-infrared bands of 1023 cm-2 (Xia et al., 2002). Nevertheless, the HI column density seen towards the individual continuum components in the northern region is significantly lower with a value of T 1020 cm-2. These estimates could only be similar for an unlikely spin temperature of about 2300 K, which is an order of magnitude higher that the estimates of spin temperatures based on a galactic gas-to-dust ratio and an optical extinction similar to those detected in NGC 4945 or SgrA∗ (Xia et al., 2002; Carilli & Taylor, 2000). On the other hand, the OH column density N observed towards the north-eastern source and the standard galactic HI to OH abundance ratio implies a low line-of-sight obscuration (Mann & Williams, 1980). Therefore, the OH maser emission combined with the steep radio spectral index indicates the presence of a low luminosity AGN seen through a highly ionized screen at the northern nucleus. The binding mass of the central object in the north-eastern component is determined by Keplerian kinematics and is on the order of M⊙. This is two orders of magnitudes larger than the binding mass traced by the H2O Megamaser emission in the galaxy NGC 4258 (Greenhill et al., 1995).
The spatial structure, spectral signature, and velocity pattern of the OH emission in Mrk 273 at resolution of a few tens of parsec clearly reveal an edge-on disk with Keplerian kinematics in the northern nucleus. The distinct velocity pattern of the disk would represent a kinetically independent structure in this nucleus, which does not agree with the presence of an east-west elongated nuclear disk or torus as traced by HI in absorption in the northern region (Cole et al., 1999). However, the observed OH velocity gradient is comparable to the gradient of the HI absorption, which shows evidence for solid-body rotation and appears non-consistent with the other evidence. Alternatively, this component could also be explained by radial outflow.
The missing maser emission between the WSRT and the EVN observations accounts for 80 percent of the total OH emission in Mrk 273. Corresponding line features in the MERLIN observations show that the OH emission traces a complex and disturbed velocity structure at larger scale sizes (Knapen et al., 1997). The question remains whether the velocity field of the large scale HI absorption signifies rotation or radial outflow. Alternatively the western component of the northern nucleus, with its marginal narrow OH emission component, its broad HI absorption feature, and its thermal spectral index, may be interpreted as a region with enhanced star formation rather than a second nucleus (Carilli & Taylor, 2000).
The favored scenario for the northern nucleus is a combination of
star-formation that produces starburst driven winds, resulting in high
offset line features, and a low luminosity AGN obscured by a dusty
disk of 108 pc in extent producing a highly disturbed gas region that
mimics a LINER spectrum. It should be noted that the hydroxyl maser
emission in Mrk 273 shows no saturation effects at kilo parsec and
parsec scale sizes. This is in contrast with the compact maser
components discovered in high-resolution observations of other bright
OH Megamaser sources, such as Arp 220, IRAS 172080014, and
III Zw 35 (Lonsdale et al., 1998; Diamond et al., 1999). In there
sources saturation and non-saturation has been concluded on the basis
of the compactness of the OH emission with respect to the
continuum. The current EVN observations show for the first time that
compact OH emission does remain unsaturated. It has also been shown
that the total OH maser emission at galactic size scales results from
an unsaturated maser process working with a pumping efficiency of only
a few one-thousands. Such low conversion efficiencies have been found
for most of the OH Megamaser galaxies, which indicates that saturation
effects may not play a significant role after all and support a
Megamaser model based on amplification of background radio continuum
by foreground molecular gas
(Baan, 1985, 1989; Klöckner, 2004).
Acknowledgements.
The European VLBI Network is a joint facility of European, Chinese, South African and other radio astronomy institutes funded by their national research councils. The Westerbork Synthesis Radio Telescope is operated by the ASTRON (Netherlands Foundation for Research in Astronomy) with support from the Netherlands Foundation for Scientific Research (NWO). The authors thank M. Elitzur for fruitful discussions on maser emission.References
- Baan (1985) Baan W.A.: 1985, Nature 315, 26
- Baan (1989) Baan W.A.: 1989, ApJ 338, 804
- Baan & Haschick (1984) Baan W.A., Haschick A.D.: 1984, ApJ 279, 541
- Baan et al. (1989) Baan W.A., Haschick A.D., Henkel C.: 1989, ApJ 346, 680
- Baan et al. (1992) Baan W.A., Rhoads J., Fisher K., Altschuler D.R., Haschik A.: 1992, ApJ Lett. 396, L99
- Baan et al. (1982) Baan W.A., Wood P.A.D., Haschick A.D.: 1982, ApJ Lett. 260, L49
- Carilli & Taylor (2000) Carilli C.L., Taylor G.B.: 2000, ApJ Lett. 532, L95
- Charlot et al. (2002) Charlot P., Campbell R.M., Alef W., et al.: 2002, In: Proceedings of the 5th European VLBI Network Symposium, Gustav- -Stresemann–Institut, Bonn, Gemany, eds. E. Ros, R.W. Porcas, A.P. Lobanov, J. A. Zensus, p. 9
- Cole et al. (1999) Cole G.H.J., Pedlar A., Holloway A.J., Mundell C.G.: 1999, MNRAS 310, 1033
- Colina et al. (1999) Colina L., Arribas S., Borne K.D.: 1999, ApJ Lett. 527, L13
- Condon (1992) Condon J.J.: 1992, ARA&A 30, 575
- Crawford et al. (1996) Crawford T., Marr J., Partridge B., Strauss M.A.: 1996, ApJ 460, 225
- Destombes et al. (1977) Destombes J.L., Marliere C., Baudry A., Brillet J.: 1977, A&A 60, 55
- Diamond et al. (1999) Diamond P.J., Lonsdale C.J., Lonsdale C.J., Smith H.E.: 1999, ApJ 511, 178
- Downes & Solomon (1998) Downes D., Solomon P.M.: 1998, ApJ 507, 615
- Elitzur (1992) Elitzur M.: 1992, Astronomical masers. Astronomical masers Kluwer Academic Publishers (Astrophysics and Space Science Library. Vol. 170), 365 p.
- Güsten (1989) Güsten R.: 1989, In: IAU Symp. 136: The Center of the Galaxy, pp. 89–+
- Goss (1968) Goss W.M.: 1968, ApJS 15, 131
- Greenhill et al. (1995) Greenhill L.J., Jiang D.R., Moran J.M., et al.: 1995, ApJ 440, 619+
- Henkel & Wilson (1990) Henkel C., Wilson T.L.: 1990, A&A 229, 431
- Klaas et al. (2001) Klaas U., Haas M., Müller S.A.H., et al.: 2001, A&A 379, 823
- Klöckner (2004) Klöckner H.R.: 2004, Ph.D. Thesis; Rijksuniversiteit Groningen
- Klöckner et al. (2003) Klöckner H.R., Baan W.A., Garrett G.A.: 2003, Nature 421, 821
- Klöckner & Baan (2002) Klöckner H.R., Baan W.A.: 2002, In: Proceedings of the 5th European VLBI Network Symposium, Gustav–Stresemann–Institut, Bonn, Gemany, eds. E. Ros, R.W. Porcas, A.P. Lobanov, J. A. Zensus, pp. 175–+
- Klöckner & Baan (2003) Klöckner H.R., Baan W.A.: 2003, In: JENAM 2002 - The unsolved universe:Challenges for the future; , OPorto, Portugal, eds. M.J.P.F.G. Monteiro
- Knapen et al. (1997) Knapen J.H., Laine S., Yates J.A., et al.: 1997, ApJ Lett. 490, L29
- Lonsdale et al. (1998) Lonsdale C.J., Lonsdale C.J., Diamond P.J., Smith H.E.: 1998, ApJ Lett. 493, L13
- Mann & Williams (1980) Mann A.P.C., Williams D.A.: 1980, Nature 283, 721
- Pihlström et al. (2001) Pihlström Y.M., Conway J.E., Booth R.S., Diamond P.J., Polatidis A.G.: 2001, A&A 377, 413
- Rogers & Barrett (1968) Rogers A.E.E., Barrett A.H.: 1968, ApJ 151, 163
- Sanders & Mirabel (1996) Sanders D.B., Mirabel I.F.: 1996, ARA&A 34, 749
- Schmelz et al. (1987) Schmelz J.T., Baan W.A., Haschick A.D.: 1987, ApJ 321, 225
- Schmelz et al. (1988) Schmelz J.T., Baan W.A., Haschick A.D.: 1988, ApJ 329, 142
- Skinner et al. (1997) Skinner C.J., Smith H.A., Sturm E., et al.: 1997, Nature 386, 472
- Staveley-Smith et al. (1992) Staveley-Smith L., Norris R.P., Chapman J.M., et al.: 1992, MNRAS 258, 725
- Terashima et al. (2000) Terashima Y., Ho L.C., Ptak A.F.: 2000, ApJ 539, 161
- Xia et al. (2002) Xia X.Y., Xue S.J., Mao S., et al.: 2002, ApJ 564, 196
- Yates et al. (2000) Yates J.A., Richards A.M.S., Wright M.M., et al.: 2000, MNRAS 317, 28
- Yun et al. (2001) Yun M.S., Reddy N.A., Condon J.J.: 2001, ApJ 554, 803