Identifying a black hole X-ray transient in M31 with XMM-Newton and Chandra
Stochastic variability in two out of four XMM-Newton observations of XMMU J004303+4115 along with its power spectra and X-ray luminosities suggest a low-mass X-ray binary (LMXB) with a black hole primary. However, Chandra observations resolve the object into two point sources. We use data from 35 Chandra observations to analyse the contributions of each source, and attribute the variability to CXOM31 J004303.2+411528 (known as r2-3), which varies in intensity by a factor of 100 between observations. We assume that the power density spectra of LMXBs are governed by the luminosity, and that the transition between types of power density spectra occurs at some critical luminosity in Eddington units, , that applies to all LMXBs. We use results from these XMM-Newton observations and past results from the available literature to estimate this transition luminosity, and find that all results are consistent with 0.1 in the 0.3–10 keV band. CXOM31 J004303.2+411528 exhibits a low accretion rate power density spectrum at a 0.3–10 keV luminosity of 5.31037 erg s-1. Known stellar mass black holes have masses of 4–15 M⊙; hence our observations of CXOM31 J004303.2+411528 are consistent with 0.1 if it has a black hole primary.
Key Words.:
X-rays: general – Galaxies: individual: M31 – X-rays: binaries1 Introduction
| Observation | Date | MJD | Exp | Filter | |
|---|---|---|---|---|---|
| x1 | 25/06/00 (rev0100) | 51720 | 34 ks | Medium | |
| x2 | 27/12/00 (rev0193) | 51906 | 13 ks | Medium | |
| x3 | 29/06/01 (rev0285) | 52089 | 56 ks | Medium | |
| x4 | 06/01/02 (rev0381) | 52280 | 61 ks | Thin |
The Andromeda Galaxy (M31) is an attractive and important target for X-ray astronomy, since it is the nearest spiral galaxy (760 kpc, van den Bergh 2000), and its X-ray emission is dominated by point sources. These point sources are thought to be mostly X-ray binaries, along with a few foreground objects, background active galactic nuclei (AGN), and supernova remnants (SNR). The two most recent X-ray observatories, Chandra and XMM-Newton, have finally allowed studies of variability in extra-galactic X-ray sources over time-scales of a few hundred seconds, as well as between successive observations. Such short-term time variability is often characteristic of well-studied phenomena and sometimes allows classification of the objects from X-ray observations alone, in conjunction with their X-ray spectral properties; for example, thermonuclear X-ray bursts (Lewin et al. 1995) identify an X-ray source as an X-ray binary with a neutron star primary. To date, analysis of the XMM-Newton observations of the core of M31 has resulted in the discovery of a pulsating supersoft source with a period of 865 seconds (Osborne et al. 2001), the periodic dipping of the X-ray counterpart to the globular cluster Bo 158 (Trudolyubov et al. 2002), a persistently bright black hole binary (Barnard et al. 2003a, Paper 1), and a Z-source (Barnard et al. 2003b, Paper 2). Meanwhile Kaaret (2002) identified variability of three sources in a 47 ks Chandra HRC observation of M31, including the black hole binary later identified in Paper 1.
The XMM-Newton and Chandra missions complement each other well; Chandra provides imaging with exceptional spatial resolution, while XMM-Newton is the most sensitive imaging X-ray observatory yet flown. The current work exemplifies how XMM-Newton and Chandra results can be used together to get more detailed information than is possible from either data set alone. XMMU J004303+4115 appears as a point source when observed with XMM-Newton, but is resolved by Chandra into two objects, 6″ apart. Kong et al. (2002) associate CXOM31 J004202.9+411523, the southern source, with the globular cluster Bo 146, and report transient behaviour in CXOM31 J004303.2+411528, the northern source. Following Kong et al. (2002), we designate the northern source r2-3 and the southern source r2-4. We find that in XMM-Newton observations, XMMU J004303+4115 exhibits power density spectra such as are seen in low accretion rate low-mass X-ray binaries (LMXBs), yet at 0.3–10 keV luminosities of 3–121037 erg s-1 (Sect. 3).
Van der Klis (1994, hereafter referred to as vdK94) showed that the power density spectra (PDS) of LMXBs with neutron star or black hole primaries are strikingly similar. At low accretion rates, the PDS of LMXBs have almost identical shapes (approximately broken power laws with the spectral index, , changing from 0 to 1 at frequencies higher than 0.01–1 Hz) and fractional rms amplitudes of a few times 10% (vdK94); we shall refer to these as Type A PDS. At higher accretion rates, LMXBs are considerably less variable, with fractional rms amplitudes of only a few percent, and their PDS are described by power laws with 1–1.5 (vdK94); we will refer to these as Type B PDS. Furthermore, vdK94 proposed that the transition between Type A and Type B PDS occurs at a critical fraction of the Eddington limit. Following vdK94, we define the critical luminosity fraction, , as
| (1) |
where is the luminosity of transition between Type A and Type B PDS, and is the Eddington luminosity.
In Sect. 3 we analyse longterm lightcurves of r2-3 and r2-4 from 35 Chandra observations, paying particular attention to those that were made within 30 days of one of the XMM-Newton observations. If we can associate Type A PDS with either source when its luminosity, , exceeds for a neutron star, we can establish that the primary is a black hole. The most likely candidate for such black hole behaviour is r2-3, since most black hole binaries are transients (e.g. McClintock & Remillard 2003), and globular cluster X-ray sources mostly contain 1.4 M⊙ neutron stars (see Heinke et al. 2003, and references within). We present in Sect. 3 evidence that r2-3 contains a black hole primary.
In Sect. 4 we first establish that r2-3 is located in M31. We then obtain an empirical value for , using results from these XMM-Newton observations of globular cluster sources in M31 and published results from analysis of a Galactic neutron star LMXB and a Galactic black hole LMXB. We then use our value of to calculate for a neutron star with a mass of 3.1 M⊙, the theoretical maximum (Krishan & Kumar 1978). We assert that r2-3 exhibits a Type A PDS at a luminosity that exceeds this limit and conclude that the primary in r2-3 is a black hole, consistent with its transient behaviour.
2 Observations
| Obs. | Date (Obs ID) | MJD | Mode | Exposure | Separation |
|---|---|---|---|---|---|
| c1 | 13/10/99 (303) | 51464 | ACIS-I | 12 ks | |
| c2 | 30/11/99 (267) | 51512 | HRC-I | 1.3 ks | |
| c3 | 11/12/99 (305) | 51523 | ACIS-I | 4.2 ks | |
| c4 | 23/12/99 (268) | 51535 | HRC-I | 5.2 ks | |
| c5 | 27/12/99 (306) | 51539 | ACIS-I | 4.2 ks | |
| c6 | 19/01/00 (269) | 51562 | HRC-I | 1.2 ks | |
| c7 | 29/01/00 (307) | 51572 | ACIS-I | 4.2 ks | |
| c8 | 13/02/00 (270) | 51587 | HRC-I | 1.5 ks | |
| c9 | 16/02/00 (308) | 51590 | ACIS-I | 4.1 ks | |
| c10 | 08/03/00 (271) | 51611 | HRC-I | 2.5 ks | |
| c11∗ | 26/05/00 (272) | 51690 | HRC-I | 1.2 ks | 30 days |
| c12∗ | 01/06/00 (309) | 51696 | ACIS-S | 5.2 ks | 24 days |
| c13∗ | 21/06/00 (273) | 51716 | HRC-I | 1.2 ks | 4 days |
| c14∗ | 02/07/00 (310) | 51727 | ACIS-S | 5.1 ks | +7 days |
| c15 | 29/07/00 (311) | 51754 | ACIS-I | 5.0 ks | |
| c16 | 18/08/00 (275) | 51774 | HRC-I | 1.2 ks | |
| c17 | 27/08/00 (312) | 51783 | ACIS-I | 4.7 ks | |
| c18 | 11/09/00 (276) | 51798 | HRC-I | 1.2 ks | |
| c19 | 12/10/00 (277) | 51829 | HRC-I | 1.2 ks | |
| c20 | 17/11/00 (278) | 51865 | HRC-I | 1.2 ks | |
| c21∗ | 31/11/00 (1912) | 51879 | HRC-I | 47 ks | 27 days |
| c22∗ | 13/12/00 (1581) | 51891 | ACIS-I | 4.5 ks | 15 days |
| c23∗ | 13/01/01 (1854) | 51922 | ACIS-S | 4.8 ks | +16 days |
| c24 | 01/02/01 (1569) | 51941 | HRC-I | 1.2 ks | |
| c25 | 18/02/01 (1582) | 51958 | ACIS-I | 4.4 ks | |
| c26∗ | 10/06/01 (1570) | 52070 | HRC-I | 1.2 ks | 19 days |
| c27∗ | 10/06/01 (1583) | 52070 | ACIS-I | 5.0 ks | 19 days |
| c28 | 31/08/01 (1577) | 52152 | ACIS-I | 5.0 ks | |
| c29 | 09/11/01 (1585) | 52222 | ACIS-I | 5.0 ks | |
| c30 | 19/11/01 (2904) | 52232 | HRC-I | 1.2 ks | |
| c31∗ | 08/01/02 (2897) | 52282 | ACIS-I | 5.0 ks | +1.5 days |
| c32∗ | 16/01/02 (2905) | 52290 | HRC-I | 1.1 ks | +10 days |
| c33 | 02/06/02 (2906) | 52427 | HRC-I | 1.2 ks | |
| c34 | 02/06/02 (2898) | 52427 | ACIS-I | 5.0 ks | |
| c35 | 11/08/02 (4360) | 52497 | ACIS-I | 5.0 ks |
Four XMM-Newton (Jansen et al. 2001) observations were made of the core of M31; details of the observations are given in Table 1. For each observation, 0.3–10 keV lightcurves were extracted from source and background regions for each of the three EPIC instruments: one PN camera (Strüder et al. 2001) and two MOS cameras (Turner et al. 2001). The source region was circular with a radius of 20 and centred on XMMU J004303+4115 while the background region was an equivalent source-free region on the same CCD and at a similar offset from the optical axis. The lightcurves were accumulated with 2.6 second binning. Background-subtracted, summed EPIC lightcurves, were then produced following the procedures laid out in Paper 1. PN energy spectra from the source and background regions in the 0.3–10 keV energy band were also extracted for observations x1–x4, as described in Paper 1. Strong solar flaring contaminated parts of observations x3, restricting the good data to 25 ks.
In order to assess the contributions of the two sources seen with Chandra to the properties of XMMU J004303+4115, we analysed 35 Chandra observations; 15 observations used the ACIS-I configuration, 3 used ACIS-S and 17 were made with the HRC-I. Of these, 11 observations occurred at similar times to the XMM-Newton observations. From the 35 observations, we produced long-term lightcurves for r2-3 and r2-4 in order to study the variability of these objects. In particular, we examined their contributions to the observations close to the XMM-Newton observations, to associate the variability and contributions to the X-ray luminosity with a particular source.

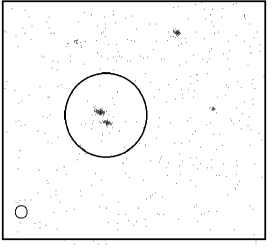
The date, configuration mode and exposure for each Chandra observation are listed in Table 2; particular attention was paid to those Chandra observations within 30 days of an XMM-Newton observation: this interval was chosen to maximise the data available on r2-3 and r2-4 at similar epochs to x1-x4, and is not physically motivated. Chandra lightcurves were extracted in the 0.3–7.0 keV energy band from circular extraction regions with 3 radii around r2-3 and r2-4 for each observation, with 50 second binning. To do this, a binned image was created using dmcopy; ACIS and HRC images were binned by factors of 2 and 10 respectively. Events files were then created in the 0.3–7 keV band for r2-3 and r2-4 with dmcopy, filtering with the relevant extraction region. Finally, lightcurves were created for each source using lightcurve. Lightcurves from nearby, source-free regions of the same size yielded 1 photon per observation, hence the background contribution was negligible. Long-term lightcurves were then constructed for r2-3 and r2-4, representing each observation with a single bin. A detail of the ACIS-I image from observation c15 is presented in Fig. 1; r2-3 and r2-4 are shown, and a circle with a 20 radius is centred between them, defining the source extraction region for the XMM-Newton observations. A 3 circle is shown in the bottom left corner to indicate the size of the extraction regions used in the Chandra observations.
X-ray spectra were extracted from ACIS-I and ACIS-S observations of r2-3 and r2-4 using psextract, which also produced corresponding response matrices and ancillary response files. These spectra were grouped to have a minimum of 15 counts per bin, or 10 counts per bin if the total number of counts 100. No spectra were obtained from HRC-I because it is not designed for spectral work.
3 Results
3.1 XMM–Newton Lightcurves and power density spectra
Lightcurves with 200 second bins of XMMU J004303+4115 from observations x3 and x4 were found to be highly variable; best fit lines of constant intensity to the data were rejected at confidence levels of 0.002% and 510-6% respectively. However, the similarly binned lightcurves from x1 and x2 were not significantly variable over this time scale.
Power density spectra were obtained from the 0.3–10 keV lightcurves of observations x1, x3 and x4, with (10.4 s)-1 resolution and 512 frequency bins, as described in Paper 1. The resulting PDS are presented in Fig. 2; observation x2 was too short to yield useful PDS data. We fitted the PDS with single power laws, and while the PDS of observation x1 is well fitted (/dof = 7.7/9), fits to the PDS of x3 (/dof = 26/9) and x4 (/dof = 64/9) are rejected at levels of 0.2% and 510-6% respectively. We see that a Type B PDS is observed in x1, where the combined EPIC intensity of XMMU J004303+4115 is 0.16 count s-1 in the 0.3–10 keV band and yet a Type A PDS is observed in x4, where its intensity is 0.37 count s-1, i.e. over twice as bright as in x1. We also see a Type A PDS in observation x3, where the intensity is 0.15 count s-1, very similar to the count rate in x1; hence we know that the lack of a broken PDS in x1 is not due to a lack of counts. Since we know that XMMU J004303+4115 is in fact composed of two X-ray sources, we can only understand these observations if the component responsible for the Type A PDS is absent in x1 but present in x3 and x4.
3.2 Energy Spectra
PN spectra of XMMU J004303+4115 from observations x1–x4 were fitted with simple emission models to estimate the 0.3–10 keV flux, and hence the combined luminosity of the two objects. The model consisted of a single power law suffering line-of-sight absorption. Although good fits were obtained, this was not a physically motivated model, it was simply used to estimate the luminosity of the source in the X-ray band. The luminosity of XMMU J004303+4115 ranged over 3.0–12.01037 erg s-1. Details of the fits are given in Table 3. The intensities of XMMU J004303+4115 in observations x1–x4 were converted to Chandra ACIS-I count rates using pimms and the best model parameters.


We then analysed the energy spectra from the Chandra ACIS-I and ACIS-S observations. The line-of-sight absorption was not well constrained and was fixed at 1.01021 atom cm-2, to agree with XMM-Newton values. The spectral index of r2-3 varied over the range 1.6–2.6, while the spectral index of r2-4 ranged over 1.3–2.3. The best fit spectral index, /dof and 0.3-7 keV fluxes are provided for r2-3 and r2-4 in Table 4. There was no significant correlation between spectral index and intensity within the limits of the data, so the mean values were used in converting HRC-I intensities into ACIS-I intensities: spectral indices of 1.780.10 and 1.730.08 were used for r2-3 and r2-4 respectively.
3.3 Longterm lightcurves
The long-term Chandra lightcurves of r2-3 and r2-4 are presented in Fig. 3. The 0.3–7 keV intensities of the ACIS-S observations were converted to 0.3–7 keV ACIS-I intensities with pimms, using the best fit absorbed power law models. Longterm lightcurves of r2-3 and r2-4 are also presented by Williams et al. (2003), scaled to the luminosity. The 1 uncertainties on converting the measured XMM- Newton, HRC-I and ACIS-S intensities to ACIS-I intensities were obtained as follows. pimms was used to obtain the uncertainty in the ACIS-I intensity due to the 1 uncertainty in the spectral index of the original fits. These were added in quadrature to the statistical count rate uncertaintes. We see that the intensity of r2-3 varies by a factor of 100, from 0.0011 to 0.114 count s-1, while r2-4 varies more modestly, from 0.010 to 0.079 count s-1.
The longterm lightcurve of r2-3 is quite unlike the lightcurves of classical black hole LMXBs, which are characterised by short outbursts of activity where the intensity decays exponentially over several weeks, separated by years of quiescence (McClintock & Remillard 2003). Of the Galactic black hole LMXBs, it most resembles GX 3394 (dynamically confirmed as a black hole by Hynes et al. 2003). Zdziarski et al. (2004) present long-term lightcurves of GX 3394 spanning 20 years from the Ginga, RXTE and CGRO satellites; around 15 outbursts were observed, varying dramatically in brightness and duration, and in the separation between outbursts. The behaviour of r2-3 (Fig. 3) is similar to that exhibited by GX 3394 in the interval MJD 50200–51000, where GX 3394 appears to be mostly active, with short intensity dips (Zdziarski et al. 2004).
The longterm lightcurve of r2-4, on the other hand, shows modulation on a 400 day time-scale. It is similar to the longterm RXTE ASM lightcurve of 4U 1820$-$30, an ultracompact neutron star LMXB in a Galactic globular cluster (Stella et al. 1987). This source exhibits brief low intensity states superposed onto cyclical variability on a 170 day period featuring a sharp rise and shallow decay (Šimon 2003).
Obs. b /dof x1 0.6(2) 2.15(15) 3.0(2) 37/34 x2 1.0(2) 1.91(15) 4.4(3) 36/34 x3 1.1(2) 1.98(15) 3.3(2) 16/18 x4 1.4(2) 1.89(15) 12.0(7) 17/34
| a | an absorbed power law model was used, with line-of-sight absorption (in units of 1021 atom cm-2) and spectral index |
|---|---|
| b | 0.3–10 keV luminosity / 1037 erg s-1 |
The ACIS-I equivalent intensities of r2-3 + r2-4 in x1-x4 and the nearby Chandra observations are presented in Fig 4. Table 5 lists the intensities of XMMU J004303+4115 in observations x1–x4 with the individual intensities of r2-3 and r2-4 in neighbouring Chandra observations; the fractional contribution of r2-3 to the total intensity is also given. Observations x3 and x4 have very similar intensities to the neighbouring Chandra observations (within 0.5), so the fractional contributions of r2-3 and r2-4 to these XMM-Newton observations were assumed to be the same as in the nearest Chandra observation. However, the intensity in x1 is well below the intensities of any neighbouring Chandra observation; the intensity dropped by 67% (11) in 24 days then increased by 200% (12) in 7 days. Instead, the intensity and X-ray spectrum of x1 are consistent with that of r2-4 in c13, suggesting that r2-3 has all but disappeared, as in observations c3, c17 and c20 where the significance of detecting r2-3 is 3.
This interpretation is supported by the fact that r2-3 contributed 70% of the intensity in c11 and c12, but only 3513% in c13 (Table 5), rising to 555% in c14. The spectral index, , of r2-3 is 1.70.2 in c12 and c14, while for r2-4, = 2.30.4 in c12 and 1.50.2 in c14. In x1, = 2.150.15, which is considerably softer than in x2–x4 and consistent with that of r2-4 alone. We cannot be sure how the two sources contribute to XMMU J004303+4115 in observation x1, but given the observed trends in observations c12–c14 the most likely explanation of the 11 drop in intensity between c12 and x1 is the fading to invisibility of r2-3.
Observation b /dof b /dof c1 2.1(2) 3.3 11/18 1.7(2) 2.4 13/14 c3 1.4(3) 3.9 16/10 c5 1.9(3) 2.5 16/12 1.5(3) 4.1 20/12 c7 2.1(4) 2.2 6/9 1.8(3) 2.5 6/11 c9 1.7(3) 3.4 15/15 1.5(4) 3.4 12/6 c12 1.7(2) 3.0 20/11 2.3(4) 0.9 6/7 c14 1.7(2) 4.0 11/11 1.5(2) 3.0 10/12 c15 1.6(2) 4.5 11/16 1.8(2) 3.0 12/11 c17 1.6(2) 2.0 11/10 c22 2.2(9) 2.0 4/3 1.9(5) 1.8 3/6 c23 2.6(7) 0.7 1/3 1.6(2) 4.0 4/11 c28 1.8(3) 3.8 8/10 2.2(6) 1.9 10/6 c29 1.5(3) 4.4 6/9 1.4(2) 3.5 11/11 c31 2.1(3) 3.0 11/9 1.3(2) 3.7 13/9 c34 1.9(3) 2.3 6/7 2.3(4) 2.0 8.5/10 c35 2.0(4) 2.7 3/7 1.7(3) 3.5 5/7
| a | an absorbed power law model was used, with line-of-sight absorption = 1.01021 atom cm-2 and spectral index |
|---|---|
| b | 0.3–10 keV luminosity / 1037 erg s-1 |
Observation MJD a a b c c11 51690 0.047(10) 0.017(5) 0.7(2) c12 51696 0.061(3) 0.021(2) 0.74(5) c13 51716 0.017(5) 0.026(8) 0.35(13) x1 51720 0.027(1) c14 51727 0.044(3) 0.037(3) 0.55(5) c21 51879 0.010(1) 0.048(5) 0.17(2) c22 51891 0.015(2) 0.021(3) 0.42(7) x2 51908 0.034(1) c23 51922 0.009(2) 0.036(2) 0.20(5) c26 52070 0.024(8) 0.010(4) 0.7(3) c27 52070 0.017(2) 0.016(2) 0.52(8) x3 52089 0.029(1) x4 52280 0.091(1) c31 52282 0.039(3) 0.049(3) 0.44(4) c32 52290 0.012(5) 0.062(14) 0.16(7)
| a | Equivalent 0.3–7 keV ACIS-I intensity / count s-1 |
|---|---|
| b | = / ( |
| c | = + for observations x1–x4 |
3.4 Overall behaviour
The projected 0.3–10 keV luminosities of r2-3 and r2-4 in observations x1, x3 and x4 are given in Table 6; also, the PDS type is indicated. In observations x3 and x4, where we know that r2-3 contributes, Type A PDS are seen. We argue that r2-3 is absent in observation x1, where a Type B PDS is observed. The Type A PDS observed in x3 could come from either source, since the projected luminosity of r2-4 is half that in observation x1, where the Type B PDS is seen. However, r2-4 could not exhibit a Type B PDS at 31037 erg s-1 and a Type A PDS at 71037 erg s-1, its luminosity in x4. We conclude that the Type A contribution to the PDS of XMMU J004303+4115 in x3 and x4 was made by r2-3, even at a 0.3–10 keV luminosity of 5.30.61037 erg s-1 in x4. We argue in Sect. 4 that a LMXB exhibiting a Type A PDS at such a high luminosity is likely to contain a black hole.

4 Discussion
In diagnosing the nature of r2-3 we first need to be certain that it is indeed within the M31 galaxy. We applied a column density of 1.01021 cm-2 and a spectral index of 1.78 to the HRC-I observations that yielded the maximum and minimum ACIS-I equivalent count rates of r2-3 and obtained a flux range of 0.012–1.410-12 erg cm-2 s-1 in the 0.3–10 keV band using pimms. This corresponds to a luminosity range of 0.08–9.51037 erg s-1 for a location in M31. If it was local, it would be most likely to be within 1 kpc, i.e. 3 times the scale-height of the Galactic disc, since M31 is 21.6 out of the Galactic plane and 120 from the Galactic Centre. In this situation, the luminosity would be 6 orders of magnitude smaller, and hence up to 2 orders of magnitude fainter than the faintest known persistent Galactic LMXB (Wilson et al. 2003). It would also be up to a factor of 3 fainter than the faintest black hole X-ray transient in quiescence (Tomsick et al. 2003, and references within). It is likely that if r2-3 were local, it would have an optical counterpart; known absolute V magnitudes (MV) of persistent Galactic LMXBs range from 2.5 to 5.6 (van Paradijs & McClintock 1995), and the spectral types of the secondary stars in most black hole X-ray transients have been obtained in quiescence (Charles & Coe 2003), with MV 0–9.7. Hence, if r2-3 were local, we would expect to see an optical counterpart with mV 19. However, the nearest optical source in the HST catalogue of Haiman et al. (1994) is 79 away, with a mv = 20.6; hence any optical counterpart to r2-3 would have to be fainter than this. Thus r2-3 is unlikely to be local. In addition, its PDS rules out the possibility that it is a background AGN, as they exhibit spectral breaks at 10-6–10-5 Hz (Uttley et al. 2002) rather than at the 0.03 Hz seen here. We therefore conclude that r2-3 is located in M31.
By showing that we observe a Type A PDS from r2-3 at a luminosity that is too high for a neutron star LMXB we can classify the primary as a black hole. To do this, we must obtain a value for , and assume that this applies to all LMXBs. Then we must show that r2-3 exhibits a Type A PDS at a luminosity greater than for any neutron star.
In the first instance, we looked at seven X-ray sources associated with globular clusters in x4, since they are likely to contain 1.4 M⊙ neutron stars. None of them exhibited Type A PDS; the luminosity range was 2–101037 erg s-1 (Paper 1). Also, a Type B PDS was exhibited by XMMU J004303+4115 in observation x1 at 31037 erg s-1 (which we associate with r2-4 alone, see Sect. 3). These results suggest that 21037 erg s-1; hence 0.1, assuming hydrogen accretion onto a 1.4 M⊙ neutron star.
We obtained a vital clue to from the Galactic neutron star LMXB 4U 1705$-$44. Langmeier et al. (1989) analysed data from four EXOSAT observations of 4U 170544; they found that it exhibited a Type A PDS in the faintest observation but a Type B PDS in the next faintest. In their previous analysis of the observations (Langmeier et al. 1987), they obtained 1–11 keV fluxes of 1.310-9 and 1.810-9 erg cm-2 s-1 for these two observations. Hence an accurate distance to 4U 170544 would yield a tight constraint on . Christian & Swank (1997) estimate a distance of 11 kpc, using the most luminous X-ray burst as a standard candle; this constitutes an upper limit to the distance (see e.g. Kuulkers et al. 2003, and references within). Cornelisse et al. (2003) also estimate the distance to 4U 170544 using bursts, but give a distance of 8.9 kpc with an assumed uncertainty of 30%. Hence = 0.08.
Similarly, GS 2023+338 (V404 Cygni) is a Galactic black hole LMXB; the most likely mass for the primary is 12 M⊙ (Shahbaz et al. 1994). It was discovered with Ginga during an outburst in 1989 (Makino 1989) and exhibited Type A PDS at 2–37 keV luminosities 31038 erg s-1 (Miyamoto et al. 1992; Oosterbroek et al. 1997, and references within). The X-ray spectrum for V404 Cygni was described by a power law with = 1.0–1.4 (Miyamoto et al. 1992), hence 0.06 in the 0.3–10 keV band.
These three sets of results are all consistent with 0.10 in the 0.3–10 keV band; this supports the idea of a constant proposed by vdK94.
Now, r2-3 appears to exhibit a Type A PDS at a 0.3–10 keV luminosity of 5.30.61037 erg s-1; this is a factor of 3 higher than for a 1.4 M⊙ neutron star. Indeed, for the maximum mass of a neutron star (i.e. 3.1 M⊙, Krishan & Kumar 1978), 41037 erg s-1. Known stellar-mass black holes have masses over the range 4–15 M⊙, hence our results from r2-3 are consistent with = 0.1 if the primary is a black hole.
Acknowledgements.
The authors would like to thank the anonymous referee for suggestions that led to significant improvements to the paper. This work is supported by PPARC.Observation Type x1 0 3 B x3 1.7 1.6 A x4 5.3 6.7 A
References
- Barnard et al. (2003a) Barnard, R., Osborne, J. P., Kolb, U., & Borozdin, K. N. 2003a, A&A, 405, 505
- Barnard et al. (2003b) Barnard, R., Kolb, U., & Osborne, J. P. 2003b, A&A, 411, 553
- Charles & Coe (2003) Charles, P. A. & Coe, M. J. 2003, Compact Stellar Sources (Cambridge University Press), in press, astro–ph/0308020
- Christian & Swank (1997) Christian, D. J. & Swank, J. H. 1997, ApJ Si, 109, 177+
- Cornelisse et al. (2003) Cornelisse, R., in’t Zand, J. J. M., Verbunt, F., et al. 2003, A&A, 405, 1033
- Haiman et al. (1994) Haiman, Z., Magnier, E., Lewin, W. H. G., et al. 1994, A&A, 286, 725
- Heinke et al. (2003) Heinke, C. O., Grindlay, J. E., Lugger, P. M., et al. 2003, ApJ, 598, 501
- Hynes et al. (2003) Hynes, R. I., Steeghs, D., Casares, J., Charles, P. A., & O’Brien, K. 2003, ApJ, 583, L95
- Jansen et al. (2001) Jansen, F., Lumb, D., Altieri, B., et al. 2001, A&A, 365, L1
- Kaaret (2002) Kaaret, P. 2002, ApJ, 578, 114
- Kong et al. (2002) Kong, A. H. K., Garcia, M. R., Primini, F. A., et al. 2002, ApJ, 577, 738
- Krishan & Kumar (1978) Krishan, V. & Kumar, N. 1978, Ap&SS, 57, 241
- Kuulkers et al. (2003) Kuulkers, E., den Hartog, P. R., in’t Zand, J. J. M., et al. 2003, A&A, 399, 663
- Langmeier et al. (1989) Langmeier, A., Hasinger, G., & Truemper, J. 1989, ApJ, 340, L21
- Langmeier et al. (1987) Langmeier, A., Sztajno, M., Hasinger, G., Truemper, J., & Gottwald, M. 1987, ApJ, 323, 288
- Lewin et al. (1995) Lewin, W. H. G., van Paradijs, J., & van den Heuvel, E. p. J. 1995, X-ray Binaries (Cambridge University Press)
- Makino (1989) Makino, F. 1989, in International Astronomical Union Circular, 1–+
- McClintock & Remillard (2003) McClintock, J. E. & Remillard, R. A. 2003, astro-ph/0306213
- Miyamoto et al. (1992) Miyamoto, S., Kitamoto, S., Iga, S., Negoro, H., & Terada, K. 1992, ApJ, 391, L21
- Oosterbroek et al. (1997) Oosterbroek, T., van der Klis, M., van Paradijs, J., et al. 1997, A&A, 321, 776
- Osborne et al. (2001) Osborne, J. P., Borozdin, K. N., Trudolyubov, S. P., et al. 2001, A&A, 378, 800
- Shahbaz et al. (1994) Shahbaz, T., Ringwald, F. A., Bunn, J. C., et al. 1994, MNRAS, 271, L10
- Šimon (2003) Šimon, V. 2003, A&A, 405, 199
- Stella et al. (1987) Stella, L., Priedhorsky, W., & White, N. E. 1987, ApJ, 312, L17
- Strüder et al. (2001) Strüder, L., Briel, U., Dennerl, K., et al. 2001, A&A, 365, L18
- Tomsick et al. (2003) Tomsick, J. A., Corbel, S., Fender, R., et al. 2003, ApJ, 597, L133
- Trudolyubov et al. (2002) Trudolyubov, S., Borozdin, K. N., Priedhorky, W. C., et al. 2002, ApJL, 581, L27
- Turner et al. (2001) Turner, M. J. L., Abbey, A., Arnaud, M., et al. 2001, A&A, 365, L27
- Uttley et al. (2002) Uttley, P., McHardy, I. M., & Papadakis, I. E. 2002, MNRAS, 332, 231
- van den Bergh (2000) van den Bergh, S. 2000, The galaxies of the Local Group, Cambridge University Press, Cambridge Astrophysics Series Series, vol no: 35
- Van der Klis (1994) van der Klis, M. 1994, ApJS, 92, 511
- van Paradijs & McClintock (1995) van Paradijs, J. & McClintock, J. E. 1995, X-ray Binaries (Cambridge University Press), 58–125
- Williams et al. (2003) Williams, B. F., Garcia, M. R., Kong, A. K. H., et al. 2003, ApJ in press, astro-ph/0306421 v2
- Wilson et al. (2003) Wilson, C. A., Patel, S. K., Kouveliotou, C., et al. 2003, ApJ, 596, 1220
- Zdziarski et al. (2004) Zdziarski, A. A., Gierlinski, M., Mikolajewska, J., et al. 2004, astro-ph/0402380