OBSERVATIONS OF JET DISSIPATION
Abstract
We summarise the recent progress of a project to determine physical conditions in the jets of low-luminosity (FR I) radio galaxies. We model the jets as intrinsically symmetrical, relativistic, decelerating flows. By fitting to deep, high-resolution VLA images in total intensity and linear polarization, we have been able to derive for the first time the three-dimensional distributions of velocity, rest-frame emissivity and magnetic-field structure. We describe our results for four sources and outline the implications for theories of jet deceleration. We also summarise a conservation-law analysis of 3C 31, which gives profiles of internal pressure, density, Mach number and entrainment rate along the jets, again for the first time. Finally, we discuss the applicability of adiabatic models to FR I jets and identify the regions where distributed particle acceleration is necessary.
1 Introduction
It was first recognised by Fanaroff & Riley (1974) that the ways in which extragalactic jets dissipate energy to produce observable radiation differ for high- and low-luminosity sources. Jets in weak FR I sources are bright close to the nucleus of the parent galaxy, whereas those in powerful FR II sources are relatively faint until their terminal hot-spots [there is also a dependence on environment (Ledlow & Owen, 1996)]. It rapidly became accepted that FR I jets must decelerate by entrainment of the surrounding IGM (Baan, 1980; Begelman, 1982; Bicknell, 1984, 1986; De Young, 1996, 2004; Rosen et al., 1999; Rosen & Hardee, 2000) or by injection of mass lost by stars within the jet volume (Phinney, 1983; Komissarov, 1994; Bowman, Leahy & Komissarov, 1996).
More recently, evidence has accumulated that FR I jets are initially relativistic and decelerate on kpc scales. FR I sources are thought to be the side-on counterparts of BL Lac objects, in which relativistic motion on parsec scales is well-established (Urry & Padovani, 1995). Superluminal motions have been seen on milliarcsecond scales in several FR I jets (Giovannini et al., 2001) and on arcsecond scales in M 87 (Biretta, Zhou & Owen, 1995). In FR I sources, the lobe containing the main (brighter) jet is less depolarized than the counter-jet lobe (Morganti et al., 1997). This can be explained if the main jet points toward the observer, suggesting that the brightness asymmetry is caused by Doppler beaming (Laing, 1988). The asymmetry decreases with distance from the nucleus (Laing et al., 1999), consistent with the idea that the jets decelerate.
It has proved frustratingly difficult to quantify the basic properties – composition, velocity, density, pressure, magnetic field – of radio jets. The present paper summarises recent progress on a project which has, for the first time, allowed us to derive the three-dimensional distributions of physical parameters in FR I jets on kpc scales. There are three main elements:
-
1.
We model FR I jets as intrinsically symmetrical, axisymmetric, relativistic flows. We parameterise the geometry and the three-dimensional variations of velocity, emissivity and magnetic-field structure and compute the brightness distributions in total intensity and linear polarization. By fitting to radio images, we can optimise the model parameters. We refer to these fits as free models. They are empirical, and make as few assumptions as possible about the (poorly-known) internal physics of the jets. Deep, high-resolution radio images in Stokes , and are essential.
-
2.
We then apply conservation of mass, momentum and energy to infer the variations of pressure, density, entrainment rate and Mach number along the jets. This requires measurements of the external density and pressure profiles from X-ray observations.
-
3.
Finally, we attempt to model the acceleration and energy-loss processes, adding images at mm, IR, optical and X-ray wavelengths to our radio data and models. So far, we have concentrated on the simplest process – adiabatic energy loss – in an attempt to quantify the amount and location of distributed particle acceleration.
Two X-ray – radio connections are vital to our argument. Firstly, the bases of FR I jets emit X-ray synchrotron radiation, indicating continuing local particle acceleration. Secondly, the jets interact with and are confined by the hot intergalactic medium, whose density and temperature can be estimated from its thermal bremsstrahlung emission. The radio data alone provide constraints on the kinematics of the jets. Combining these kinematics with the densities and pressure gradients obtained from the X-ray data via a conservation-law analysis allows us to address the jet dynamics and to estimate Mach numbers, energy and mass fluxes and entrainment rates in the jets.
We began this project by making a statistical study of jet asymmetries in the B2 sample (Laing et al., 1999). The detailed models were first applied to the well-known FR I source 3C 31 by Laing & Bridle (2002a) and a conservation-law analysis of the same source was made by Laing & Bridle (2002b), using Chandra observations by Hardcastle et al. (2002). Adiabatic models were developed and applied, again to 3C 31, by Laing & Bridle (2004). More recently, the techniques have been extended to other sources and free models of 0326+39 and 1553+24 were published by Canvin & Laing (2004). In the present paper, we summarise the published results and also present models of the jets in NGC 315. Modelling of one further source, 3C 296 (Hardcastle et al., 1997), is in progress.
2 Free models
2.1 Model procedure
Our fundamental assumption is that the jets are intrinsically symmetrical, axisymmetric, relativistic, stationary flows. [The assumption of symmetry is critical to our approach and we consider it further in Section 2.2]. The magnetic fields are assumed to be disordered on small scales, but anisotropic. There are both observational and theoretical reasons to suppose that the longitudinal field component, at least, cannot be vector-ordered on large scales (Begelman, Blandford & Rees, 1984; Laing, 1981; Laing & Bridle, 2002a). We return to the question of the nature of the toroidal field component in Section 3.4.
The main elements of the modelling procedure are as follows:
- 1.
-
2.
For given model parameters, we derive model distributions of Stokes by integration along the line of sight, taking account of the anisotropy of synchrotron radiation in the rest frame of the emitting material, aberration and Doppler beaming (Laing, 2002).
-
3.
The model is then compared with deep VLA images, using (summed over Stokes parameters) as a measure of goodness of fit and the parameters are optimised using the downhill simplex method of Nelder & Mead (1965). We take a measure of the deviation of the brightness distributions from axisymmetry as an estimate of the “noise” (rather than the much smaller off-source rms) and obtain reduced values in the range 1.1 – 1.7 over 1200 - 1400 independent points, each with 3 Stokes parameters.
2.2 The assumption of intrinsic symmetry
It is, of course, an assumption that the jets in most FR I galaxies are intrinsically symmetrical on small scales – and one that is difficult to prove in any individual case [there are also some clear exceptions, such as 0755+37 (Bondi et al., 2000)]. It is also obvious that many jets are very far from symmetry on large scales. We contend, however, that the apparent asymmetries caused by aberration and Doppler beaming dominate over intrinsic and environmental differences close to the nuclei in most sources. Evidence in favour of this hypothesis includes:
-
1.
The intensity ratio between main and counter jets initially decreases with distance from the nucleus (Laing et al., 1999), reaching a value close to unity on scales 10 kpc in typical cases. Deceleration provides a natural mechanism to reduce the asymmetry if the flow is relativistic, whereas intrinsic or environmental differences between the jets would be likely to produce constant or increasing brightness differences. The fact that the jets are very symmetrical on intermediate scales indicates that intrinsic differences are small.
-
2.
Jet/counter-jet intensity ratios are well correlated with other indicators of relativistic motion, such as the core/extended flux ratio (Laing et al., 1999).
- 3.
-
4.
The observation that the lobe containing the brighter kpc-scale jet is less depolarized than the counter-jet lobe in FR I sources (Morganti et al., 1997) indicates that the brighter jet is seen through less magnetoionic material and is therefore on the near side, as expected.
-
5.
There is a characteristic asymmetry in the degree and direction of polarization (corrected for Faraday rotation), which is correlated with that in total intensity. We show below that relativistic aberration provides a natural explanation for this effect.
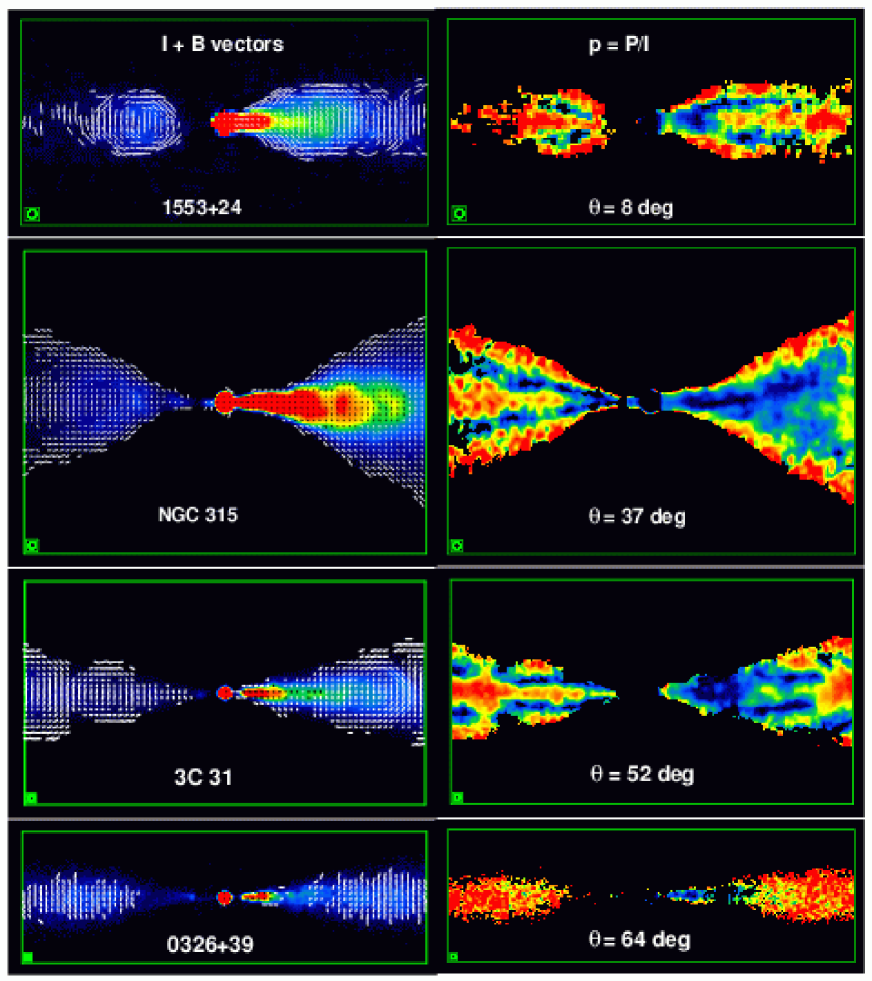
Fig. 1 illustrates the characteristic asymmetries in total intensity and linear polarization for the four sources in our study. They are arranged in order of increasing angle to the line of sight, (as deduced from the model fits). The asymmetries in total intensity decrease with distance from the nucleus and are, of course, greater at smaller . In addition, there is an asymmetry in the polarization structure: the main jet base shows a polarization minimum on-axis which extends considerably further from the nucleus than any equivalent in the counter-jet. Our (intrinsically symmetrical) models successfully reproduce this difference (see Section 2.4) and we believe that it, like the intensity difference, is a signature of relativistic aberration.
2.3 Breaking the degeneracy between velocity and angle
The key to our modelling approach is its use of asymmetries in linear polarization as well as total intensity in order to break the degeneracy between velocity and angle. The standard formula for the ratio of jet and counter-jet flux densities (assuming isotropic emission in the rest frame) is:
where is the spectral index and . There is therefore a degeneracy between velocity and angle to the line of sight. The relation between the angles to the line of sight in the rest frame of the flow, and in the observed frame, , is:
where is the Lorentz factor. The observed polarization is in general a function of if the field is anisotropic. If we know the field structure a priori, then we can solve explicitly for and . We take the example of a field which is disordered on small scales but confined to a plane perpendicular to the jet, with equal rms along any direction in the plane. In this case, there is no variation of the degree or direction of polarization across the jet. For , the total and polarized flux densities per unit length in the emitted frame are:
where is a constant (Laing, 1980, 1981). The ratios of observed total and polarized intensity for the jet and counter-jet are:
These equations can be solved numerically for and (cf. Bondi et al. 2000). In general, we must fit the field configuration and therefore need to introduce additional parameters to describe its anisotropy. These also determine the variation of polarization transverse to the jet axis, and can be estimated independently of the velocity and angle if the jets are well resolved in this direction.
The selection of sources to be modelled is determined by the requirement for high signal/noise ratio and good transverse resolution in , and in both jets. It is also essential to correct for Faraday rotation.
2.4 Comparison of models and data
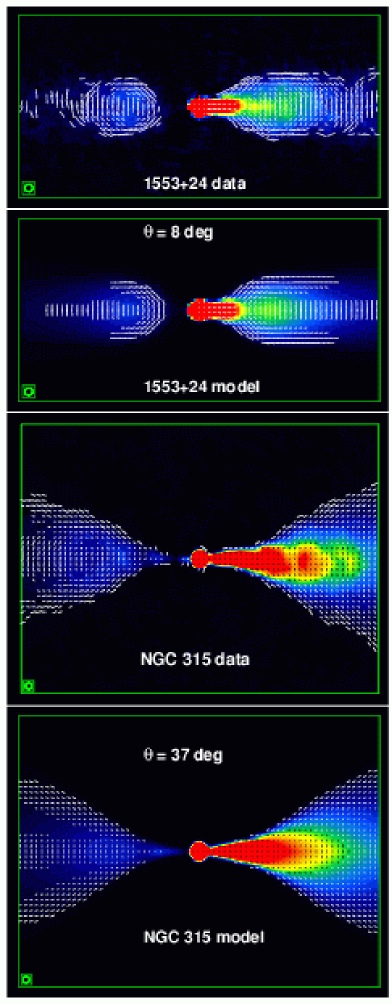
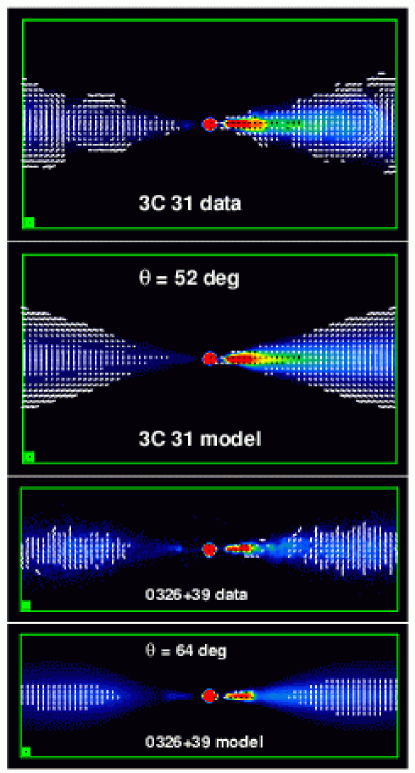
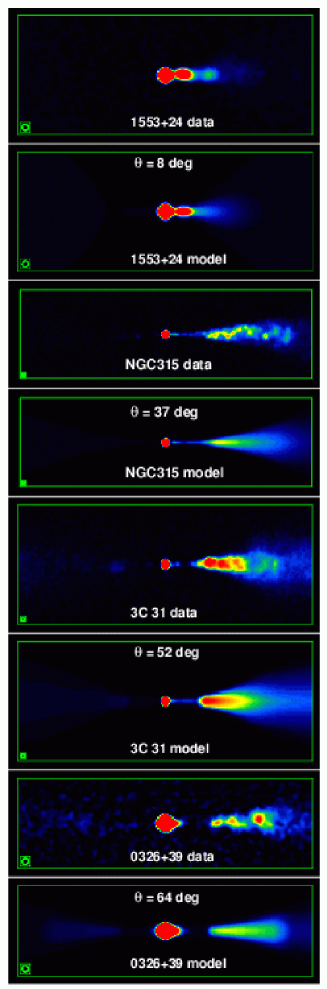
The four sources we have modelled are 3C 31 (Laing & Bridle, 2002a), 0326+39, 1553+24 (Canvin & Laing, 2004) and NGC 315 (Cotton et al., in preparation). In Figs 2 – 4 we compare model and observed images at the same resolution. Figs 2 and 3 show the full modelled areas at moderate resolution and display both total intensity and linear polarization. They demonstrate that we can successfully fit the observations in all cases, limited primarily by small-scale (and often non-axisymmetric) fluctuations. The inferred angles to the line of sight are shown in the figures. Fig. 4 shows the inner parts of the model and observed images at higher resolution. Here, the models fit the average intensities very well, but cannot reproduce the complex small-scale structure.
3 Physical parameters deduced from the free models
3.1 Geometry
Our qualitative conclusions about the geometry of FR I jets are not new, but our estimation of angle to the line of sight allows us to deproject their shapes and to derive intrinsic parameters. FR I jets are initially narrow, expand abruptly and then recollimate. We refer to this part of the flow as the flaring region. The shape of its outer isophote can be fitted accurately by a cubic polynomial function of distance along the axis. Further from the nucleus, the outer region is conical. In all sources except 3C 31 the opening angle is very small, so that the outer regions are almost cylindrical (note that we model only the flaring region in NGC 315). The deprojected shapes of the sources are shown in Fig. 5. The very small angle to the line of sight inferred for 1553+24 means that its intrinsic shape is very narrow (see Section 3.6).
3.2 Velocity
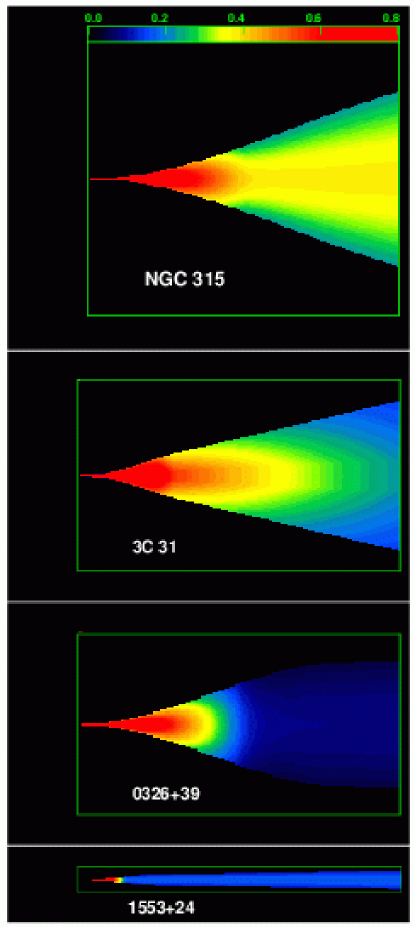
Fig. 5 also shows the inferred velocity distributions. At the closest distance from the nucleus where we can model the jets, all of their on-axis velocities are close to . They all decelerate rapidly over a short distance in the flaring region, but at different distances from the nucleus. NGC 315, 0326+39 and 1553+24 then have roughly constant velocities in the range 0.1 – 0.4 until the end of the modelled regions. 3C 31 continues to decelerate, but more slowly.
There is clear evidence for transverse velocity gradients in 3C 31 and NGC 315. In the other two sources, the gradients are poorly determined, but in all four cases, the data are everywhere consistent with a constant ratio of edge/on-axis velocity . There are no obvious low-velocity wings.
3.3 Emissivity
The longitudinal emissivity profiles generally flatten with increasing distance from the nucleus. All of the sources show an anomalously bright region, with complex, knotty sub-structure, within the flaring region (e.g. Fig. 6). This has an abrupt start, corresponding to the flaring point of the jet (Parma et al., 1987; Laing et al., 1999) and often also a clear end: it is as if an extra component of emissivity is added to an underlying, smooth distribution. Laing & Bridle (2002a) suggested that the sudden brightening coincides with a change in jet collimation properties in 3C 31, but the transverse resolution is marginal for that source, and there appears to be no obvious change in collimation in NGC 315, the only well-resolved case.

The jets are all intrinsically centre-brightened, with a typical edge/centre emissivity ratio .
3.4 Field structure
We have, for the first time, estimated the three-dimensional field structures of the jets rather than their projections on the plane of the sky. The dominant field component at large distances from the nucleus is toroidal. The longitudinal component can be significant close to the nucleus, but decreases further out, sometimes becoming negligible. The behaviour of the radial component is peculiar, and varies from source to source. This field evolution is qualitatively consistent with flux freezing, but laminar-flow models, even including transverse velocity shear, do not fit quantitatively (see Section 5).
As mentioned earlier, the idea that the longitudinal and toroidal field components are both vector-ordered (forming something like a simple helix) is inconsistent both with the observation that the brightness and polarization distributions are very symmetrical under reflection through their axes and with constraints from flux conservation. The former argument is strongest on large scales; weaker where the jets first brighten and there is significant oblique structure. The hypothesis that the longitudinal component has many reversals, but the toroidal component is well-ordered is consistent with the observations, however (our calculations would give identical results in this case). It is difficult to understand how a jet could acquire a toroidal component with many reversals.
We have searched for the characteristic signature of Faraday rotation by a toroidal field in the jets of 3C 31 and NGC 315, but see only random fluctuations which are most plausibly associated with foreground galaxy or group-scale plasma containing a disordered field. In any case, if our estimates of internal jet density (Section 4) are correct, we would expect negligible internal Faraday rotation even from a perfectly-ordered field.
Although the toroidal field component is probably not required for the collimation of FR I jets in the regions we model (see below), it may be what remains of a dynamically-important collimating field on smaller scales.
3.5 Deceleration physics
Any theory of jet deceleration has to explain the following results:
-
1.
Jets have (at least) two regions differentiated by their collimation properties: flaring and outer.
-
2.
The onset of rapid deceleration occurs within the flaring region and is quite sudden.
-
3.
After the rapid deceleration, three of the sources (0326+39, 1553+24 and NGC 315) have roughly constant velocities. 3C 31 continues to decelerate, but more slowly. The difference may be connected to the opening angle of the conical outer region: 3C 31 expands much more rapidly than the other three sources.
-
4.
The sudden brightening of the jets occurs within the flaring region and significantly before the rapid deceleration. It is a consequence either of a real increase in rest-frame emissivity or of an abrupt slowing of the emissivity decline. Complex and clearly non-axisymmetric structures produce the excess emissivity.
-
5.
This region of enhanced emissivity persists roughly until the start of rapid deceleration. Thereafter, the jets appear somewhat smoother and the emissivity declines monotonically.
-
6.
There is evidence from the field structure of 3C 31 for interaction with the external medium at the edge of the flaring region (Laing & Bridle, 2002a), but it is not clear whether this effect is general.
The reason for the sudden brightening of the jets is unclear, but Laing & Bridle (2002a, b) favour a reconfinement shock (Sanders, 1983), as this provides a natural mechanism both for a sudden brightening at the same distance from the nucleus in both jets and for the inferred over-pressure in 3C 31 (see Section 4). One interesting possibility is that entrainment of the external medium, in the form of relatively large clumps, begins at the reconfinement shock, but that deceleration does not become significant until the entrained material has time to mix with the jet flow.
3.6 Implications for unified models
3.6.1 Total intensity
Laing & Bridle (2002a) show the appearance of the 3C 31 model over a range of angles to the line of sight, and demonstrate that it would be qualitatively consistent with the appearance of the extended radio structures of BL Lac objects for small .
Conversely, we find that 1553+24 has a very small value of . This means that its side-on counterparts must be very large. The length of the main jet is at least 60 arcsec corresponding to 388 arcsec (340 kpc) at , the median angle to the line of sight. This is comparable in size with the longest jet in the B2 sample, in NGC 315 (Willis et al., 1981), and far larger than the median (30 kpc; Parma et al. 1987). There is cause for suspicion unless: (a) the side-on counterparts of B2 1553+24 are not members of the B2 sample or (b) sources in that sample have linear sizes far larger than previously realised.
Canvin & Laing (2004) examined the potential selection effects in detail and concluded that the side-on counterparts of 1553+24 could have escaped identification, either because they were missed in the original survey or because their angular sizes have been greatly underestimated. This is because there is relatively little lobe emission in 1553+24, so even its low-frequency flux is significantly affected by Doppler beaming and because its outer jets would be extremely faint and difficult to detect in published images. Morganti & Parma (private communication) and Ledlow & Owen (2004; in preparation) have made more sensitive observations of radio galaxies in the B2 sample using the WSRT and the VLA in D configuration and have shown that a significant fraction of them have much longer radio jets than have previously been reported, extending many 100’s of kpc or even further. We suggest that these might include the missing counterparts of 1553+24.
3.6.2 Polarization
Our models also require that the observed polarization structure changes as a function of angle to the line of sight and predictions for the 3C 31 model are given by Laing & Bridle (2002a). The dominance of toroidal field at large distances from the nucleus means that a parallel-field edge is less likely to be observed when (Laing, 1981). Although the details of this effect depend on the relative amounts of radial and longitudinal field present (these differ between sources), it is interesting that 3C 449 (Feretti et al., 1999) and PKS 133333 (Killeen, Bicknell & Ekers, 1986), which are extremely symmetrical and therefore likely to be close to the plane of the sky, show no parallel-field edge; neither does 0326+39 (which has the largest value of of any of our modelled sources).
4 Conservation-law analysis
4.1 Assumptions and results for 3C 31
The free models described in the previous section tell us the velocity and cross-sectional area of the jets. We can derive the external density and pressure from X-ray observations, and the combination allows us to apply conservation of matter, momentum and energy. For 3C 31, Laing & Bridle (2002b) showed that well-constrained solutions exist subject to two key assumptions:
-
1.
, where is the energy flux (with rest-mass energy subtracted) and is the momentum flux. This must hold quite accurately if the jets have decelerated from bulk Lorentz factors on pc scales.
-
2.
The jets are in pressure balance with the external medium in their outer regions.
For 3C 31 the key derived parameters at 1 kpc from the nucleus (the start of the modelled region) are:
- Mass flux
-
0.0005 solar masses / year.
- Energy flux
-
1.1 1037 W.
- Pressure
-
1.5 10-10 Pa.
- Density
-
kg m-3.
- Mach number
-
1.5.
- Entrainment rate
-
kg kpc-1 s-1.
Profiles of internal and external pressure, density, Mach number and entrainment rate are shown in Figs 7 – 10.


4.2 What are the jets made of?
Unfortunately, our analysis cannot give a definitive answer to this question, but they do imply that the jets are extremely light. At the innermost modelled point, we infer a density of kg m-3, equivalent to 1.4 protons m-3. For a power-law energy distribution of radiating electrons, each accompanied by a proton for charge balance, there must be a minimum Lorentz factor (the infamous ) in the range 20 – 50. Radiation from such low-energy electrons is at frequencies well below those observable. We cannot exclude any of the following alternatives (or, indeed, a mixture of them).
-
1.
Pure electron-positron plasma with an excess of particles over a power-law distribution at low energies.
-
2.
Electron-positron plasma with a power-law distribution and a small amount of mixed-in thermal plasma.
-
3.
A power-law distribution of electrons, each accompanied by a “cold” (i.e. not ultrarelativistic) proton and 20 – 50.
We have, however, estimated the mass injection into the jet from stellar mass loss within 1 kpc of the nucleus. This is commensurate with the mass flux we infer at that distance, and entirely consistent with the second alternative of electron-positron plasma and entrained thermal material. We have also compared the mass injection rate expected from stars with our inferred entrainment rate on larger scales (Fig. 10). The two rates are comparable at 1 kpc, but an additional source of mass – presumably provided by boundary-layer entrainment – is clearly required at large distances, where the stellar density falls off.
5 Adiabatic models and flux-freezing

To proceed beyond the purely empirical descriptions of the jets presented in Sections 2 and 3, we must make further assumptions about processes that affect the components of the modelled emissivity – the relativistic particle energy spectrum and the strength of the magnetic field. The separation of the emissivity into its components is ill-determined unless inverse-Compton emission can be detected from the synchrotron-emitting electrons (not yet the case for any FR I jet) and there are, as yet, no prescriptive theories for dissipative processes such as particle acceleration and field amplification or reconnection in conditions appropriate to FR I radio jets (De Young, 2004).
The energy-loss processes for the radiating particles can be quantified, however. It is inevitable that the particles will suffer adiabatic losses as the jets expand and synchrotron and inverse Compton losses are likely to be negligible by comparison at radio frequencies. It is therefore worthwhile to compare the observations with models in which the radiating particles are accelerated before entering the region of interest and then lose energy only by the adiabatic mechanism while the magnetic field is frozen into and convected passively with the flow, which is assumed to be laminar. Following conventional usage, we refer to such models as adiabatic.
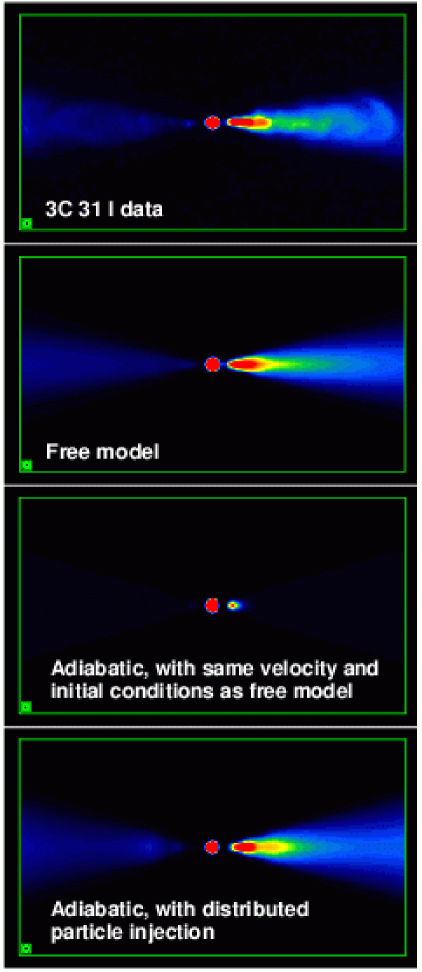
Analytical expressions for magnetic-field strength and emissivity were given for quasi-one-dimensional, non-relativistic jets by Burch (1979) and Fanti et al. (1982) and extended to the relativistic case by Baum et al. (1997). These formulae are not valid if there is velocity shear in a direction perpendicular to any component of the field. We therefore developed a more general approach which allows the inclusion of more realistic geometries and velocity fields and calculates the observed brightness and polarization structure given prescribed initial conditions on the emissivity and field (Laing & Bridle, 2004). We found that adiabatic models give a fair description of the observed brightness and polarization distributions in the outer parts of the jets in 3C 31, but fail in the flaring region, where they predict a far steeper decline in emissivity than is observed. This is illustrated in Fig. 11, where we show the brightness distribution predicted by an adiabatic model of 3C 31, given the velocity field and initial conditions of the free model and starting at 1 kpc from the nucleus. The observed polarization distribution is also inconsistent in detail with flux-freezing in a laminar flow.
We showed, however, that a modified adiabatic model can still be fitted to the total intensity of the flaring and outer regions if we add distributed injection of relativistic particles which then evolve adiabatically; the region where these particles must be injected is also one where there is independent evidence for recent particle acceleration from the detection of X-ray synchrotron radiation (Hardcastle et al., 2002) and of a local over-pressure in the jet from dynamical arguments (Fig. 7). The predicted brightness distribution is shown in the bottom panel of Fig. 11 and the inferred profile of particle injection is compared with that of the observed X-ray emission in Fig. 12.
A simpler analysis of 1553+24 shows that the emissivity profile is fit surprisingly well by the quasi-one-dimensional adiabatic approximation at large distances from the nucleus (Fig. 13). We plan more sophisticated modelling to determine whether the slow outer regions of FR I jets can be adequately described by the adiabatic approximation.

6 Conclusions
We conclude that FR I jets are decelerating, relativistic flows, which we can now model quantitatively. Their three-dimensional distributions of velocity, emissivity and field ordering can be inferred by fitting to deep, well-resolved radio images in total intensity and linear polarization. Application of conservation of mass, energy and momentum allows us to deduce the variation of density, pressure and entrainment rate along the jets. Boundary-layer entrainment and mass input from stars are probably both important in slowing the jets. Adiabatic models and flux freezing do not work everywhere, but do describe the observations at large distances from the nucleus. Finally, we infer from the radio observations alone that fresh radiating particle must be injected where the jets are fast - this is precisely where we detect X-ray synchrotron emission.
Acknowledgments
We thank our collaborators, in particular Martin Hardcastle, Diana Worrall, Bill Cotton and Paola Parma, for providing both radio and X-ray data and wise advice. The National Radio Astronomy Observatory is a facility of the National Science Foundation operated under cooperative agreement by Associated Universities, Inc.
References
- Baan (1980) Baan, W. A. 1980, ApJ, 239, 433
- Baum et al. (1997) Baum, S.A., O’Dea, C.P., Giovannini, G., Biretta, J., Cotton, W.D., de Koff, S., Feretti, L., Golombek, D., Lara, L., Macchetto, F.D., Miley, G.K., Sparks, W.B., Venturi, T., Komissarov, S.S. 1997, ApJ, 483, 178 (erratum ApJ, 492, 854)
- Begelman (1982) Begelman, M.C. 1982, in “Extragalactic Radio Sources”, eds. Heeschen, D.S., Wade, C.M., IAU Symp. 97, D. Reidel, Dordrecht, p. 223
- Begelman, Blandford & Rees (1984) Begelman, M.C., Blandford, R.D., Rees, M.J. 1984, Rev. Mod. Phys., 56, 255
- Bicknell (1984) Bicknell, G. V. 1984, ApJ, 286, 68
- Bicknell (1986) Bicknell, G. V. 1986, ApJ, 300, 591
- Biretta, Zhou & Owen (1995) Biretta J.A., Zhou F., Owen F.N. 1995, ApJ, 447, 582
- Bondi et al. (2000) Bondi M., Parma P., de Ruiter H.R., Laing R.A., Fomalont E.B. 2000, MNRAS, 314, 11
- Bowman, Leahy & Komissarov (1996) Bowman, M., Leahy, J. P., Komissarov, S. S. 1996, MNRAS, 279, 899
- Burch (1979) Burch, S. 1979, MNRAS, 187, 187
- Canvin & Laing (2004) Canvin, J.R., Laing, R.A. 2004, MNRAS, in press
- De Young (1996) De Young, D. S. 1996, in “Energy Transport in Radio Galaxies and Quasars”, eds. Hardee, P.E., Bridle, A.H., Zensus, J.A., ASP Conf. Series 100, ASP, San Francisco, p. 261
- De Young (2004) De Young, D.S. 2004, in “X-Ray and Radio Connections”, eds. Sjouwerman, L.O. & Dyer, K.K., http://www.aoc.nrao.edu/events/xraydio
- Fanaroff & Riley (1974) Fanaroff, B.L., Riley, J.M. 1974, MNRAS, 167, 31p
- Fanti et al. (1982) Fanti, R., Lari, C., Parma, P., Bridle, A.H., Ekers, R.D., Fomalont, E.B. 1982, A&A, 110, 169
- Feretti et al. (1999) Feretti, L., Perley, R., Giovannini, G., Andernach, H. 1999, A&A, 341, 29
- Giovannini et al. (2001) Giovannini G., Cotton W.D., Feretti L., Lara L., Venturi T. 2001, ApJ, 552, 508
- Hardcastle et al. (1997) Hardcastle, M.J., Alexander, P., Pooley, G.G., Riley, J.M. 1997, MNRAS, 288, L1
- Hardcastle et al. (2002) Hardcastle, M.J., Worrall, D.M., Birkinshaw, M., Laing, R.A., Bridle, A.H. 2002, MNRAS, 334, 182
- Killeen, Bicknell & Ekers (1986) Killeen, N.E.B., Bicknell, G.V., Ekers, R.D. 1986, ApJ, 302, 306
- Komissarov (1994) Komissarov, S. S. 1994, MNRAS, 269, 394
- Laing (1980) Laing R.A. 1980, MNRAS, 193, 439
- Laing (1981) Laing R.A. 1981, ApJ, 248, 87
- Laing (1988) Laing R.A. 1988, Nature, 331, 149
- Laing (2002) Laing R.A. 2002, MNRAS, 329, 417
- Laing & Bridle (2002a) Laing, R.A., Bridle, A.H. 2002a, MNRAS, 336, 328
- Laing & Bridle (2002b) Laing, R.A., Bridle, A.H. 2002b, MNRAS, 336, 1161
- Laing & Bridle (2004) Laing, R.A., Bridle, A.H. 2004, MNRAS, 348, 1459
- Laing et al. (1999) Laing, R.A., Parma, P., de Ruiter, H.R., Fanti, R. 1999, MNRAS, 306, 513
- Ledlow & Owen (1996) Ledlow, M.J., Owen, F.N. 1996, AJ, 112, 9
- Morganti et al. (1997) Morganti R., Parma P., Capetti A., Fanti R., de Ruiter H.R. 1997, A&A, 326, 919
- Nelder & Mead (1965) Nelder, J.A., Mead, R. 1965, Computer Journal, 7, 308
- Parma et al. (1987) Parma P., de Ruiter H.R., Fanti C., Fanti R., Morganti R. 1987, A&A, 181, 244
- Phinney (1983) Phinney, E. S. 1983, Ph.D. Thesis, University of Cambridge
- Rosen & Hardee (2000) Rosen, A., Hardee, P.E. 2000, ApJ, 542, 750
- Rosen et al. (1999) Rosen, A., Hardee, P.E., Clarke, D.A., Johnson, A. 1999, ApJ, 510, 136
- Sanders (1983) Sanders, R.H. 1983, ApJ, 266, 73
- Urry & Padovani (1995) Urry, C. M., Padovani, P. 1995, PASP, 107, 803
- Willis et al. (1981) Willis A.G., Strom R.G., Bridle A.H., Fomalont E.B. 1981, A&A, 122, 305