The Density of Coronal Plasma in Active Stellar Coronae
Abstract
We have analyzed high-resolution X-ray spectra of a sample of 22 active stars observed with the High Energy Transmission Grating Spectrometer on Chandra in order to investigate their coronal plasma density. Densities where investigated using the lines of the He-like ions O VII, Mg XI, and Si XIII. Si XIII lines in all stars of the sample are compatible with the low-density limit (i.e. cm-3), casting some doubt on results based on lower resolution EUVE spectra finding densities cm-3. Mg XI lines betray the presence of high plasma densities up to a few cm-3 for most of the sources with higher X-ray luminosity ( erg/s); stars with higher and tend to have higher densities at high temperatures. Ratios of O VII lines yield much lower densities of a few cm-3, indicating that the “hot” and “cool” plasma resides in physically different structures. In the cases of EV Lac, HD 223460, Canopus, Vel, TY Pyx, and IM Peg, our results represent the first spectroscopic estimates of coronal density. No trends in density-sensitive line ratios with stellar parameters effective temperature and surface gravity were found, indicating that plasma densities are remarkably similar for stars with pressure scale heights differing by up to 3 orders of magnitude. Our findings imply remarkably compact coronal structures, especially for the hotter ( MK) plasma emitting the Mg XI lines characterized by coronal surface filling factor, , ranging from to , while we find values from a few up to for the cooler ( MK) plasma emitting the O VII lines. We find that approaches unity at the same stellar surface X-ray flux level as solar active regions, suggesting that these stars become completely covered by active regions. At the same surface flux level, is seen to increase more sharply with increasing surface flux. These results appear to support earlier suggestions that hot K plasma in active coronae arises from flaring activity, and that this flaring activity increases markedly once the stellar surface becomes covered with active regions. Comparison of our measured line fluxes with theoretical models suggests that significant residual model inaccuracies might be present, and in particular that cascade contributions to forbidden and intercombination lines resulting from dielectronic recombination might be to blame.
1 INTRODUCTION
X-ray and EUV spectra represent the most effective means to investigate the physics of the hot magnetically confined plasma in the outer atmospheres of late-type stars. The aim of spectroscopic diagnosis of these astrophysical plasmas is to probe the physical conditions of the gas and to derive relevant parameters such as electron density, thermal structure, and relative element abundances: such information should help us to constrain models of coronal heating and structuring. As an intermediate step toward this goal, by studying the emission properties of stellar coronae we can test the validity of the solar analogy, i.e. whether the basic components of stellar coronae are analogous to those observed in the solar corona, whose dominant X-ray emitting structures are defined by the loop-like morphology of coronal magnetic fields.
The new generation X-ray observatories, Chandra and XMM-Newton, with their unprecedented spectral resolution and large effective areas, are providing us with high-resolution coronal X-ray spectra in which individual spectral lines can be readily resolved. The X-ray plasma diagnostics these spectra now allow for stars were previously accessible only for the Sun. It is also worth noting that Chandra and XMM-Newton stellar coronal spectra offer significantly more extensive X-ray wavelength coverage than achieved with solar instrumentation. In particular, with regard to the paper in hand, the High-Energy Transmission Grating Spectrometer (HETGS) on Chandra provides high resolution () spectra in the energy range 0.4-8.0 keV (1.5-30Å) where we observe simultaneously a large number of prominent emission lines that, at least in principle, provide both temperature and density diagnostics.
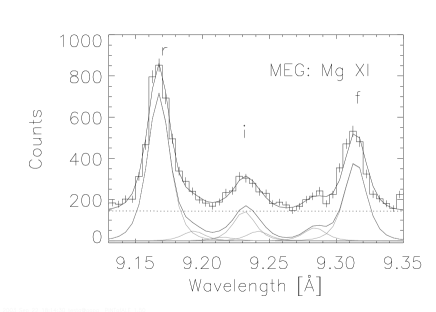
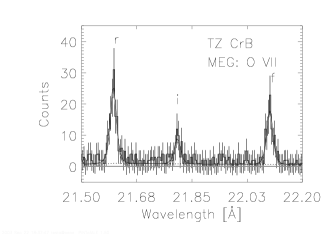
Of special importance for the purposes of this paper are the complexes of He-like “triplets” of O, Ne, Mg, and Si, which include the resonance line (r : 1s2 1S0 - 1s2p 1P1), the intercombination lines (i : 1s2 1S0 - 1s2p 3P2,1), and the forbidden line (f : 1s2 1S0 - 1s2s 3S1), which correspond to transitions between the shell and the ground level, . The utility of these lines for plasma diagnostics was pointed out by Gabriel & Jordan (1969) (see also Pradhan & Shull 1981, and Porquet & Dubau 2000 for a recent treatment): the ratio is mainly density sensitive, owing to the metastable 1s2s 3S1 level, while the ratio is mostly temperature sensitive. Similar diagnostic techniques have been widely exploited for electron density estimates in EUV spectra (see, e.g., Mariska 1992 for solar applications, and, Laming 1998 for a review of stellar work). Chandra and XMM-Newton data offer the opportunity to apply these techniques to the X-ray range and to explore different temperature and density regimes. In this context, analyses of He-like triplets seen in the X-ray spectra of a few different stars have appeared in the recent literature (e.g., Brinkman et al. 2000; Canizares et al. 2000; Audard et al. 2001; Güdel et al. 2001ab,2002; Huenemoerder et al. 2001; Ness et al. 2001,2002; Raassen et al. 2002; Stelzer et al. 2002, Sanz-Forcada et al. 2003b). The study of Ness et al. (2002) is more extensive and involves several stars observed with the Chandra Low Energy Transmission Grating Spectrograph (LETGS).
While all the results from these studies cannot be easily summarised, it is apparent, mostly from O VII lines, that there is a general trend showing that plasma with temperatures of up to a few million K has densities similar to that found in solar active regions—up to a few cm-3 or so. Based on lines of Mg XI, there is also some evidence for higher densities around cm-3. These results, however, are not without controversy. Brickhouse (2002), for example, notes that different density values have resulted from different analyses of the same stars observed with the different Chandra and XMM-Newton spectrometers. These instruments have different resolving powers, and so density-sensitive lines can be blended to greater or lesser extents with other lines. In this regime, the analysis is also sensitive to the continuum level adopted. For the case of XMM-Newton spectra, this is further complicated by the extended wings of the instrumental profile, which can give rise to a significant pseudo-continuum.
The best instrumentation to study the He-like lines of O, Ne, Mg and Si is that with the highest resolving power—the Chandra HETGS. We were therefore motivated to perform a systematic study of these lines in a large sample of stars observed with the HETGS in order to attempt to characterize plasma physical conditions in a sample of stars with very different stellar parameters. The results can be used to probe possible trends of the plasma parameters with more global coronal parameters, such as X-ray luminosity or flux, or stellar effective temperature, gravity, rotational period, etc.
In this paper, we have analyzed in detail the lines of Si XIII (6.7Å), Mg XI (9.2Å), and O VII (22Å), in a sample of 22 late-type stars, covering a range of spectral types and activity levels. We did not undertake an analysis of the Ne IX triplet lines here, since they are heavily blended with iron (predominantly Fe XIX; see Ness et al. 2003). The Si, Mg and O He-like triplets offer a reasonable sampling of different temperature and density regimes, with temperatures of formation and density sensitivities approximately corresponding to the following values: 10 MK, cm-3 (Si XIII), 7 MK, cm-3 (Mg XI); 2 MK, cm-3 (O VII).
2 OBSERVATIONS
The sample analyzed consists of all the late-type stars for which observations were available in the Chandra public archive111http://asc.harvard.edu/cda at the time when this study was undertaken. The sample comprises 22 cool stars of different activity levels, and includes single stars (the flare stars AU Mic, Proxima Cen and EV Lac, the zero-age main-sequence star AB Dor, the T Tauri star TW Hya, and the giants HD 223460, 31 Com, Cet, Canopus and Vel) and multiple systems (the close eclipsing binary system Algol; two eclipsing binary systems of W UMa type, namely ER Vul, and 44 Boo; and the RS CVn systems TZ CrB, UX Ari, UMa, II Peg, And, TY Pyx, AR Lac, HR 1099, IM Peg).
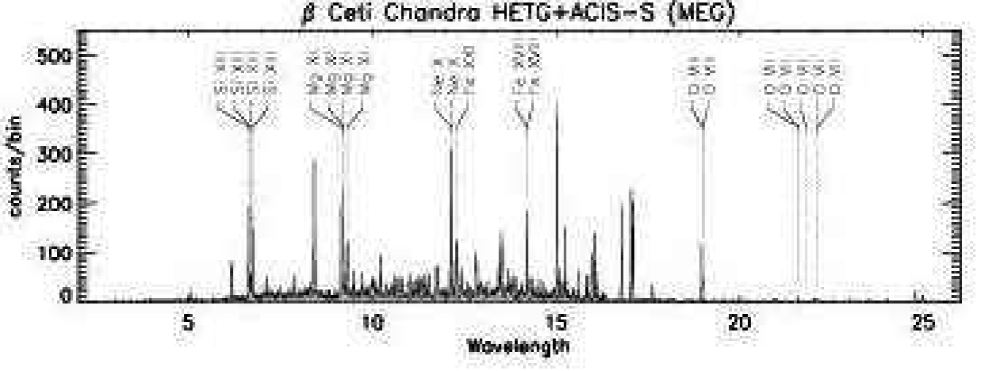
These sources were all observed using the Chandra-HETGS and the Advanced CCD Imaging Spectrometer (ACIS-S) detector (Canizares et al. 2000). The High-Energy Transmission Grating disperses X-rays through two different gratings, whose spectral coverage partially overlap; they are optimized for “medium” (MEG) and “high” (HEG) energies. The spectral resolution obtained with the HETGS is in the range . The data used here were either recently processed by the standard pipeline and obtained directly from the archive, or else, in the case of older observations, reprocessed using standard CIAO 3.0 tools and analysis threads to take advantage of recent improvements in the spectrum reduction software and ancillary calibration data. Our analysis of spectral lines was based on the summed data from positive and negative orders.
Table 1 and Table 2 summarize, respectively, the stellar parameters and the characteristics of the observations. For each source the listed X-ray luminosity was derived by integrating the photon energies over all the wavelengths in the spectral ranges of the two different instruments, HEG and MEG.
As summarized in Table 1, the single stars in our sample are four late-type flare stars, namely AU Mic, Proxima Centauri, EV Lac, and the rapid rotator AB Dor ( ksec), the giants, HD 223460, 31 Com, Cet, Canopus and Vel and the T Tauri star TW Hya. The other sources are binaries and most are classified as systems of RS CVn-type. In detail, among the RS CVn systems: II Peg is a system of a K2 V star and an unseen companion; analogously And is a binary system of which we see only one component (G8 IV-III); finally, TY Pyx is an eclipsing active close binary system of two G5 IV stars. As for the remaining sources, UMa is a binary system of two optically identical components (G0 V) one of which is a rapid rotator, and there are two eclipsing binaries of W UMa type: ER Vul, a short period active binary system of solar-like stars (G0 V + G5 V) that are rapid rotators (v, 71 km/s respectively), and 44 Boo, a contact binary system of G1V-G2V stars.
It is worth noting that our sample contains sources whose X-ray luminosities span a very wide range—from a few erg/sec of Proxima Cen up to a few erg/sec of the giant HD 223460. As for the ratio of X-ray to total luminosities, , our sample covers the range -. We are therefore analyzing spectra of stars whose activity levels cover almost the whole activity range observed for late-type stars, although most of them are very active stars.
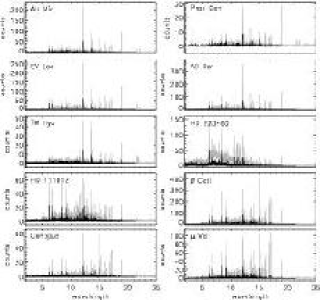
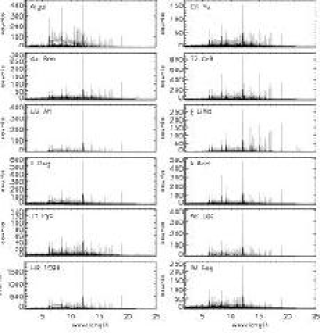
Spectra for each source were extracted from photon event files obtained from the Chandra Data Archive222http://cxc.harvard.edu/cda/ using CIAO 3.0. Effective areas were calculated using standard CIAO procedures, and we included the effects of the ACIS-S contamination layer (e.g. Plucinsky et al. 2002) using Version 1 of the effective area contamination correction333http://cxc.harvard.edu/ciao/threads/aciscontam. The resulting HETG spectra are shown in Figures 1 and 2; spectra of sources of the same type are grouped together: Fig. 1 shows the spectra of single stars (both dwarfs and giants); Fig. 2 shows the spectra of binary systems. For sources with several different observations we show the coadded spectra.
3 DATA ANALYSIS
3.1 Lightcurves
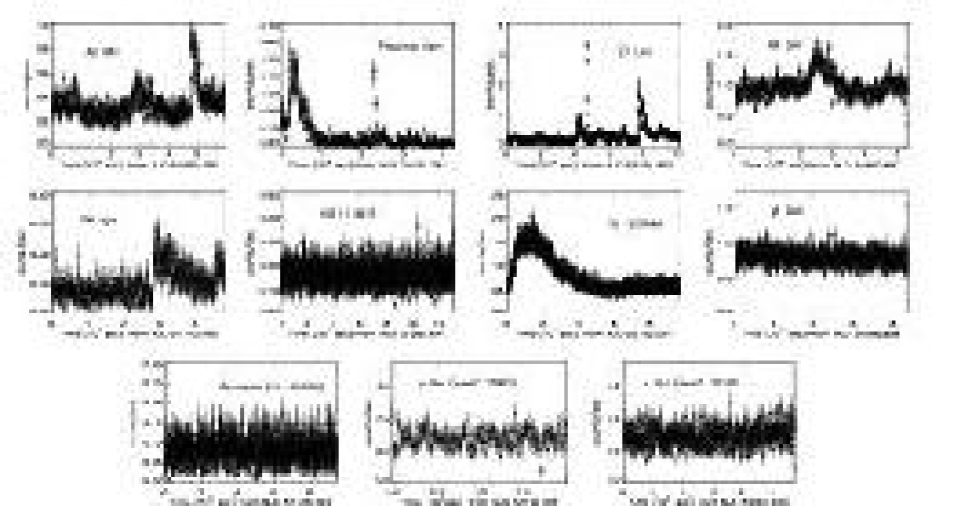
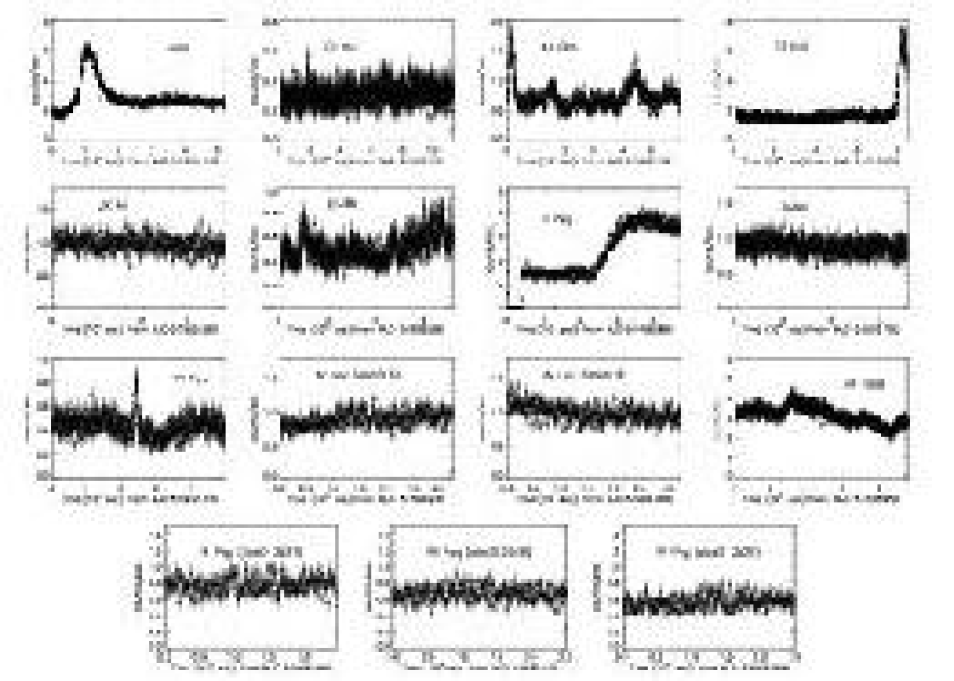
As a first step of the analysis we have extracted the lightcurves to check whether the spectra integrated over the whole observation time are influenced by significant variability or large flare events. In order to obtain the lightcurves we excluded the 0th order events that can be drastically compromised by photon pile-up effects, and considered just the dispersed events. The lightcurves were obtained by summing all the counts of HEG and MEG spectra for spectral orders in temporal bins of 100s.
The resulting lightcurves are shown in Figures 3 and 4. We see from these figures that there are no remarkable variations in X-ray count rate for 31 Com, Ceti, Canopus, Vel, ER Vul, UX Ari, UMa, And, AR Lac, and IM Peg. In the remaining cases, the lightcurves of AU Mic and EV Lac show flaring activity, and in particular, flares of different intensity and temporal extent; the Proxima Centauri lightcurve shows a flare at the beginning of the observation and then a decay over about 3 ksec and then the emission stabilizes at a low level; the AB Dor emission is almost steady with the exception of a moderate flare extending over about 10 ksec (of the 53 ksec of the total observation); HD 223460 shows a large flare over half of the observing time—it is worth noting that flares have been thought of as fairly unusual on single giants (e.g. Ayres et al., 1999,2001); the lightcurve of Algol shows evidence of a big flare with a peak at about 10 ksec after the beginning of the observation and then a slow decrease over about 40 ksec to approximately the initial emission level; TZ CrB shows a flare with a rapid increase of the emission by a factor 4 over the last ksec among the ksec of total exposure time; II Peg shows a big flare analyzed in detail by Huenemoerder et al. (2001); the TY Pyx total emission is quiescent with a slight modulation for almost the whole observation except a short flare (lasting 3 ksec) in the middle of the observation. The lightcurve of 44 Boo exhibits periodic modulation that was analyzed in detail by Brickhouse et al. (2001) who exploited, for the first time, the possibility of a crude Doppler imaging at X-ray wavelengths to derive geometrical properties of coronal X-ray emitting structures.
Regarding the influence of these variations on the integrated spectra, in most of the cases they do not affect substantially the basic properties of line emission, whereas the continuum emission changes significantly during the flares. For example, for the II Peg observation, Huenemoerder et al. (2001) show that at “low” temperatures (T MK) the modulation of the line fluxes during the flare is low (%), and in particular, since the triplet lines do not show substantial variations, they use the data integrated over the entire observation for the density diagnostics. In other cases, e.g., AU Mic, TZ CrB, TY Pyx, AB Dor, the flares extend over a very small portion of the observing time, thus they do not affect substantially the total spectra. Unfortunately, in these cases the flaring intervals are also too short to provide adequate signal for separate analysis. Finally, in the case of Proxima Centauri, the flaring portion of the emission is the only detectable signal, and even when considering the total spectra, it is not possible to measure the fluxes of most of the lines because of the low signal. In the light of the above considerations, our analysis here is based on spectra integrated over entire observation.
3.2 Spectra
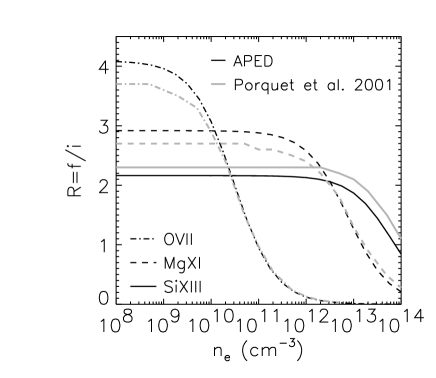
We illustrate the lines used in this analysis in the MEG spectrum of Ceti, illustrated in Figure 5; the relevant lines are labeled by element and ionization stage. As already mentioned in Section 1, in the HETGS spectral range the lines of He-like ions are among the most intense, though our analysis hinges on the measurement of relatively weak components of these. The theoretical wavelengths of these line complexes, as they appear in the APED database (Smith et al. 2001), are listed in Table 3. Our plasma density analysis basically consists of a comparison between measured and theoretical relative intensities of the forbidden and intercombination lines (the R ratio). For this comparison, we adopt the line emissivities of APED, and in Figure 6 we show the dependence of the R ratio on at the temperature of maximum formation of each of the He-like ions considered here. For comparison we plot also the values from Porquet et al. (2001).
As Figure 6 illustrates, the R ratios at the low density limit differ by about 10% between the different calculations. At densities above the lower sensitivity threshold, the calculations are in much better agreement for O and Mg, though differences persist for Si at higher densities. The Porquet et al. (2001) and Smith et al. (2001) emissivities are based on different input atomic data, and so small discrepancies are to be expected. Mewe et al. (2003) noted the same differences in predicted R ratios for O VII, and attributed these to the different sources used for the direct excitation terms: Smith et al. (2001) used the excitation rate coefficients from Kato & Nakazaki (1989) (for n) and from HULLAC (Liedhal et al. 1995; for n=6-10), while Porquet et al. (2001) adopted coefficients from Zhang & Sampson (1987) (for n) and from Sampson et al. (1983) (for n ). We also note that dielectronic recombination and radiative recombination rates are from different sources in the two models. Since the and levels are primarily populated by cascades from higher levels that in turn are largely populated by dielectronic recombination (e.g. Smith et al. 2001), it seems plausible that the treatment of these processes could also contribute significantly to differences in predicted R ratios.
In this paper, we emphasise as much as possible trends in the observed R ratios, rather than in the exact conversion to density values using theoretical models; had we adopted the Porquet et al. (2001) theoretical R ratios instead of those of Smith et al. (2001), none of our conclusions would be significantly changed.
Observed spectra were analyzed with the IDL 5.3444Interactive Data Language, Research Systems Inc. PINTofALE 1.0555http://hea-www.harvard.edu/PINTofALE software (Kashyap & Drake 2000). Line fluxes were determined by fitting with a modified Lorentzian function described by the relation
| (1) |
where is the amplitude and is a characteristic line width, and with a value of 2.5 for the exponent . This function has been found to be a good match to observed line profiles in stellar coronal spectra with counts of a few thousand or less (see, e.g., the Chandra Proposers’ Observatory Guide666http://asc.harvard.edu/proposer/POG/html/LETG.html).
The measured R ratio can be somewhat sensitive to the level assumed for the underlying continuum, and so we took particular care in locating this. For a few spectra of the very active stars the continuum is quite strong in the vicinity of the Mg and Si triplets (HD 223460, Algol, TZ CrB, II Peg, AR Lac, HR 1099, and IM Peg), while in the 21-22 Å range where the O VII lines are located the continuum level was always close to zero and essentially negligible. The continuum in a coronal plasma at temperatures exceeding a few million K is predominantly due to bound-free and free-free emission from hydrogen. Over small wavelength intervals this continuum is quite flat and can be modelled using the instrument effective area function pinned down in adjacent “line-free” regions. For the very active stars, we also used a generic continuum model computed for the RS CVn-type binary HR 1099 by Drake et al. (2001), scaled again according to spectral regions deemed essentially “line-free”. We also performed sensitivity tests to determine how errors in continuum location effected our measured fluxes: line fluxes were measured for continuum levels deemed too high and too low, based on our location criteria described above. In the case of the and lines, the differences in measured fluxes were always smaller than the statistical uncertainties in the fluxes themselves so that uncertainty in continuum placement was not a significant source of error in the analysis.
We measured the spectral line intensities of the Si XIII, Mg XI and O VII He-like triplets from both HEG and MEG spectra wherever the data offer useful signal. The results obtained from the two spectra are in good agreement, as we will show below. The O VII lines were measured only in the MEG spectra since they are outside the wavelength range of the HEG. For all the He-like line complexes we fitted the three lines simultaneously; the free parameters of the fit were the position and the flux of each of the lines, while the widths of all lines were constrained to have the same value.
3.3 Mg XI spectral region
While the Si XIII and the O VII triplet lines are relatively isolated, the Mg XI triplet lies in a more crowded region and the lines are more likely to be affected by blending. Indeed, the APED database predicts a number of Fe XIX-XXII lines in the 9.15-9.35 Å region, though each of these is considerably weaker than the Mg lines of interest. Moreover, lines from the Lyman series of H-like Ne with upper levels also lie in this region. These latter lines are listed in Table 4.
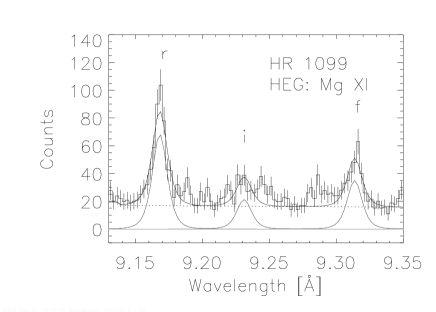
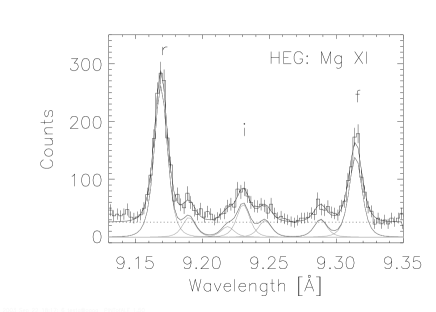
We investigated the possible influence of line blends on our measurement of the Mg XI triplet components in some detail. First, we carefully examined HEG spectra with both the highest signal-to-noise ratio and the highest relative intensity of Fe or Ne lines with respect to Mg lines (e.g., UX Ari for both Fe and Ne, AB Dor for Fe, HR 1099, II Peg and AU Mic for Ne) for evidence of spectral features close to, or blending with, the triplet lines. In particular, in the spectra of stars in which Ne has been found to be strongly enhanced relative to Fe, such as HR 1099 (Drake et al. 2001) and II Peg (Huenemoerder et al. 2001), the Ne Lyman series lines at 9.215 (), 9.246 () and 9.291 () are readily discernible. Some lines of highly ionised Fe also probably blend with the Ne features at some level, though the dominant components appear fairly well-centred on the expected Ne wavelengths. A simple fit to the Mg components of the HR 1099 in the HEG spectrum, ignoring the Ne blends, is illustrated in Figure 7 (top panel). It is clear from this figure that the fit to the intercombination line also encompasses a significant fraction of the Ne lines: ignoring these blends results in a spuriously large intercombination line flux.
In order to account for the blends, we constructed an empirical model of the region that included the major Mg XI lines, together with blending components. These components comprised four additional lines corresponding to the positions of the Ne Lyman series lines with upper levels . While it is desirable to include explicitly any significant lines of Fe, this presents difficulties because the wavelengths of the relevant Fe lines in this region are poorly known. To our knowledge, the best wavelengths currently available for this particular region are those predicted by the APED database, and these are based primarily on theoretical calculations, rather than on experiment. The model itself was constrained by comparison with, and by fitting to, co-added HEG spectra with the highest signal-to-noise ratio ( Ceti, TZ CrB, AR Lac and HR 1099). Since Fe features might distort and displace the centroids of the Ne features, in the fitting process we allowed the wavelengths of the four blends to vary. Line widths were all constrained to the same value, and the wavelength separations of the Mg lines were also fixed at their accurately known theoretical values.
In Figure 7 we show the best fit model together with the individual components superimposed on the coadded HEG spectra. The wavelength intervals between the blends and the Mg XI resonance line found from this fit were then fixed into the model, which was then tested on the coadded MEG spectra of the same four sources. This latter fit, which is also illustrated in Figure 7, provided an excellent match to the MEG spectrum, and yielded relative line fluxes in agreement with the HEG values to within statistical uncertainties. The individual wavelengths of the different line and blend components in the final model of the Mg XI spectral region determined in this way from the coadded HEG spectra are listed in Table 5, together with the identifications we attribute to the features.
While the blending components include the contribution of all the Ne lines of the Lyman series present in this spectral range, there are doubtless contributions at some level from Fe lines, and we list candidates in Table 5. The relative strengths of the Ne Lyman lines for the higher transitions should scale in proportion to the oscillator strengths of the transitions. This appears to hold for those with upper levels ,8 and 9; however, the transition at 9.194 Å appears too strong and it is shifted slightly blueward of its predicted location. Examination of the APED database reveals an Fe XXI transition in this vicinity that we attribute to this. In comparison to this Fe XXI line, other potential Fe blends predicted in APED appear significantly weaker by factors of at least 3 and are likely less significant. The wavelengths fitted for the other blend components also remained very close to the values of the Ne lines, and the presence of further significant blends that we have omitted seem unlikely.
We compare in Figure 8 the R and G ratios obtained for the Mg XI triplet in each star for the case in which only the continuum and Mg XI lines themselves were included in the line fitting with the ratios obtained when we fitted the region using the model including blends. As expected, because the intensity of is generally diminished compared to that of in the latter approach, the effect is of raising the R ratio and slightly decreasing the G ratios compared to the former approach, i.e. including blends implies shifts toward lower derived densities and slightly higher temperatures.
As an additional test that our final Mg line fluxes, and especially those of the density-sensitive and pair, are not significantly affected by unseen blends, we have investigated the observed ratios as a function of both Ne and Fe relative line strength. As a measure of relative line strengths of Ne and Fe, we chose the ratios of the Mg XI resonance line with Fe XXI 12.29 Å, Fe XVIII 14.21 Å, and Ne X 12.13 Å. The two lines of iron at different ionization stages provide tests at different temperatures, which could be important since the thermal structure of our sample stars that cover a fairly wide range in X-ray activity might be quite varied. The observed R ratios are illustrated as a function of our control ratios in Figure 9.
We note from Figure 9 that the relative intensities of the chosen Fe and Ne lines with respect to the Mg resonance line span a wide range of factors of 4-5 (Fe XVIII,XXI) and (Ne X). Both the thermal structure and the elemental abundances of the emitting coronae contribute to produce these differences; the Mg XI resonance line, for example, is formed at temperatures intermediate between those of Fe XVIII and Fe XXI. We might also expect some degree of correlation between coronal density and both temperature structure and chemical composition.
Of the three panels in Figure 9, only the Mg XI R ratio variation as a function of Mg /Fe XVIII line strength appears completely flat, indicating an R ratio that is independent of Fe XVIII line strength. This is encouraging because Fe XVIII can be considered a rough proxy for the coronal Fe abundance, and in the case where remaining Fe blends were affecting our derived R ratios, we would expect to see some correlation between the two. The hidden Fe lines that we might expect to blend with the Mg lines come from slightly higher ionisation stages, however. In the case of Fe XXI, the R ratio appears somewhat higher for the very lowest Fe XXI/Mg values, with a step to lower R ratio for Fe XXI/Mg . While the reason for this is not clear—as we emphasise above, both temperature structure and relative abundances play a role in the Fe/Mg and Ne/Mg ratios—we discount blends as the culprit because the trend in R ratio remains flat while Fe XXI/Mg varies by a factor of 3-4. The Fe XXI 12.29 Å line is also sensitive to density, and decreases in intensity with densities above several cm-3. While this could contribute to the trend in Figure 9, we do not expect this to be a major effect since densities of order cm-3 or more would be required; in the analysis described below we rule out such high densities based on our observed Si XIII R ratios.
Perhaps the most interesting trend is that between R and Ne X/Mg : there does appear to be a weak correlation here, with Ne X/Mg increasing as the R ratio decreases. At face value this might suggest residual Ne blending problems; however, the Ne Lyman series lines have very precise wavelengths and our blending model should accurately account for them. We conclude that the observed trend is real: that there is probably a weak trend of increasing Ne X line strength with increasing R ratio. We return to this in the discussion (§4).
3.4 Results
Table 6 and 7 summarize the results for the measured line fluxes and uncertainties for all the stars. The uncertainties were obtained from a full search of parameter space for each spectral fit. HEG and MEG line fluxes were found to differ beyond their uncertainties to a small degree. We first investigated to determine whether or not this could be the result of the spectral resolution difference between them, resulting in systematically different estimated continua, but we were able to rule this out: the required continuum placement errors are implausibly large. Instead, we have found that similar flux differences are obtained by integrating spectral flux in arbitrary intervals across the bandpass. We attribute this to effective area calibration errors, which seem to be at the 10-20% level at this time.777http://space.mit.edu/CXC/calib/hetgcal.html Flux differences across the bandpass vary only very slowly with wavelength such that over narrow intervals the effect is grey and does not influence the measured line ratios.
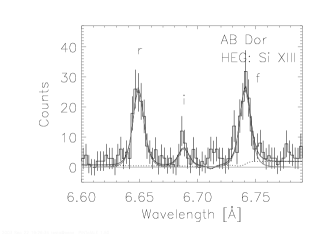
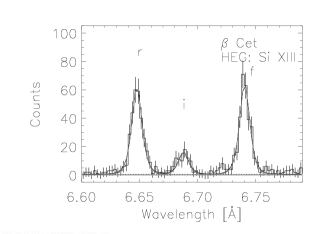
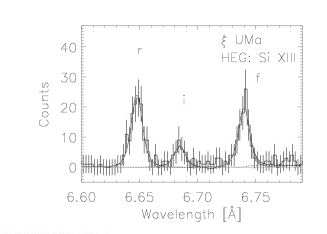
Figure 10 shows examples of the HEG spectra in the region of the Si XIII He-like triplet for one star of each class: single stars, giants and multiple systems. We plot the different components of the best fitting model (continuum emission and single spectral line features), together with their sum, superimposed on the data.
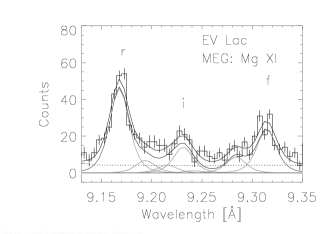
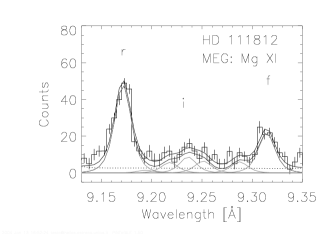
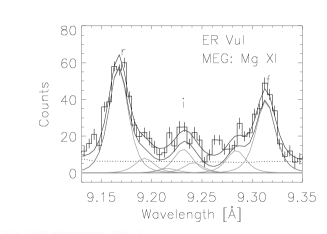
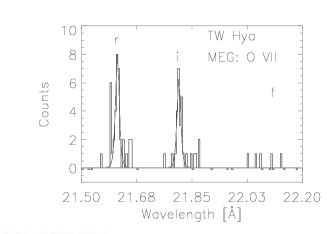
Analogously, Figure 11 and Figure 12 show examples of the MEG spectra for the Mg XI and O VII He-like triplet regions, together with spectral fits. None of the spectra obtained for giant stars yielded significant O VII line measurements. The spectrum of TW Hya is extremely interesting, since the forbidden line is essentially not detected, and thus it is the only case of line fluxes at the high density limit for oxygen (see also §4 and Kastner et al. 2002).
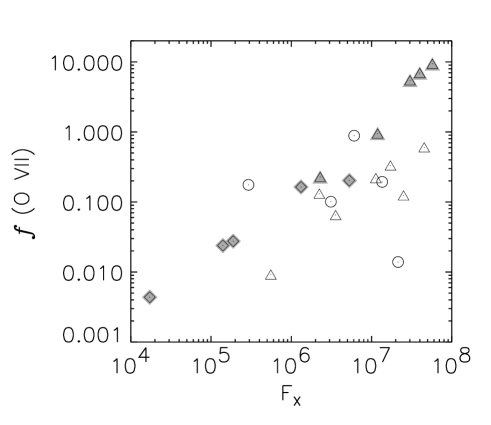
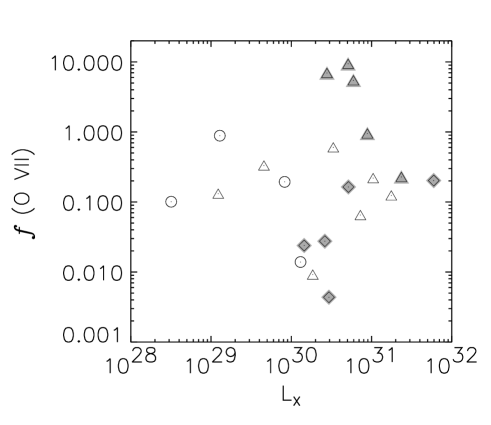
Figure 13 summarizes all the results obtained for the R ratios for all the sources, plotted as a function of surface X-ray flux and X-ray luminosity. Some of the ratios, mostly from HEG spectra, are missing due to the low S/N ratio of the relevant features (see Table 6). We use different symbols for different classes of sources as indicated in the figures. It is clear from these figures that HEG and MEG measurements are generally compatible within experimental uncertainties. The dashed lines of Figure 13 mark the low-density limits of the sensitivity of the different diagnostics, i.e. R ratios consistent with the dashed lines to within experimental uncertainty provide only an upper limit to the plasma density, while those significantly below the limit provide density estimates (see Fig. 6).
At face value, all the Si XIII R ratios are compatible with the low-density ratio limit, cm3. However, we note that a good fraction of the measured ratios lie above this limit. This suggests that either the theoretical low density limit R ratio is too low, or that some fraction of our observed R ratios are spuriously high. We return to this in §4.
For the Mg XI triplet lines, formed at lower temperatures with respect to the Si XIII lines, in many cases the R ratio is lower than the low-density limit value and yields useful density diagnostics. The Mg XI R ratio vs. surface flux (Figure 13) shows a discernible trend that stars yielding high densities tend to have higher fluxes. One exception is the low surface flux supergiant Canopus ( erg/cm2/s), whose Mg triplet lines point to high density. An analogous trend appears in the figures illustrating the R ratios vs. X-ray luminosity; in particular for the Mg XI R ratio this trend with luminosity is even more pronounced than with surface flux. One exception is the late-type single star EV Lac, which, owing to its late spectral type, has a relatively low X-ray luminosity but apparently high plasma density.
Since the He-like triplet features are mildly sensitive to temperature, in order to derive actual density values from the measured R ratios we need to determine the plasma temperatures at which the density-sensitive lines are formed. The natural choice would be to use the temperature-sensitive G ratio; however, based on our measurements the G ratio seemed to yield temperatures systematically lower than what we would expect. The true temperature of line formation depends on both the line emissivity as a function of temperature (that peaks at MK in the case of Mg XI and MK for O VII), and on the thermal structure of the corona, i.e. the emission measure distribution; since most of these active stars have emission measure distributions peaked around K or even higher (e.g., Ayres et al. 1998 for some giants, Drake et al. 2001 for HR 1099, Sanz-Forcada et al. 2002 for UX Ari and AB Dor, Huenemoerder et al. 2001 for II Peg, Singh et al. 1996b for AR Lac), we then expect to get temperatures even higher than the nominal maximum formation temperature. Instead, typical derived temperatures from the G ratio were lower than those of the peak emissivities for both Mg XI and O VII: for Mg XI, typical derived temperatures were in the range 1- K, while for O VII temperatures where only - K.
Since the G ratio temperatures seem too low, we compared them to ionization temperatures derived by comparing predicted and observed ratios of the He-like to H-like Ly resonance lines of O and Ne: the representative ionization temperature is that at which an isothermal plasma most closely matches the observed ratio. Line fluxes for the O and Ne Ly lines were again measured using the PINTofALE FITLINES routine, though we only examined the lines in MEG spectra; fluxes are listed in Table 7. The comparison between G ratio and ionization temperatures is illustrated in Figure 14. The G ratio yields temperatures systematically lower than ionization temperatures by factors of -4.
The scatter in the derived ionization temperatures for the different stars is very small and amounts to less than a factor of 2. The ionization temperature probably overestimates very slightly the true mean temperature of formation of the He-like lines, since it represents the temperature intermediate between the H-like and He-like ions. Since we discount the G ratio temperatures as spuriously low, and the ionization temperatures as slightly high, for simplicity in the derivation of densities we adopted the temperature of peak emissivity for both O VII and Mg XI. It is worth emphasising here that the R ratio is only weakly dependent on temperature, and electron densities derived using all the different temperatures obtained with different methods yield density values that differ by a factor at most 2—considerable lower in most cases than the statistical uncertainty associated with measurement errors in the R ratio. The final density values as derived from the R ratios are illustrated as a function of both X-ray luminosity and surface flux in Figure 15 and listed in Table 8.
4 Discussion
The survey described here provides information on plasma densities in the X-ray emitting coronae of a wide sample of stars. We feel in particular that our measured fluxes are robust, and that the deblending procedure discussed in §3.3 provides for much more accurate measurement of the density-sensitive Mg XI lines than has been presented in other studies to date.
4.1 Atomic Data
The derived plasma densities we will discuss below depend on the predictions of atomic models, and it is natural to ask what systematic errors might be associated with converting the measured R ratios into electron densities. In particular, our study highlights two potential problems with recent calculations of He-like emissivities for Si, Mg and O.
In the case of Si, the APED predicted low density limit value of the R ratio is about 50% lower than what we observe, assuming the source plasmas are indeed at the low density limit. The Porquet et al. (2001) predicted ratio is slightly higher (Figure 6), though still discrepant with regard to our measured ratio. Instead, for Mg the low density limit R ratio from both APED and Porquet et al. (2001) agrees very well with the upper envelope of the observed ratios, as we would expect if some of the coronae were at the low density limit and some comprised higher density plasma. The case of O VII is more difficult to evaluate, since it appears that all the measurements imply densities above the theoretical low density limits, though some of these are of course not statistically significant.
The temperatures derived from the APED G ratios of both Mg and O are much lower than we would expect for these coronal plasmas. In the case of O VII, the observed G ratios should have reached a limiting value of for most of the stars in our study, according to the APED emissivity ratio. The situation is improved for the case of the Porquet et al. (2001) ratios, though G ratio temperatures still seem too low.
While direct excitation dominates other mechanisms in populating the upper level of the resonance line, in the case of the forbidden line cascades from higher levels are much more important. These cascade contributions predominantly come from dielectronic recombination. The G ratio is therefore quite sensitive to the balance between dielectronic recombination and direct excitation processes. Since our G ratio temperatures are too low, this suggests that either the model populations of the and upper levels are underestimated, or the resonance line, , upper level population is overestimated. Considering that the predicted Si R ratio low density limit seems too low to explain the observations, our results suggest that the culprit is likely in the cascade contributions and the equipartition between cascade rates into and . The size of the discrepancy we see suggests errors in the relative level populations of about 20% or so. As we noted earlier in connection with the comparison of Smith et al. (2001) and Porquet et al. (2001) predicted R ratios, uncertainties of at least 10% or so are clearly present in these calculations.
In this study, we emphasize trends with the observed R ratio itself, in addition to the values of the derived plasma densities. While it appears that only the Si R ratio is significantly affected by the model discrepancies described above, it should be kept in mind in the following discussion that there is an inherent systematic uncertainty in converting the observed ratios to densities, in addition to photon counting statistics.
4.2 Densities
We characterise the general R ratio and plasma density findings here as follows:
-
1.
R ratios and, consequently, plasma densities at temperatures of K are all very similar, with typical densities of cm-3 and a scatter between different stars of approximately a factor of 2.
-
2.
We find a trend of higher plasma density in sources with higher coronal temperatures, and with higher coronal X-ray luminosities. This trend is less obvious when cast in terms of surface flux, and more obvious when viewed as a function of the ratio of X-ray to bolometric luminosities.
-
3.
In all the stars studied, the observed Si XIII R ratios are above or similar to the predicted low density limit. At face value this indicates that no star has a coronal plasma density cm-3 at temperatures of K or higher.
The general finding of higher plasma densities at higher temperatures in active stars has already been suggested by the growing bulk of work from other EUV and X-ray observations of active stars (e.g., Bowyer, Drake & Vennes 2000 and Drake 2001 for summaries of EUVE studies; Brickhouse 2002, Sanz-Forcada et al. 2002,2003ab, Huenemoerder et al. 2001, Argiroffi et al. 2003). Our survey here confirms the findings of the earlier work; the EUV studies were often not unambiguous, owing to the possible influence of lines blending with the density-sensitive diagnostics (e.g. Drake 2001). Indeed, the upper limit of cm-3 imposed by Si XIII for all stars of our sample casts doubt on findings from some Fe EUV line ratios of densities cm-3, as reported, e.g., by Sanz-Forcada et al. (2003a), though we have to keep in mind possible inaccuracies in the theoretical Si XIII R ratio.
The results for different groups of stars are summarized below. Among our results, coronal density estimates are presented here for the first time for several sources of our sample: the single dwarf EV Lac, the giants HD 223460, Canopus and Vel, and the RS CVns TY Pyx and IM Peg. For the remaining sources, the results we obtain here are compared with findings of previous works in Tables 5 and 5.
4.2.1 Single Dwarfs
In single dwarfs, excluding the peculiar case of TW Hya that we will shortly discuss below, high density seems to be associated to the presence of evident flaring events as observed for AU Mic (Monsignori Fossi et al. 1996; Magee et al. 2003), Proxima Cen (Güdel et al. 2002), and EV Lac888EV Lac X-ray observations prior to the Chandra and XMM-Newton era comprise only low resolution studies, including those of BeppoSAX and ROSAT (e.g., Sciortino et al. 1999), and ASCA (e.g., Favata et al. 2000), in which direct density diagnostics are unavailable. (this work).
The results obtained for single dwarfs are generally compatible with the results present in the literature (see Table 5), at lower temperatures (2-3 MK), while some disagreement is present for higher temperatures (6-10 MK). For example for the rapidly rotating zero age main sequence K0 dwarf AB Dor, our density estimates are in good agreement with the finding of Sanz-Forcada, Maggio & Micela (2003b), based on both XMM-Newton and Chandra spectra, though their estimate from Mg XI is slightly higher than our estimate, possibly because of the blending due to Ne and Fe that we have taken into account here. However, our results for Mg are somewhat in conflict with the analysis of Fe XIX-XXII lines in EUVE, Chandra and XMM-Newton spectra by Sanz-Forcada et al. (2002,2003a), who find somewhat higher densities of cm-3. In particular, the densities estimated from X-ray Fe lines by Sanz-Forcada et al. (2003a) span an order of magnitude. While it is possible that the slightly higher temperatures probed by these Fe lines could be characterized by significantly higher densities than the plasma responsible for the Mg XI lines, the limits placed on the density by the Mg lines tend to rule out the presence of significant amounts of plasma at densities close to cm-3.
TW Hya
The same Chandra-HETG spectra of the pre-main sequence T Tauri star TW Hya have been analyzed by Kastner et al. (2002), who reported similar results to those obtained here: the Mg XI lines have not been detected, and the O VII lines yield cm-3. The O VII spectral region of TW Hya is strikingly different from the spectra of all the other sources in our sample that yield invariably close to cm-3. Stelzer & Schmitt (2004) analyzed XMM-Newton observations of TW Hya at both high (with the Reflection Grating Spectrometer) and intermediate (with the European Photon Imaging Camera) spectral resolution, finding densities based on O VII in good agreement with our results and those of Kastner et al. (2002). Since, during the XMM-Newton observations no clear flare is detected, Stelzer & Schmitt (2004) conclude that the unusually high density found in TW Hya is not due to any flaring activity. Echoing Kastner et al. (2002) and Stelzer & Schmitt (2004), the X-ray emission from TW Hya seems radically different from that typical of stellar coronae, supporting conjectures that it originates from a fundamentally different plasma, such as one heated by a shock at the bottom of an accretion column.
4.2.2 Single Giants
None of the spectra of the single giants analysed here yielded useful measurements of the O VII lines. In the case of Mg XI, however, we find clear indication of high densities of a few cm-3 for all the giants except Vel, for which both HEG and MEG measurements suggest that is compatible with the low-density limit ( cm-3).
One remarkable result among the giants is that the coronal density in the case of the supergiant Canopus appears to be high—of the order of cm-3 indicated by Mg XI at temperatures K. Consequently, the surface filling factor is tiny—a few millionths of the stellar surface. We discuss filling factors for the sample as a whole in more detail below.
4.2.3 Active Binaries
Conspicuous among the active binaries is the clear indication of high densities— cm-3—from the Mg line analysis for most systems. Most of the upper limits found correspond to HEG measurements that are generally affected by larger statistical uncertainties.
Several previous analyses of spectra of the active stars of our sample exist, as summarized in Table 5. EUVE spectra of active binaries were analyzed by Sanz-Forcada et al. (2001, 2002), who estimated plasma densities using Fe XIX-XXII lines (T10 MK), and invariably found - cm-3. Other earlier EUVE results are summarized by Drake (2001) and Bowyer, Drake & Vennes (2000); Ness et al. (2002a, 2002b) presented an analysis of X-ray spectra obtained with the Chandra Low Energy Transmission Grating Spectrometer (LETGS) that provides a slightly higher sensitivity to the O VII lines than the HETG+ACIS-S combination.
Some inconsistencies exist between our and earlier results for high temperature plasma ( K). For example, Brickhouse & Dupree (1998) estimated cm-3 up to cm-3, diagnosed from Fe XIX-XXII (MK) lines in EUVE spectra of 44 Boo. Again, our Si XIII, and possibly Mg XI, densities seem incompatible with the EUV estimates based on Fe lines, suggesting that the latter might be spuriously high. As previously mentioned, the effect of lines blending with the density-sensitive diagnostics (e.g. Drake 2001), or an inaccurate theoretical Si XIII R ratio, might be responsible for this disagreement.
4.2.4 General Trends
Taking advantage of the large star sample analyzed, we investigated the presence of any specific trend related to the physical characteristics of the observed stars. We mainly concentrated on the results obtained from the Mg XI measurements, since this is the most complete sample.
We first investigated trends in R ratio with stellar fundamental parameters such as effective temperature and surface gravity. A correlation with surface gravity might be expected, for example, because surface gravity dictates the density and pressure that would characterise the plasma under hydrostatic equilibrium. The underlying stellar effective temperature might be expected to have a more subtle influence on coronal gas properties. In fact, we did not find any evident trend of the measured R ratios or derived densities with surface gravity or effective temperature. The most graphic illustration of this is when contrasting the giants, including the supergiant Canopus, and the dwarfs. R ratios are indistinguishable between these groups.
Perhaps more surprising, we also do not see obvious trends of the measured R ratio with rotation period or Rossby number. Instead, the only obvious trend in the R ratios is with stellar X-ray luminosity, and in the ratio of X-ray luminosity to bolometric luminosity, LX/Lbol. The former trend is shown in Figure 13, where we show the O VII, Mg XI and Si XIII R ratios as a function of both and the surface flux . While there is arguably no discernible trend in any of the ratios with , the Mg XI ratio shows a decrease in R ratio for erg s-1 or so. It is tempting to see the same trend in the Si XIII R ratio for erg s-1, but there are simply too few observations at the highest X-ray luminosities. The O VII R ratio is essentially the same for the whole range of surface fluxes and X-ray luminosities.
The trend of declining Mg XI R ratio in more active stars becomes more clear when shown as a function of LX/Lbol, as shown in Figure 16. We consider the derived densities for O VII and Mg XI as a function of and in Figure 15: a significant fraction of the measurements here formally yield upper limits to the plasma density and these tend to obscure the results that are more obvious in Figure 13—it is only when the measured R ratio sample is taken together than the trends clearly emerge. Nevertheless, the trend of increasing density derived from Mg XI is still apparent at erg s-1 or so; below this value the results are characterised more by upper limits.
We emphasise that this trend of Mg XI R ratio and derived density with LX is not determined by a possible selection effect related to the signal-to-noise ratio of the HETG spectra; in fact the relative error on the Mg XI R measurement, (R)/R, has no specific trend with LX.
4.2.5 Density correlated with Ne/Mg?
In §3.3, we pointed out an apparent trend of measured Mg XI R ratio with Ne X/Mg XI line strength seen in Figure 9. We do not believe this trend is a result of residual blending; instead we suggest that we are seeing a trend of coronal abundance variation in which the Ne/Mg ratio is higher in stars characterised by higher Mg XI R ratios—higher density at temperatures of K. Such a result might be expected based on the emerging trend of coronal abundance anomalies in active stars. The coronae of RS CVn-type binaries, in particular, exhibit high Ne/Fe abundances compared to their expected photospheric compositions (see e.g. reviews by Drake et al. 2003, Audard et al. 2003). Since we see in this study good evidence for a trend of decreasing Mg XI R ratio with increasing , the correlation of Ne X/Mg XI line strength with Mg XI R ratio would be expected if the Ne/Mg abundance ratio increased with . While the Ne/Mg abundance ratio remains to be investigated thoroughly in the stars of our sample, the evidence from analyses to date summarised by Drake (2003) and Audard (2003) does suggest that the relative Ne enhancement increases with stellar activity.
4.3 Filling factors
One of the most important aspects of density measurements is the associated insight into the structuring of the plasma and into the emitting volume. In the stellar application, we can also use the density information to investigate coronal filling factors. For coronal line emission we can write , for the intensity of a line emitted by optically thin plasma. In the isothermal approximation we have where is the volume emission measure and is the contribution function of the emission line . If we further assume that the plasma is at the temperature of maximum formation of the line , we end up with a lower limit for the EM of the plasma emitting that line. In turn, from EM we obtain an estimate of the surface coronal filling factor defined as
where is the scale height of the emitting plasma and is the surface area of the star. A possible choice of is given by the hypothesis that the emitting coronal plasma is confined in hydrostatic loops smaller than, or comparable to, the pressure scale height. Under this assumption we can use the scaling laws of an hydrostatic loop model, such as that of Rosner, Tucker & Vaiana (1978; RTV) for which . In this way, from the measured densities and assuming a temperature equal to the temperature of maximum formation of the line we can derive an estimate of the filling factors.
In Fig. 17 we illustrate the surface filling factors, , derived from Mg XI as a function of the rotation period and of the Rossby number. There is a sharp increase in filling factor at rotation periods of 3-4 days, below which the filling factor appears to saturate at values of several percent of the stellar surface, and above which there is an approximately linear trend between logarithmic rotation period and filling factor. A rotation period of 3-4 days also marks the general location of coronal “saturation”, and the saturation of filling factor here is not a surprise. We note that Canopus, whose rotation period is not accurately known (e.g. Decin et al. 2003), is missing from Fig. 17. Nevertheless, if its rotation period is of order several hundred days it would not be out of place in the relation between filling factor and period for d.
Figure 18 illustrates the filling factors derived from both Mg XI and O VII lines vs. X-ray luminosity and surface flux. In order to have a more complete sample and investigate the relation with X-ray emission, we assumed an electron density of cm-3 for the stars whose O VII lines were not measurable. This is not unreasonable given that almost all the spectra of our active stars (with rare exceptions like the case of TW Hya) yield close to this value; this estimate is also supported by analyses of Chandra LETGS and XMM-Newton observations of some of the sources of our sample for which we did not obtain O VII measurements, like 31 Com (Scelsi et al. 2004), Algol (Ness et al. 2002b), UX Ari (Ness et al. 2002a) and Prox Cen (Güdel et al. 2002). Nevertheless, it is notable that we find filling factors —a nonsensical value—for three of the active binaries (ER Vul, TY Pyx, and AR Lac) for which we assume the common density value, indicating that the true density at a few K in these stars must be higher than cm-3, or that the assumed scale height is too low.
With some degree of scatter, the O VII filling factor, , is directly proportional to the X-ray surface flux. It is interesting that this filling factor begins to saturate—i.e. reach values between 0.1 and 1—at a mean surface flux of erg cm-2 s-1. While our data are sparse here, this saturation of seems to occur at surface flux values approximately one order of magnitude lower than the surface fluxes of the most active stars in the sample. The same value of surface flux, erg s-1 cm-2, was found for the areas of the solar surface covered with active regions by Withbroe & Noyes (1977). This suggests then, that at plasma temperatures of up to a few K these “O VII saturated” stars are essentially covered in active regions possibly similar in nature to those of the Sun.
The behaviour of the Mg XI filling factor is different. Firstly, there is a clear break in the - relation at the same surface flux level, erg s-1 cm-2, as we see saturate. At lower levels, the - relation appears to have a shallower slope than that for vs. though the level of scatter precludes a definitive statement.
Finally, we examine the relative behavior of the two filling factors, and in Fig. 19. For , the two factors are approximately proportional to one another. For , increases much more sharply than . At higher activity levels (i.e. higher ) the coronae are preferentially filling with hotter plasma with respect to the cooler plasma emitting the O VII lines.
4.4 Summary
The density and filling factor results suggest a scenario that has been outlined before based on the emission measure distributions as a function of temperature of active dwarfs as compared to those of solar active regions by Drake et al. (2000; see also Güdel 1997): going toward activity levels higher than the Sun the trend appears to be one of increased filling factor of solar-like active regions characterised by essentially the same plasma density of cm-3. For these active stars, there is an attendant hot, high density plasma with cm-3 whose contribution to the total X-ray increases toward higher activity stars.
As the surface becomes “saturated”, or full, of active regions, with filling factors between 0.1 and 1, the nature of the corona begins to change. This surface saturation occurs at X-ray luminosities well below the highest observed for the most active stars—by an order of magnitude or two. Drake et al. (2000) and Güdel (1997) suggested that interaction between adjacent active regions could give rise to increased flaring behaviour which is manifest as the growth of the hotter K corona characterised in the Mg XI R ratio by higher plasma densities, and with a concomitant increase in the filling factor of this plasma.
The quite different gas densities found for “high” and “low” coronal temperatures reinforces the fact that the dominant emission at these temperatures cannot originate from the same structures: models seeking to explain active coronae need to account for the increase in gas pressure with increasing temperature.
5 Conclusions
We have investigated the density of coronal plasma at different temperatures through the analysis of the He-like triplet of O, Mg, and Si in high spectral resolution X-ray observations obtained with Chandra of a wide sample of active stars. As in previous works in the literature (e.g. Brickhouse 2002, Ness et al. 2003) the unprecedented Chandra spectrometer resolution proves to be vital for an accurate analysis: in this work we have especially emphasised the effect of lines blending with the Mg XI triplet lines and the need to take these into account in order to obtain reliable measurements of the R ratio. Ignoring these blends results in R ratios significantly different from values obtained when blends are accounted for.
Our measured R and G ratios provide some insights into the propriety of recent theoretical calculations of the relative line strengths from He-like ions. In the case of Si XIII, we find some evidence suggesting that the low density limit ratios predicted by both APED and Porquet et al. (2001) are too low by 20-40% or so based on our observed values. Temperatures inferred from theoretical G ratios also tend to be lower than expected. We tentatively identify the cascade contributions from dielectronic recombination as the likely culprit for modelling inaccuracies.
For most of the observed sources in which O VII yielded a useful R ratio measurement, we find for plasma at temperatures of a few K densities of cm-3. Mg XI lines formed closer to K yielded densities cm-3 confirming the scenario outlined in the recent literature in which hotter ( MK) plasma is characterized by densities two orders of magnitude higher than the cooler plasma, and in which the latter has both temperature and density similar to those characterising solar coronal active regions. No star shows good evidence for Si XIII R ratios significantly below the theoretical low density limits; while this might partly be a problem associated with the theoretical ratios, which appear too low, it seems clear that there are no stars with electron densities significantly above cm-3. This result casts some doubt on earlier studies based on Fe XX-XXII lines seen in EUVE spectra which suggested the presence of densities exceeding cm-3 in active stellar coronae.
We have found a distinct correlation between the measured Mg XI R ratio and X-ray luminosity, with lower R ratios, and by inference, higher densities, found in more X-ray luminous coronae. This trend is also visible as a function of the X-ray “production efficiency”, LX/Lbol. Instead, no correlations were found between R ratio and stellar parameters surface gravity and effective temperature, or with Rossby number.
The surface coronal filling factors obtained from our density estimates are significantly smaller for the hotter plasma with K, with , than for the cooler - K plasma characterized by values in the range . The remarkably small filling factors for hot plasma suggest the potential for studying X-ray rotational modulation using the hotter lines available in high resolution X-ray spectra. In this regard, we note that Marino et al. (2003) have recently found for the first time X-ray rotational modulation in a supersaturated star; Orlando et al. (2004) also show that such rotational modulation may be present in the hardness ratio.
The O VII filling factor, , is found to be directly proportional to the X-ray surface flux, and reaches values between 0.1 and 1 at a mean surface flux of erg cm-2 s-1—the same surface flux that characterises solar active regions. Instead, at higher temperatures the - relation shows a break at the same surface flux level, erg s-1 cm-2, after which it increases more strongly with increasing surface flux.
The density and filling factor results suggest the following picture: at plasma temperatures of up to a few K, stars with increasingly higher activity level become more and more covered with solar-like active regions with cm-3. At the same time, there is a similar growth in hotter plasma with temperatures close to K, and with cm-3. This hotter plasma is likely associated with continuous superimposed flaring activity associated with the active regions, analogous to the solar case. For stars at the “O VII saturated” level, when X-ray surface fluxes are similar to that of active regions on the solar surface, the whole star is essentially covered by active regions. Further growth in X-ray emission at higher activity levels still is in the form of increased flaring, probably arising because of the crowding of active magnetic structures on the stellar surface. This activity gives rise to a growth in the surface coverage of K plasma at higher densities of cm-3. This picture is essentially that described earlier by Güdel (1997) and Drake et al. (2000).
| Source | HD | Spectr. | d aafrom the SIMBAD database | R⋆/R⊙ | M⋆/M⊙ bbfrom ref. (11) when no other reference is indicated | B-V ccfrom SIMBAD when no other reference is indicated | log(Lbol) ddif not differently indicated, derived as described by Flower (1996) | Porb eefrom ref. (11) when no other reference is indicated; for Cet, Canopus and Vel the listed values are upper limits derived from sen | Prot eefrom ref. (11) when no other reference is indicated; for Cet, Canopus and Vel the listed values are upper limits derived from sen | ffThe Rossby number, , is defined as the ratio between the observed rotation period, , and the convective turnover time, , derived from theoretical models (Pizzolato et al. 2001) | |||||||||||||||||||||||||||||||||||||||||||||||||||||||||
|---|---|---|---|---|---|---|---|---|---|---|---|---|---|---|---|---|---|---|---|---|---|---|---|---|---|---|---|---|---|---|---|---|---|---|---|---|---|---|---|---|---|---|---|---|---|---|---|---|---|---|---|---|---|---|---|---|---|---|---|---|---|---|---|---|---|---|---|
| Type | [pc] | [K] | [erg/sec] | [days] | [days] | ||||||||||||||||||||||||||||||||||||||||||||||||||||||||||||||
| AU Mic | 197481 | M1V | 9.9 | 0.56 11footnotemark: | 0.59 11footnotemark: | 3730 2727footnotemark: | 1.44 3737footnotemark: | 32.48 3939footnotemark: | 4.854 4343footnotemark: | 0.024 | |||||||||||||||||||||||||||||||||||||||||||||||||||||||||
| Prox Cen | M5Ve | 1.3 | 0.16 22footnotemark: | 0.11 2020footnotemark: | 2700 2828footnotemark: | 1.97 | 30.58 | 83.5 4444footnotemark: | |||||||||||||||||||||||||||||||||||||||||||||||||||||||||||
| EV Lac | M4.5V | 5.1 | 0.41 33footnotemark: | 0.34 33footnotemark: | 3300 2929footnotemark: | 1.57 | 31.62 33footnotemark: | 4.376 4545footnotemark: | |||||||||||||||||||||||||||||||||||||||||||||||||||||||||||
| AB Dor | 36705 | K0V | 15 | 1. 44footnotemark: | 0.76 44footnotemark: | 5000 3030footnotemark: | 0.80 3838footnotemark: | 33.18 4040footnotemark: | 0.51479 4646footnotemark: | 0.0038 | |||||||||||||||||||||||||||||||||||||||||||||||||||||||||
| TW Hya | K8Ve | 56 | 1. 55footnotemark: | 0.7 55footnotemark: | 4150 3131footnotemark: | 0.7 3838footnotemark: | 2.9 4747footnotemark: | 0.019 | |||||||||||||||||||||||||||||||||||||||||||||||||||||||||||
| 223460 | G1 III | 135 | 13.6 66footnotemark: | 2.9 2121footnotemark: | 5110 2121footnotemark: | 0.81 66footnotemark: | 35.43 | 23.25 66footnotemark: | 0.19 | ||||||||||||||||||||||||||||||||||||||||||||||||||||||||||
| 31 Com | 111812 | G0 III | 94 | 8 77footnotemark: | 2.96 2222footnotemark: | 5320 2121footnotemark: | 0.68 | 35.41 77footnotemark: | 4848footnotemark: | 0.23 | |||||||||||||||||||||||||||||||||||||||||||||||||||||||||
| Ceti | 4128 | K0III | 29.4 | 15.1 77footnotemark: | 3.2 2121footnotemark: | 4840 2121footnotemark: | 1.2 77footnotemark: | 35.77 | 2121footnotemark: | 0.27 | |||||||||||||||||||||||||||||||||||||||||||||||||||||||||
| Canopus | 45348 | F0II | 95.9 | 53 88footnotemark: | 13 2323footnotemark: | 7350 2323footnotemark: | 0.15 3838footnotemark: | 37.70 4141footnotemark: | 2323footnotemark: | ||||||||||||||||||||||||||||||||||||||||||||||||||||||||||
| Vel | 93497 | G5III/… | 35.5 | 13 99footnotemark: | 3 99footnotemark: | 4862 3232footnotemark: | 0.90 | 35.62 | 3232footnotemark: | 0.38 | |||||||||||||||||||||||||||||||||||||||||||||||||||||||||
| Algol | 19356 | B8V/K1IV | 28 | 2.9/3.5 1010footnotemark: | 3.7/0.8 2424footnotemark: | 11400/5300 2424footnotemark: | 34.47 | 2.8 1010footnotemark: | 2.8 1010footnotemark: | 0.024 | |||||||||||||||||||||||||||||||||||||||||||||||||||||||||
| ER Vul | 200391 | G0V/G5V | 50 | 1.07/1.07 1111footnotemark: | 1.10/1.05 | 6000/5619 3333footnotemark: | 0.68 | 33.89 4242footnotemark: | 0.6981 | 0.6942 | 0.0077 | ||||||||||||||||||||||||||||||||||||||||||||||||||||||||
| 44 Boo | 133640 | G1V/G2V | 13 | 0.87/0.66 1212footnotemark: | 0.98/0.55 1212footnotemark: | 5300/5035 1212footnotemark: | 0.65 | 33.82 | 0.267 | 0.0036 | |||||||||||||||||||||||||||||||||||||||||||||||||||||||||
| TZ CrB | 146361 | G0V/G0V | 22 | 1.1/1.1 1313footnotemark: | 1.12/1.14 | 6000/6000 1313footnotemark: | 0.51 | 33.88 4242footnotemark: | 1.1398 | 1.1687 | 0.016 | ||||||||||||||||||||||||||||||||||||||||||||||||||||||||
| UX Ari | 21242 | G5V/K0IV | 50 | 1.11/5.78 1414footnotemark: | …/4800 3434footnotemark: | 0.91 | 34.49 4242footnotemark: | 6.4379 | 6.4379 | 0.042 | |||||||||||||||||||||||||||||||||||||||||||||||||||||||||
| UMa | 98230 | G0V/G0V | 7.7 | 0.95/… 1515footnotemark: | 0.92/… 2525footnotemark: | 5650 2525footnotemark: | 0.59 | 33.35 4242footnotemark: | 3.9805 | 0.044 | |||||||||||||||||||||||||||||||||||||||||||||||||||||||||
| II Peg | 224085 | K2V/… | 42 | 3.4/… 1616footnotemark: | 0.8/… | 4600 1616footnotemark: | 1.01 | 34.17 4949footnotemark: | 6.7242 | 6.718 | 0.056 | ||||||||||||||||||||||||||||||||||||||||||||||||||||||||
| And | 222107 | G8III/… | 26 | 7.4/… 1717footnotemark: | 0.65/… 2626footnotemark: | 4800 2626footnotemark: | 1.01 | 34.80 | 20.521 | 53.952 | 0.31 | ||||||||||||||||||||||||||||||||||||||||||||||||||||||||
| TY Pyx | 77137 | G5IV/G5IV | 56 | 1.59/1.68 1818footnotemark: | 1.22/1.20 1818footnotemark: | 5400/5400 1818footnotemark: | 0.72/0.76 | 34.26 4242footnotemark: | 3.1986 | 3.32 | 0.25 | ||||||||||||||||||||||||||||||||||||||||||||||||||||||||
| AR Lac | 210334 | G2IV/K0IV | 42 | 1.8/3.1 1111footnotemark: | …/5100 3535footnotemark: | 0.72 | 34.49 4242footnotemark: | 1.9832 | 1.9832 | 0.018 | |||||||||||||||||||||||||||||||||||||||||||||||||||||||||
| HR 1099 | 22468 | G5IV/K1IV | 29.0 | 1.3/3.9 1111footnotemark: | 1.1/1.4 | 5400/4800 3636footnotemark: | 0.92 1111footnotemark: | 34.31 4242footnotemark: | 2.8377 | 2.841 | 0.0076 | ||||||||||||||||||||||||||||||||||||||||||||||||||||||||
| IM Peg | 216489 | K2III-II/… | 96.8 | 13/… 1919footnotemark: | 1.5/… 1919footnotemark: | 4450 1919footnotemark: | 1.12 | 35.35 4242footnotemark: | 24.65 | 24.39 | 0.036 | ||||||||||||||||||||||||||||||||||||||||||||||||||||||||
|
|||||||||||||||||||||||||||||||||||||||||||||||||||||||||||||||||||
| Source | Obs ID | LX aarelative to the HEG range: 1.5-15Å | LX bbrelative to the MEG range: 2-24Å | FX ccfrom LX obtained from MEG spectra | |
|---|---|---|---|---|---|
| [erg/sec] | [erg/sec] | [erg/cm2/sec] | [ksec] | ||
| AU Mic | 17 | 1.05 | 1.29 | 60.7 | 58.8 |
| Prox Cen | 2388 | 3.33 | 4.56 | 2.93 | 42.4 |
| EV Lac | 1885 | 2.59 | 3.19 | 31.1 | 100 |
| AB Dor | 16 | 6.83 | 8.26 | 136 | 52.3 |
| TW Hya | 5 | 1.15 | 1.30 | 214 | 47.7 |
| HD 223460 | 1892 | 6.31 | 5.96 | 52.9 | 95.7 |
| 31 Com | 1891 | 4.85 | 5.15 | 13.2 | 130.2 |
| Ceti | 974 | 2.16 | 2.62 | 1.89 | 86.1 |
| Canopus | 636 | 2.48 | 2.94 | 0.17 | 94.6 |
| Vel | 1890 | 1.19 | 1.41 | 1.37 | 19.7 |
| Vel | 3410 | 1.17 | 1.45 | 1.4 | 57 |
| Algol | 604 | 8.50 | 8.88 | 119 | 51.7 |
| ER Vul | 1887 | 2.46 | 2.78 | 399 | 112.0 |
| 44 Boo | 14 | 3.59 | 4.56 | 172 | 59.1 |
| TZ CrB | 15 | 2.99 | 3.34 | 453 | 83.7 |
| UX Ari | 605 | 5.69 | 7.26 | 35.7 | 48.5 |
| UMa | 1894 | 8.78 | 1.23 | 22.4 | 70.9 |
| II Peg | 1451 | 1.56 | 1.76 | 250 | 42.7 |
| And | 609 | 1.34 | 1.85 | 5.55 | 81.9 |
| TY Pyx | 601 | 4.71 | 5.10 | 573 | 49.1 |
| AR Lac | 6 | 5.21 | 5.60 | 284 | 32.1 |
| AR Lac | 9 | 5.61 | 6.30 | 319 | 32.2 |
| HR 1099 | 62538 | 7.85 | 1.05 | 113 | 94.7 |
| IM Peg | 2527 | 2.75 | 2.79 | 27.1 | 24.6 |
| IM Peg | 2528 | 2.17 | 2.30 | 22.3 | 24.8 |
| IM Peg | 2529 | 1.86 | 1.97 | 19.2 | 24.8 |
Note. — In order to calculate the X-ray surface flux, , for binary systems, we used the radius of the component which probably is the stronger X-ray source, e.g. the K1IV component for Algol.
| ion | wavelength (Å) | ||
|---|---|---|---|
| resonance (r) | intercombination (i) | forbidden (f) | |
| 1s2 1S0 - 1s2p 1P1 | 1s2 1S0 - 1s2p 3P2,1 | 1s2 1S0 - 1s2s 3S1 | |
| Si XIII | 6.6479 | 6.6850 / 6.6882 | 6.7403 |
| Mg XI | 9.1687 | 9.2282 / 9.2312 | 9.3143 |
| O VII | 21.6015 | 21.8010 / 21.8036 | 22.0977 |
| transition | Ly: 21 | Ly: 31 | 41 | 51 | 61 | 71 | 81 | 91 | 101 |
|---|---|---|---|---|---|---|---|---|---|
| (Å) | 12.134 | 10.239 | 9.708 | 9.481 | 9.362 | 9.291 | 9.246 | 9.215 | 9.194 |
| f aaoscillator strength normalized to the -value of the Ly transition. | 1.0000 | 0.1900 | 0.0697 | 0.0335 | 0.01874 | 0.01157 | 0.0076 | 0.0053 | 0.0038 |
| aaFrom the fit to the HEG coadded spectrum of Ceti, TZ CrB, AR Lac, and HR 1099 shown in Fig. 7. | Ion | transition | EmissivitybbPeak line emissivity from the APED database for an electron density , and assuming the chemical composition of Anders & Grevesse (1989). The excitation rate for a Maxwellian distribution of electron velocities for higher series in hydrogenic ions is essentially proportional to the -value of the transition (e.g., Lang 1999); since emissivities for the Ne Lyman series lines do not appear to be available for upper level , the emissivities listed here are the APED emissivity of the transition, scaled in proportion to the transition -values oscillator strengths (see Tab. 4). | |
|---|---|---|---|---|
| [Å] | [ph cm3s-1] | |||
| 9.1689 | Mg XI | 1.10 | ||
| 9.1900 | Fe XXI | 1.14 | ||
| Fe XX | 3.29 | |||
| Ne X | 101 | 1 | ||
| 9.2187 | Fe XX | 1.63 | ||
| Ne X | 91 | 1.4 | ||
| 9.2304 | Mg XI | 1.60, 2.23 | ||
| 9.2467 | Ne X | 81 | 2.1 | |
| 9.2882 | Ne X | 71 | 3.1 | |
| Fe XX | 2.82 | |||
| Fe XXII | 1.37 | |||
| 9.3144 | Mg XI | 5.31 |
| Source | grating | flux aar, resonance line, i, intercombination lines, f, forbidden line, corresponding to the transitions described in Table 3. | ||||||||||
|---|---|---|---|---|---|---|---|---|---|---|---|---|
| Si XIII | Mg XI | O VII | ||||||||||
| AU Mic | HEG | - | - | - | - | - | - | |||||
| MEG | ||||||||||||
| Prox Cen | HEG | - | - | - | - | - | - | - | - | - | ||
| MEG | - | - | - | |||||||||
| EV Lac | HEG | - | - | - | ||||||||
| MEG | ||||||||||||
| AB Dor | HEG | - | - | - | ||||||||
| MEG | ||||||||||||
| TW Hya | HEG | - | - | - | - | - | - | - | - | - | ||
| MEG | - | - | - | |||||||||
| HD 223460 | HEG | - | - | - | - | - | - | |||||
| MEG | - | - | ||||||||||
| 31 Com | HEG | - | - | - | ||||||||
| MEG | - | - | ||||||||||
| Cet | HEG | - | - | - | ||||||||
| MEG | - | - | ||||||||||
| Canopus | HEG | - | - | - | - | - | - | |||||
| MEG | - | - | ||||||||||
| Vel | HEG | - | - | - | ||||||||
| MEG | - | - | ||||||||||
| Algol | HEG | - | - | - | ||||||||
| MEG | - | - | ||||||||||
| ER Vul | HEG | - | - | - | ||||||||
| MEG | - | - | ||||||||||
| 44 Boo | HEG | - | - | - | ||||||||
| MEG | ||||||||||||
| TZ CrB | HEG | - | - | - | ||||||||
| MEG | ||||||||||||
| UX Ari | HEG | - | - | - | ||||||||
| MEG | ||||||||||||
| UMa | HEG | - | - | - | ||||||||
| MEG | ||||||||||||
| II Peg | HEG | - | - | - | ||||||||
| MEG | - | - | - | |||||||||
| And | HEG | - | - | - | ||||||||
| MEG | ||||||||||||
| TY Pyx | HEG | - | - | - | - | - | - | |||||
| MEG | - | - | ||||||||||
| AR Lac | HEG | - | - | - | ||||||||
| MEG | - | - | ||||||||||
| HR 1099 | HEG | - | - | - | ||||||||
| MEG | ||||||||||||
| IM Peg | HEG | - | - | - | - | - | - | |||||
| MEG | - | - | ||||||||||
| Source | flux aafluxes, in photons cm-2 sec-1, from MEG spectra, with 1 errors. | ||||
|---|---|---|---|---|---|
| Mg XII | Ne X | O VIII | Fe XVIII | Fe XXI | |
| Ly | Ly | Ly | |||
| 8.419Å | 12.132Å | 18.967Å | 14.210Å | 12.292Å | |
| AU Mic | |||||
| Prox Cen | - | - | - | ||
| EV Lac | |||||
| AB Dor | |||||
| TW Hya | - | - | - | ||
| HD 223460 | |||||
| 31 Com | |||||
| Cet | |||||
| Canopus | |||||
| Vel | |||||
| Algol | |||||
| ER Vul | |||||
| 44 Boo | |||||
| TZ CrB | |||||
| UX Ari | |||||
| UMa | |||||
| II Peg | |||||
| And | |||||
| TY Pyx | |||||
| AR Lac | |||||
| HR 1099 | |||||
| IM Peg | |||||
| SourceaaHorizontal lines divide the different classes of source into single dwarfs (top), single giants (middle), and active binaries (bottom). | (cm-3) | |||
|---|---|---|---|---|
| Mg XI | O VII | |||
| HEG | MEG | MEG | ||
| AU Mic | - | |||
| Prox Cen | - | - | ||
| EV Lac | ||||
| AB Dor | ||||
| TW Hya | - | - | ||
| HD 223460 | - | - | ||
| 31 Com | - | |||
| Cet | - | |||
| Canopus | - | - | ||
| Vel | - | |||
| Algol | - | |||
| ER Vul | - | |||
| 44 Boo | ||||
| TZ CrB | ||||
| UX Ari | - | |||
| UMa | ||||
| II Peg | ||||
| And | ||||
| TY Pyx | - | - | ||
| AR Lac | - | |||
| HR 1099 | ||||
| IM Peg | - | - | ||
| This work | Previous works | ||||||||
|---|---|---|---|---|---|---|---|---|---|
| SourceaaHorizontal lines divide the different classes of source into single dwarfs (top) and single giants (bottom). | TbbTemperature of maximum formation of the ion emitting the density sensitive lines used for the density diagnostics. | IonccIon emitting the density sensitive lines used for the diagnostics. | TbbTemperature of maximum formation of the ion emitting the density sensitive lines used for the density diagnostics. | IonccIon emitting the density sensitive lines used for the diagnostics. | dataddA: Chandra-HETGS; B: Chandra-LETGS; C: XMM-Newton-RGS; D: EUVE; E: FUSE; F: HST. | Ref. | |||
| [MK] | [cm-3] | [MK] | [cm-3] | ||||||
| AU Mic | 6.8 | MgXI | 7 | FeXXI | D | 1 | |||
| 6.3 | OVII | 6.3 | (flaring) | OVII | C | 2 | |||
| 6.3 | (quiescent) | OVII | C | 2 | |||||
| 5.3 | OV, OIV, SIV | D,E,F | 3,4 | ||||||
| Prox Cen | 6.8 | MgXI | 6.3 | (flaring) | OVII | C | 5 | ||
| 6.3 | (quiescent) | OVII | C | 5 | |||||
| AB Dor | 6.8 | MgXI | 7 | FeXXI-XXII | A,C,D | 6,7 | |||
| 6.3 | OVII | 6.3 | OVII | A,C | 8 | ||||
| TW Hya | 6.3 | OVII | 6.3 | OVII | A,C | 9,10 | |||
| HD 223460 | 6.8 | MgXI | 6.3-7 | – | OVII, NeIX, SiXII | C | 11 | ||
| 31 Com | 6.8 | MgXI | 6.3 | OVII | C | 12 | |||
| 5.2 | OIV | F | 13 | ||||||
| Cet | 6.8 | MgXI | 7 | FeXIX-XXII | D | 6 | |||
| 5.2 | OIV | F | 13 | ||||||
| Vel | 6.8 | MgXI | – | D | 14 | ||||
References. — (1) Monsignori Fossi et al. (1996); (2) Magee et al. (2003); (3) DelZanna, Landini & Mason (2002); (4) Redfield et al. (2002); (5) Güdel et al. (2002); (6) Sanz-Forcada et al. (2002); (7) Sanz-Forcada et al. (2003a); (8) Sanz-Forcada et al. (2003b); (9) Kastner et al. (2002); (10) Stelzer & Schmitt (2004); (11) Gondoin (2003); (12) Scelsi et al. (2004); (13) Ayres et al. (1998); (14) Ayres et al. (1999).
| This work | Previous works | ||||||||
|---|---|---|---|---|---|---|---|---|---|
| Source | TaaTemperature of maximum formation of the ion emitting the density sensitive lines used for the density diagnostics. | IonbbIon emitting the density sensitive lines used for the diagnostics. | TaaTemperature of maximum formation of the ion emitting the density sensitive lines used for the density diagnostics. | IonbbIon emitting the density sensitive lines used for the diagnostics. | dataccA: Chandra-HETGS; B: Chandra-LETGS; C: XMM-Newton-RGS; D: EUVE. | Ref. | |||
| [MK] | [cm-3] | [MK] | [cm-3] | ||||||
| Algol | 6.8 | MgXI | 6.1-6.3 | NVI, OVII | B | 1,2 | |||
| ER Vul | 6.8 | MgXI | 7 | FeXIX-XXI | D | 3 | |||
| 44 Boo | 6.8 | MgXI | 7 | FeXIX-XXI | D | 4 | |||
| 6.3 | OVII | ||||||||
| TZ CrB | 6.8 | MgXI | NeIX, MgXI, SiXII | A | 5 | ||||
| 6.3 | OVII | 6.3 | OVII | A | 5 | ||||
| UX Ari | 6.8 | MgXI | 7 | FeXIX-XXI | D | 6 | |||
| 6.6 | NeIX | B | 1 | ||||||
| 6.1 | NVI | B | 1 | ||||||
| UMa | 6.8 | MgXI | 7 | FeXIX-XXI | D | 3 | |||
| 6.3 | OVII | ||||||||
| II Peg | 6.8 | MgXI | 7 | FeXIX-XXI | D | 6 | |||
| 6.3 | OVII | 6.3 | OVII | A | 7 | ||||
| 6.8 | MgXI | A | 7 | ||||||
| 6.6 | NeIX | A | 7 | ||||||
| And | 6.8 | MgXI | 7 | FeXIX-XXI | D | 6 | |||
| AR Lac | 6.8 | MgXI | 6.8 | MgXI | A | 8 | |||
| 6.3 | OVII | A | 8 | ||||||
| HR 1099 | 6.8 | MgXI | 6.8 | MgXI | B | 1 | |||
| 6.3 | OVII | 6.6 | NeIX | B | 1 | ||||
| 6.3 | OVII | A,B | 9,1 | ||||||
| 6.3-7 | MgXI, SiXIII | A | 9 | ||||||
| 7 | FeXXI | D | 9 | ||||||
References. — (1) Ness et al. (2002a); (2) Ness et al. (2002b); (3) Sanz-Forcada et al. (2003a); (4) Brickhouse & Dupree (1998); (5) Osten et al. (2003); (6) Sanz-Forcada et al. (2002); (7) Huenemoerder et al. (2001); (8) Huenemoerder et al. (2003); (9) Ayres et al. (2001).


References
- Alencar & Batalha (2002) Alencar, S. H. P. & Batalha, C. 2002, ApJ, 571, 378
- Al-Naimiy (1981) Al-Naimiy, H. M. K. 1981, A&AS, 43, 85
- Anders & Grevesse (1989) Anders, E. & Grevesse, N. 1989, Geochim. Cosmochim. Acta, 53, 197
- Argiroffi et al. (2003) Argiroffi, C., Maggio, A., Peres, G. 2003, A&A, 404, 1033
- Audard (2003) Audard, M. 2003, Advances in Space Research, 32, 927
- Audard et al. (2001) Audard, M., Behar, E., Güdel, M., Raassen, A. J. J., Porquet, D., Mewe, R., Foley, C. R. & Bromage, G. E. 2001, A&A, 365, L329
- Ayres et al. (2001) Ayres, T.R, Brown, A., Osten, R.A., Huenemoerder, D. P., Drake, J. J., Brickhouse, N. S. & Linsky, J. L. 2001, ApJ, 549, 554
- Ayres et al. (1999) Ayres, T.R, Osten, R.A. & Brown, A. 1999, ApJ, 526, 445
- Ayres et al. (1998) Ayres, T.R., Simon, T., Stern, R.A., Drake, S.A., Wood, B.E. & Brown, A. 1998, ApJ, 496, 428
- Benedict et al. (1998) Benedict, G. F. et al. 1998, AJ, 116, 429
- Benedict et al. (1999) Benedict, G. F. et al. 1999, AJ, 118, 1086
- Berdyugina et al. (1999) Berdyugina, S.V., Ilyin, I. & Tuominen, I. 1999, A&A347, 932
- Berdyugina et al. (1998) Berdyugina, S.V., Jankov, S., Ilyin, I., Tuominen, I. & Fekel, F.C. 1998, A&A, 334, 863
- Bowyer et al. (2000) Bowyer, S., Drake, J. J. & Vennes, S. 2000, ARA&A, 38, 231
- Brickhouse (2002) Brickhouse, N. S. 2002, in Stellar Coronae in the Chandra and XMM-NEWTON Era, eds. Favata, F. and Drake, J.J., ASP Conf. Ser. 277, 13
- Brickhouse et al. (2001) Brickhouse, N.S., Dupree, A.K. & Young, P.R. 2001, ApJ, 562, L75
- Brickhouse & Dupree (1998) Brickhouse, N. S. & Dupree, A. K. 1998, ApJ, 502, 918
- Brinkman et al. (2000) Brinkman, A. C. et al. 2000, ApJ, 530, L111
- Canizares et al. (2000) Canizares, C. R. et al. 2000, ApJ, 539, L41
- Cayrel et al. (1994) Cayrel de Strobel, G., Cayrel, R., Friel, E., Zahn, J.-P., & Bentolila, C. 1994, A&A, 291, 505
- Contadakis (1995) Contadakis, M. E. 1995, A&A, 300, 819
- Decin et al. (2003) Decin, L., Vandenbussche, B., Waelkens, K., Eriksson, C., Gustafsson, B., Plez, B. & Sauval, A. J. 2003, A&A, 400, 695
- Del Zanna et al. (2002) Del Zanna, G., Landini, M. & Mason, H.E. 2002, A&A, 385, 968
- Donati et al. (1995) Donati, J.-F., Henry, G. W., & Hall, D. S. 1995, A&A, 293, 107
- Drake et al. (2000) Drake, J. J., Peres, G., Orlando, S., Laming, J. M. & Maggio, A. 2000, ApJ, 545, 1074
- Drake (2001) Drake, J. J. 2001, ASP Conf. Ser. 234: X-ray Astronomy 2000, 53
- Drake et al. (2001) Drake, J. J., Brickhouse, N. S., Kashyap, V., Laming, J. M., Huenemoerder, D. P., Smith, R. & Wargelin, B. J. 2001, ApJ, 548, L81
- Drake (2003) Drake, J. J. 2003, Advances in Space Research, 32, 945
- Drake et al. (1989) Drake, S. A., Simon, T., & Linsky, J. L. 1989, ApJS, 71, 905
- Duemmler & Aarum (2001) Duemmler, R. & Aarum, V. 2001, A&A, 370, 974
- Favata et al. (1995) Favata, F., Barbera, M., Micela, G., & Sciortino, S. 1995, A&A, 295, 147
- Favata et al. (2000) Favata, F., Reale, F., Micela, G., Sciortino, S., Maggio, A. & Matsumoto, H. 2000, A&A, 353, 987
- Flower (1996) Flower, P. J. 1996, ApJ, 469, 355
- Frogel et al. (1972) Frogel, J. A., Kleinmann, D. E., Kunkel, W., Ney, E. P., & Strecker, D. W. 1972, PASP, 84, 581
- Gabriel & Jordan (1969) Gabriel, A.H. & Jordan, C. 1969, MNRAS, 145, 241
- Gadun (1994) Gadun, A.S. 1994, AN, 315, 413
- Gehren et al. (1999) Gehren, T., Ottmann, R., & Reetz, J. 1999, A&A, 344, 221
- Gimenez et al. (1986) Gimenez, A., Fernandez-Figueroa, M.J., de Castro, E., Ballester, J.L. & Reglero, V. 1986, AJ, 92, 131
- Gliese et al. (1969) Gliese, W. 1969, Veroeffentlichungen des Astronomischen Rechen-Instituts Heidelberg, 22, 1
- Gondoin (2003) Gondoin, P. 2003, A&A, 409, 263
- Gondoin (1999) Gondoin, P. 1999, A&A, 352, 217
- Güdel et al. (2002) Güdel, M., Audard, M., Skinner, S. L. & Horvath, M. I. 2002, ApJ, 580, L73
- Güdel et al. (2001a) Güdel, M., Audard, M., Briggs, K, Haberl, F., Magee, H., Maggio, A., Mewe, R., Pallavicini, R. & Pye, J. 2001a, A&A, 365, L336
- Güdel et al. (2001b) Güdel, M., Audard, M., Magee, H., Franciosini, E., Grosso, N., Cordova, F. A., Pallavicini, R. & Mewe, R. 2001b, A&A, 365, L344
- Güdel (1997) Güdel, M. 1997, ApJ, 480, L121
- Hill et al. (1989) Hill, G., Fisher, W.A. & Holmgren, D. 1989, A&A, 211, 81
- Houdebine & Doyle (1994) Houdebine, E. R. & Doyle, J. G. 1994, A&A, 289, 185
- Huenemoerder et al. (2001) Huenemoerder, D.P., Canizares, C.R. & Schulz, N.S. 2001, ApJ, 559, 1135
- Hussain (1997) Hussain, G. A. J., Unruh, Y. C. & Collier Cameron, A. 1997, MNRAS, 288, 343
- Kashyap & Drake (2000) Kashyap, V. & Drake, J.J. 2000, Bull. Astron. Soc. India, 28, 475
- Kastner et al. (2002) Kastner, J. H., Huenemoerder, D. P., Schulz, N. S., Canizares, C. R. & Weintraub, D. A. 2002, ApJ, 567, 434
- Kato & Nakazaki (1989) Kato, T. & Nakazaki, S. 1989, ADNDT, 42, 313
- Katsova & Tsikoudi (1993) Katsova, M. M. & Tsikoudi, V. 1993, ApJ, 402, L9
- Laming (1998) Laming, J.M. 1998, ASP Conf. Ser. 154, The Tenth Cambridge Workshop on Cool Stars, Stellar Systems and the Sun, Edited by R. A. Donahue and J. A. Bookbinder, p.447
- Lang (1999) Lang, K. R. 1999, Astrophysical formulae Vol. 1/ K.R. Lang. New York : Springer, 1999. (Astronomy and astrophysics library, ISSN0941-7834), p.107
- Lanzafame et al. (2000) Lanzafame, A. C., Busà, I., & Rodonò, M. 2000, A&A, 362, 683
- Liedahl et al. (1995) Liedahl, D.A., Osterheld, A.L. & Goldstein, W.H. 1995, ApJ, 438, L115
- Linsky et al. (1982) Linsky, J. L., Bornmann, P. L., Carpenter, K. G., Hege, E. K., Wing, R. F., Giampapa, M. S., & Worden, S. P. 1982, ApJ, 260, 670
- Magee et al. (2003) Magee, H. R. M., Güdel, M., Audard, M. & Mewe, R. 2003, Advances in Space Research, 32, 1149
- Maggio et al. (2000) Maggio, A., Pallavicini, R., Reale, F. & Tagliaferri, G. 2000, A&A, 356, 627
- Mariska (1992) Mariska, J. T. 1992, in ”The solar transition region”, Cambridge Astrophysics Series, vol 22, Cambridge University Press
- Marino et al. (2003) Marino, A., Micela, G., Peres, G. & Sciortino, S. 2003, A&A, 407L, 63
- Marino et al. (1999) Marino, G., Rodonó, M., Leto, G. & Cutispoto, G. 1999, A&A, 352, 189
- Mewe et al. (2003) Mewe, R., Porquet, D., Raassen, A.J.J., Kaastra, J.S., Dubau, J. & Ness, J-U. 2003, Proceedings of the 12th Cambridge Workshop on Cool Stars, Stellar Systems, & the Sun, http://origins.Colorado.EDU/cs12/proceedings/poster/mewe.ps
- Monsignori Fossi et al. (1996) Monsignori Fossi, B. C., Landini, M., Del Zanna, G., & Bowyer, S. 1996, ApJ, 466, 427
- Murad & Budding (1984) Murad, I. M. & Budding, E. 1984, Ap&SS, 98, 163
- Muzerolle et al. (2000) Muzerolle, J., Calvet, N., Brice o, C., Hartmann, L. & Hillenbrand, L. 2000, ApJ, 535L, 47
- Nordgren et al. (1999) Nordgren, T.E. et al. 1999, AJ, 118, 3032
- Neff et al. (1996) Neff, J.E., Pagano, I., Rodonò, M., Brown, A., Dempsey, R.C., Fox, D.C. & Linsky, J.L. 1996, A&A, 310, 173
- Ness et al. (2003) Ness, J.U., Brickhouse, N. S., Drake, J. J. & Huenemoerder, D. P. 2003, ApJ, 598,1277
- Ness et al. (2002a) Ness, J.U., Schmitt, J.H.M.M., Burwitz, V., Mewe, R., Raassen, A. J. J., van der Meer, R. L. J. & Predehl, P., Brinkman, A. C. 2002a, A&A, 394, 911
- Ness et al. (2002b) Ness, J.U., Schmitt, J.H.M.M., Burwitz, V., Mewe, R. & Predehl, P. 2002b, A&A, 387, 1032
- Ness et al. (2001) Ness, J.U., Mewe, R., Schmitt, J. H. M. M., Raassen, A. J. J., Porquet, D., Kaastra, J. S., van der Meer, R. L. J., Burwitz, V. & Predehl, P. 2001, A&A, 367, 282
- Orlando, Peres, & Reale (2000) Orlando, S., Peres, G., & Reale, F. 2000, ApJ, 528, 524
- Orlando et al. (2004) Orlando, S., Peres, G. & Reale 2004, A&A, submitted
- Osten et al. (2003) Osten, R. A., Ayres, T. R., Brown, A., Linsky, J. L. & Krishnamurthi, A. 2003, ApJ, 582, 1073
- Padmakar (1999) Padmakar & Pandey, S. K. 1999, A&AS, 138, 203
- Pakull et al. (1981) Pakull, M. W. 1981, A&A, 104, 33
- Panzera et al. (1999) Panzera, M. R., Tagliaferri, G., Pasinetti, L., & Antonello, E. 1999, A&A, 348, 161
- Peres, Orlando & Reale (2004) Peres, G., Orlando, S., & Reale, F. 2003, ApJ, submitted
- Pettersen et al. (1980) Pettersen, B. R. 1980, AJ, 85, 871
- Pettersen et al. (1989) Pettersen, B. R. & Hawley, S. L. 1989, A&A, 217, 187
- Pizzolato et al. (2000) Pizzolato, N., Maggio, A., & Sciortino, S. 2000, A&A, 361, 614
- Plucinsky et al. (2002) Plucinsky, P. P., Edgar, R. J., Virani, S. N., Townsley, L. K. & Broos, P. S. 2002, ASP Conf. Ser. 262: The High Energy Universe at Sharp Focus: Chandra Science, 391
- Porquet & Dubau (2000) Porquet, D. & Dubau, J. 2000, A&AS, 143, 495
- Porquet et al. (2001) Porquet, D., Mewe, R., Dubau, J., Raassen, A. J. J. & Kaastra, J. S. 2001, A&A, 376, 1113
- Pradhan & Shull (1981) Pradhan, A. K. & Shull, J. M. 1981, ApJ, 249, 821
- Raassen et al. (2002) Raassen et al. 2002, A&A, 389, 228
- Redfield et al. (2003) Redfield, S., Ayres, T. R., Linsky, J. L., Ake, T. B., Dupree, A. K., Robinson, R. D., & Young, P. R. 2003, ApJ, 585, 993
- Redfield et al. (2002) Redfield, S., Linsky, J. L., Ake, T. B., Ayres, T. R., Dupree, A. K., Robinson, R. D., Wood, B. E. & Young, P. R. 2002, ApJ, 581, 626
- Rosner, Tucker & Vaiana (1978) Rosner, R., Tucker, W. H. & Vaiana, G. S. 1978, ApJ, 220, 643
- Rosner & Vaiana (1977) Rosner, R. & Vaiana, G. S. 1977, ApJ, 216, 141
- Saar (1996) Saar, S. H. 1996, IAU Symp. 176: Stellar Surface Structure, 237
- Sampson et al. (1983) Sampson, D.H., Goett, S.J., Clark, R.E.H. 1983, ADNDT, 29, 467
- Sanz-Forcada et al. (2003a) Sanz-Forcada, J., Brickhouse, N.S & Dupree, A.K. 2003a, ApJS, 145, 147
- Sanz-Forcada et al. (2003b) Sanz-Forcada, J., Maggio, A. & Micela, G. 2003b, A&A, 408, 1087
- Sanz-Forcada et al. (2002) Sanz-Forcada, J., Brickhouse, N.S & Dupree, A.K. 2002, ApJ, 570, 799
- Sanz-Forcada et al. (2001) Sanz-Forcada, J., Brickhouse, N.S & Dupree, A.K. 2001, ApJ, 554, 1079
- Scelsi et al. (2004) Scelsi, L., Maggio, A., Peres, G. & Gondoin, P. 2004, A&A, 413, 643
- Sciortino et al. (1999) Sciortino, S., Maggio, A., Favata, F. & Orlando, S. 1999, A&A, 342, 502
- Simon (1986) Simon, T. 1986, AJ, 91, 1233
- Singh et al. (1996a) Singh, K.P., Drake, S.A., White, N.E. & Simon, T. 1996a, AJ, 112, 221
- Singh et al. (1996b) Singh, K.P., White, N.E. & Drake, S.A. 1996b, ApJ, 456, 766
- Singh et al. (1999) Singh, K. P., Drake, S. A., Gotthelf, E. V., & White, N. E. 1999, ApJ, 512, 874
- Smith et al. (2001) Smith, R. K., Brickhouse, N. S., Liedahl, D. A. & Raymond, J. C. 2001, ApJ, 556, L91
- Stelzer et al. (2002) Stelzer, B. et al. 2002, A&A, 392, 585
- Stelzer & Schmitt (2004) Stelzer, B. & Schmitt, J. H. M. M. 2004, A&A, in press (astro-ph/0402108)
- Strassmeier et al. (1993) Strassmeier, K.G., Hall, D.S., Fekel, F.C. & Scheck, M. 1993, A&AS, 100, 173
- Testa et al. (2004) Testa, P., Drake, J.J., Peres, G. & DeLuca, E.E. 2004, ApJL, submitted
- Torres et al. (2003) Torres, G., Guenther, E. W., Marschall, L. A., Neuhäuser, R., Latham, D. W., & Stefanik, R. P. 2003, AJ, 125, 825
- Wood et al. (2001) Wood, B.E., Linsky, J.L., M ller, H-R. & Zank, G.P. 2001, ApJ, 547, L49
- Withbroe & Noyes (1977) Withbroe, G. L. & Noyes, R. W. 1977, ARA&A, 15, 363
- Zhang & Sampson (1987) Zhang, H. & Sampson, D.H. 1987, ApJS, 63, 487