The Nature of Radio Continuum Emission in the Dwarf Starburst Galaxy NGC 625
Abstract
We present new multi-frequency radio continuum imaging of the dwarf starburst galaxy NGC 625 obtained with the Very Large Array. Data at 20, 6, and 3.6 cm reveal global continuum emission dominated by free-free emission, with only mild synchrotron components. Each of the major H ii regions is detected; the individual spectral indices are thermal for the youngest regions (showing largest H emission) and nonthermal for the oldest. We do not detect any sources that appear to be associated with deeply embedded, dense, young clusters, though we have discovered one low-luminosity, obscured source that has no luminous optical counterpart and which resides in the region of highest optical extinction. Since NGC 625 is a Wolf-Rayet galaxy with strong recent star formation, these radio properties suggest that the youngest star formation complexes have not yet evolved to the point where their thermal spectra are significantly contaminated by synchrotron emission. The nonthermal components are associated with regions of older star formation that have smaller ionized gas components. These results imply a range of ages of the H ii regions and radio components that agrees with our previous resolved stellar population analysis, where an extended burst of star formation has pervaded the disk of NGC 625 over the last 50 Myr. We compare the nature of radio continuum emission in selected nearby dwarf starburst and Wolf-Rayet galaxies, demonstrating that thermal radio continuum emission appears to be more common in these systems than in typical H ii galaxies with less recent star formation and more evolved stellar clusters.
1 Introduction
Radio continuum emission from star formation regions is an invaluable probe of the physical conditions therein. Radio observations offer us one of the only truly extinction-free measures of recent ( 30 Myr) star formation. With the high sensitivity and angular resolution available with modern interferometers [e.g., the Very Large Array (VLA)111The National Radio Astronomy Observatory is a facility of the National Science Foundation operated under cooperative agreement by Associated Universities, Inc.], radio continuum observations can be compared with optical and infrared observations at comparable physical scales (e.g., from HST), allowing us to discern evolutionary correlations between stellar and energetic particle populations.
There are two major components that constitute the radio continuum emission from a typical star formation region (see Condon 1992 for a comprehensive overview). First, the thermal free-free emission arises directly from H ii regions. The strength of this component is proportional to the total number of Lyman continuum photons, and hence to the total number of massive stars. With a radio spectrum characterized by Sν , pure optically thin thermal bremsstrahlung emission will show a nearly flat slope (0.1). Second, the nonthermal synchrotron component is produced by relativistic electrons accelerated in recent supernovae (SNe) explosions and remnants. This emission will show a more negative spectral index (1.2 0.4). Most starbursting galaxies show a radio continuum spectrum dominated by one of these components, or some combination thereof (Deeg et al., 1993); see § 4 for further discussion.
A third and less ubiquitous component of the radio continuum emission from star-forming galaxies can be produced by free-free absorption, resulting in a positive spectral index ( 0.0). Such sources have been identified by Kobulnicky & Johnson (1999) and Johnson & Kobulnicky (2003) as extremely young, dense, heavily-embedded star clusters (or “ultradense H ii regions”). Since the sample of galaxies searched for such regions remains small, the total fraction of starbursting systems that contain such extreme star formation regions is not well known. However, preliminary estimates suggest these sources may enshroud 10% of the O-star populations of starburst galaxies (Johnson et al., 2001).
If radio continuum emission is observed at multiple frequencies and at matched resolutions, we can discern which of the above physical processes dominates within individual star formation regions. By concentrating on nearby starburst galaxies that have resolved stellar and cluster populations in the visual or infrared, we can probe the youngest phases of star formation, from heavily-embedded star clusters to the supernova remnants resulting from massive star evolution. This provides detailed insights into the processes that regulate star formation in starburst galaxies, including feedback and cluster formation and evolution timescales. These are important quantities both locally and in the high-redshift universe.
Here, we present new VLA observations of the dwarf starburst galaxy NGC 625. This system is a nearby (D 3.89 0.22 Mpc; Cannon et al., 2003) prototypical dwarf starburst that has revealed many striking properties in recent multiwavelength investigations (see Table 1 for a summary of basic galaxy parameters). NGC 625 currently hosts a massive starburst with a star formation rate 0.05 M⊙ yr-1 and which displays Wolf-Rayet (W-R) emission features (Skillman, Côté, & Miller 2003a,b). We have performed a recent star formation history analysis using spatially resolved stellar HST/WFPC2 photometry (Cannon et al., 2003), and find that the current burst is actually long-lived ( 50 Myr) compared to canonical expectations based on W-R star populations (ages 6 Myr; Conti 1991; Schaerer, Contini, & Kunth 1999a). This extended burst of star formation appears to have disrupted the H i disk, and this system is currently undergoing outflow of H i from the major starburst region (Cannon et al. 2004a). This outflow is also seen in diffuse x-rays (Bomans & Grant, 1998) and in O VI absorption from FUSE spectroscopy (Cannon et al. 2004b, in preparation).
From the above properties it is clear that the star formation in NGC 625 is violent and is having a dramatic impact on the ISM and potentially on the surrounding IGM as well. Since this galaxy is one of only a small subset of star-forming dwarfs that demonstrate such extreme properties, it is important that we explore other observational avenues with which to better understand its evolution. Here we use multifrequency VLA radio continuum data to infer the dominant emission processes in the major star formation regions, as well as various characteristics of the recent star formation in this galaxy.
2 Observations and Data Reduction
We obtained VLA radio continuum imaging using the BnA and CnB arrays on 2003, October 9, 10, 11, and 2004, February 7 & 8 (see Table 2) for program AC702. Due to the low declination of the source (41.4∘, or a maximum elevation at the VLA of 15∘), only very short transit observations ( 3 hours) are possible; while the hybrid arrays produce more balanced u-v coverage, the beams are still slightly asymmetrical (typically a 1.5:1.0 ratio in the declination-right ascension directions).
All reductions were performed using the Astronomical Image Processing System (AIPS) package. First, interference and bad data were removed. Flux, gain and phase calibrations were then applied, derived from observations of 0542+498 (3c147; primary calibrator) and 0155-408 (secondary calibrator). The C-band (6 cm) and X-band (3.6 cm) observations were obtained in two arrays, and these u-v databases were then concatenated. The calibrated u-v data were then imaged and cleaned to produce continuum maps at each frequency that balanced resolution and sensitivity. When comparing observations at different frequencies to derive spectral indices, it is important that the resulting beams are of similar size and position angle. Of course there will be different coverages in the u-v plane for each frequency and array, so tapering and weighting variations were applied to produce a set of images with nearly matched synthesized beams; since the L-band (20 cm) observations have the poorest resolution, the C-band and X-band data were tapered to this beam size for spectral index work.
The resulting matched-resolution images are discussed further in the next sections. The beam sizes are 5.86″ 3.63″, 5.31″ 3.63″, and 4.45″ 3.63″ for the L, C and X-band data, respectively. The corresponding rms noise levels are 0.036 mJy Beam-1, 0.016 mJy Beam-1, and 0.015 mJy Beam-1. These rms values provide sensitivity to the three major star formation regions in NGC 625, as well as to diffuse radio continuum emission in the surrounding regions. The flux densities of each detected radio source were measured via two methods: two-dimensional Gaussian fitting was performed in AIPS, and the final images were used in aperture photometry routines to assure the same physical areas were sampled in constructing spectral index measurements. Source flux densities are discussed further in § 3.
3 Radio Continuum Emission In NGC 625
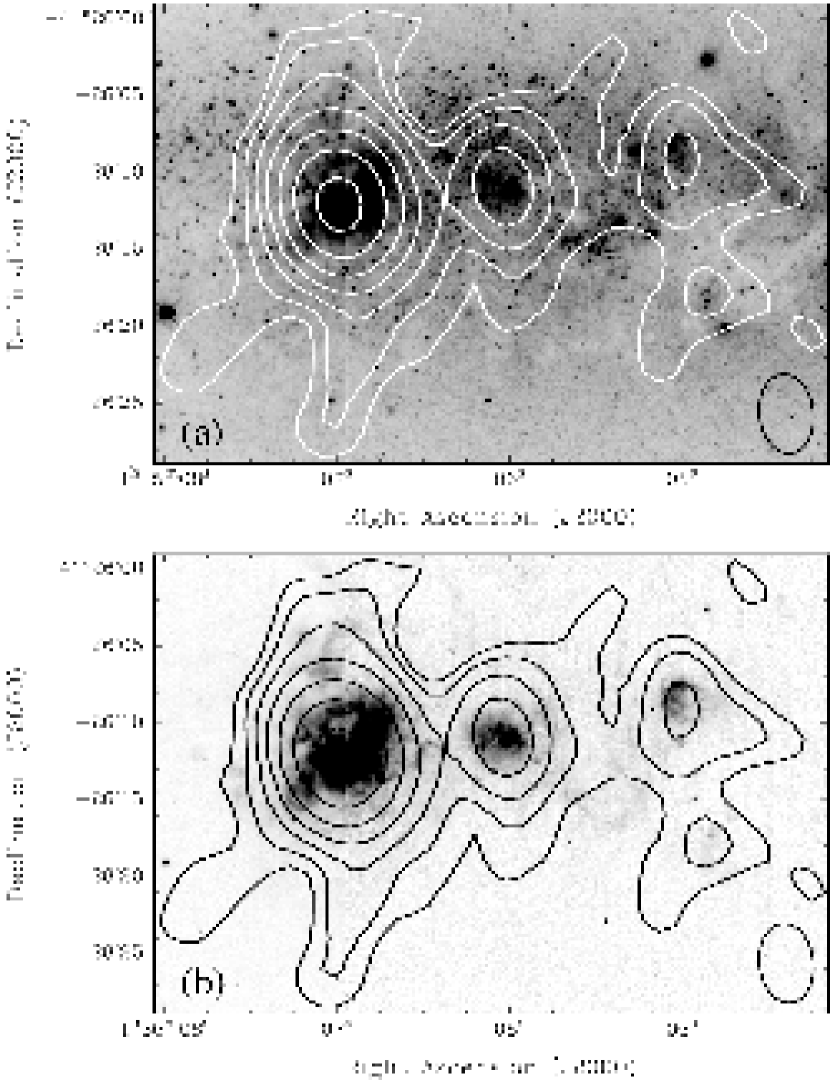
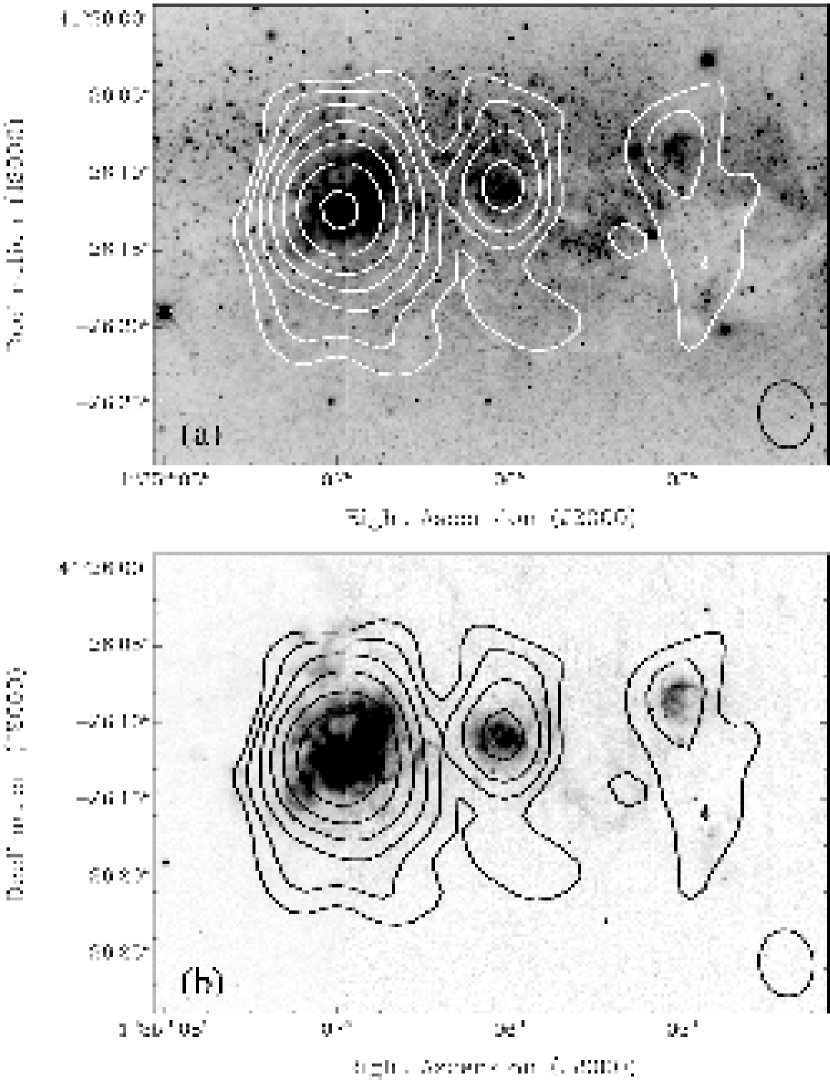
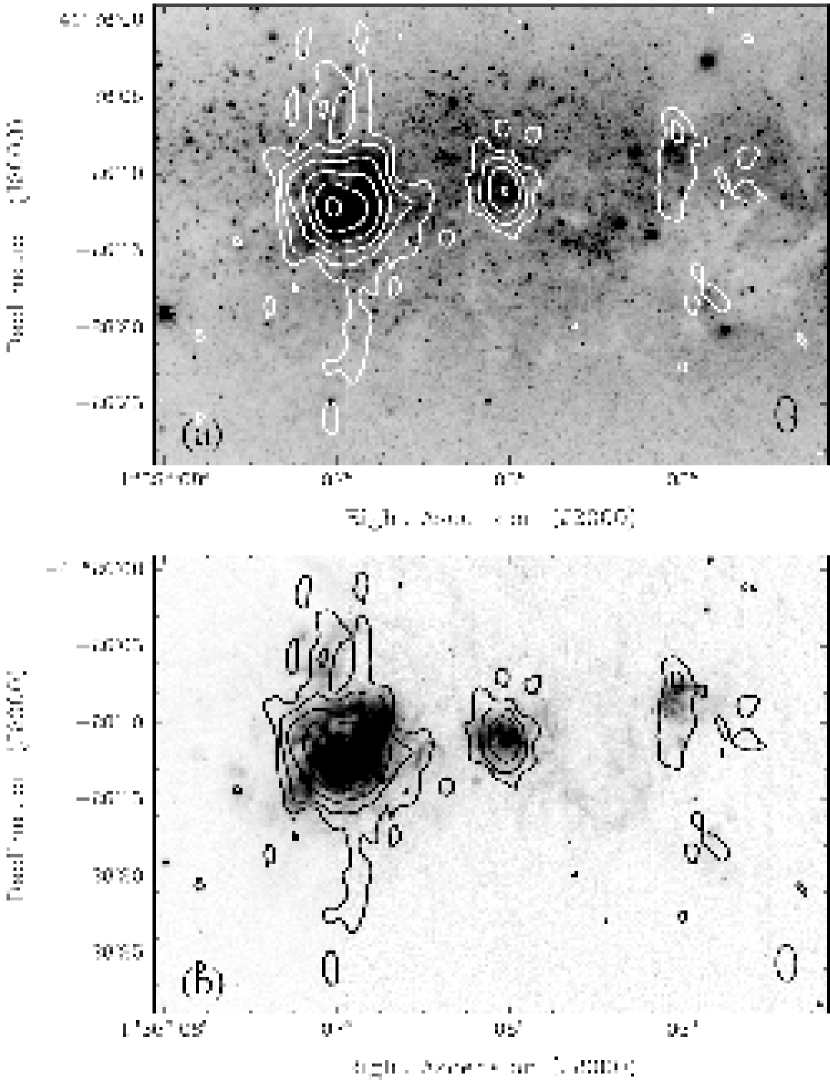
We detect radio continuum emission from the three largest star formation regions (as traced by H luminosity) in NGC 625. In Figures 1, 2, and 3 we present overlays of the L, C, and X-band images on HST/WFPC2 V and (continuum-subtracted) H images (see Cannon et al. 2003 for a detailed analysis of these images). There is an excellent correlation between H emission and radio continuum emission at this sensitivity level [note, however, that Skillman et al. (2003a) find diffuse H emission throughout the disk and extending above the plane to the north]. There is also a good correspondence between massive stellar clusters and radio continuum peaks (see below).
In a previous analysis of the WFPC2 images used for comparison here, we found a position offset of 5.1″ in declination only from a ground-based astrometric plate solution (see Cannon et al., 2003). The source of this error is unknown, and we have corrected the positions in this work. The positional alignment accuracy between the radio and the HST optical images is dominated by the uncertainty in the HST coordinates ( 0.1″ rms in the radio, and 0.5″ rms for HST). We conservatively estimate that the positional accuracy between the two datasets is 0.6″ rms. At the distance of 3.89 Mpc, this corresponds to 11 pc, or greater than the radii of many young, dense stellar clusters. This will preclude us from assuring accurate comparisons between the smallest stellar clusters and radio continuum emission peaks; however, as described below, the close morphological agreement between radio and H emission suggests our astrometric solution is robust.
To measure total flux densities in each of the observing bands, all emission detected above the 3 level surrounding the optical region of the galaxy was integrated within an identical aperture for each frequency. These values are given in Table 3. The global spectral index of NGC 625 is nearly purely thermal, with 0.13 0.08. This suggests that the bulk of the radio continuum emission arises from current H ii regions, with the number of Lyman continuum photons proportional to the total number of massive stars (see below).
Since care was taken to achieve matching beam sizes at all three observing frequencies, we can also compare the spectral indices of individual H ii regions and radio continuum peaks. As discussed in § 2, the flux densities of individual peaks were measured both by two-dimensional Gaussian fitting and by aperture photometry with fixed aperture size. As an inspection of Figures 1, 2 and 3 will reveal, there exists diffuse radio continuum emission throughout the disk at this resolution. This will complicate the derivation of flux densities from individual peaks, since each frequency attains a different noise level and hence surface brightness sensitivity. For this reason we derive source flux densities using aperture photometry with matched aperture sizes between images. This assures that only emission associated directly with each emission peak is included for the derivation of spectral indices. The results for each frequency are presented in Table 3.
3.1 Thermal Radio Continuum Sources
The two highest-surface brightness H ii regions, NGC 625 A and NGC 625 B (labeled in Figure 1b), are found to have thermal spectral indices with 0.10. These radio maxima are thus powered by free-free emission. Since these peaks have unambiguously flat spectral indices, we use their thermal emission to estimate the number of ionizing stars in the associated H ii regions, as well as the current star formation rates. From Condon (1992), for a purely thermal source, the number of Lyman continuum photons is approximated by:
| (1) |
where NUV is the number of Lyman continuum photons emitted per second, Te is the electron temperature in units of 104 K, is the observing frequency in GHz, and LT is the thermal radio continuum luminosity in units of 1020 W Hz-1. Also from Condon (1992), the thermal radio continuum flux density is related to the current star formation rate by the relation:
| (2) |
where SFR is the current star formation rate of stars more massive than 5 M⊙ in units of M⊙ yr-1, LT is the thermal radio continuum luminosity in units of W Hz-1, and is the observing frequency in GHz.
Using equation (1) above and adopting the electron temperatures for regions NGC 625 A and NGC 625 B from Skillman et al. (2003b; their H ii regions 5, 9 and 18 correspond to NGC 625 A, B, C, respectively; see also Table 3 and § 3.4) and the distance of 3.89 Mpc from Cannon et al. (2003), we find that H ii regions NGC 625 A and NGC 625 B together emit 1052 Lyman continuum photons per second. Using conversions from Vacca (1994) and Vacca, Garmany, & Shull (1996), where one O7 V star emits 1049 Lyman continuum photons per second, this implies that these two H ii regions harbor 1000 such O stars (see Table 3).
Similarly, using equation (2) we estimate the current massive star formation rate in these two H ii regions to be 0.03 M⊙ yr-1 (see Table 3). Since these two H ii regions constitute 98% of the H flux associated with high-surface brightness H ii regions in NGC 625 and 95% of the total H from the galaxy (see discussion in Cannon et al., 2003), this estimate of the star formation rate encompasses nearly all of the area undergoing active star formation at the current epoch. It is in agreement with, though slightly less than, the estimate of 0.05 M⊙ yr-1 found from H fluxes in Skillman et al. (2003a) and Cannon et al. (2003); the difference is due to assumptions about the initial mass function used in each method (the radio method giving the star formation rate for stars more massive than 5 M⊙, and the H method integrated over a 0.1 - 100 M⊙ range).
3.2 Nonthermal Radio Continuum Sources
H ii region NGC 625 C is found to have a more negative spectral index, 0.33 0.08. This suggests that nonthermal processes are more dominant in this region compared to regions NGC 625 A and NGC 625 B discussed above. Synchrotron radiation from relativistic electrons likely arises in SNe explosions and remnants. Thus the predominance of this type of emission suggests that these regions are somewhat older than thermal regions (see below), and that the cumulative contribution from the evolution of massive stars is more pronounced.
NGC 625 C is the least-luminous H ii region detected in our HST/WFPC2 H imaging. From an examination of the H morphology in Figures 1(b), 2(b), and 3(b), the high-surface brightness areas of NGC 625 C have a shell morphology, with the eastern side more luminous than the western. Such a scenario likely results when numerous SNe detonate in a localized area in a short time interval. The size of the putative shell ( 50 pc) greatly exceeds the sizes of typical single-star SN remnants and implies that numerous massive stars had to once power this star formation region in order to create such a large shell of ionized gas. The nonthermal radio continuum emission arising from SNe remnants associated with this star formation region implies that it is older than the thermal regions.
These results are consistent with our HST/WFPC2 star formation history analysis (see Cannon et al., 2003), where widespread star formation was found throughout the disk over at least the last 50 Myr. In that investigation, local star formation concentrations (as probed by the blue helium burning stars, which are useful, luminous age probes) were shown to propagate throughout the disk over the last 100 Myr, with a general movement from west to east [see in particular Figure 14 of Cannon et al. (2003)]. Since radio continuum emission is only associated with massive stars with lifetimes 30 Myr (Condon, 1992), these observations do not allow us to probe this entire epoch. However, the mix of thermal and nonthermal components is consistent with star formation over the last 30 Myr, in various areas of the disk, in agreement with our HST results. Furthermore, we find that, in general, the radio emission peaks are more nonthermal in the western park of the disk, and more thermal in the eastern part. As argued in § 4, this is consistent with an age progression from older to younger, in general agreement with the star formation history analysis.
3.3 Deeply Embedded Star Formation Regions?
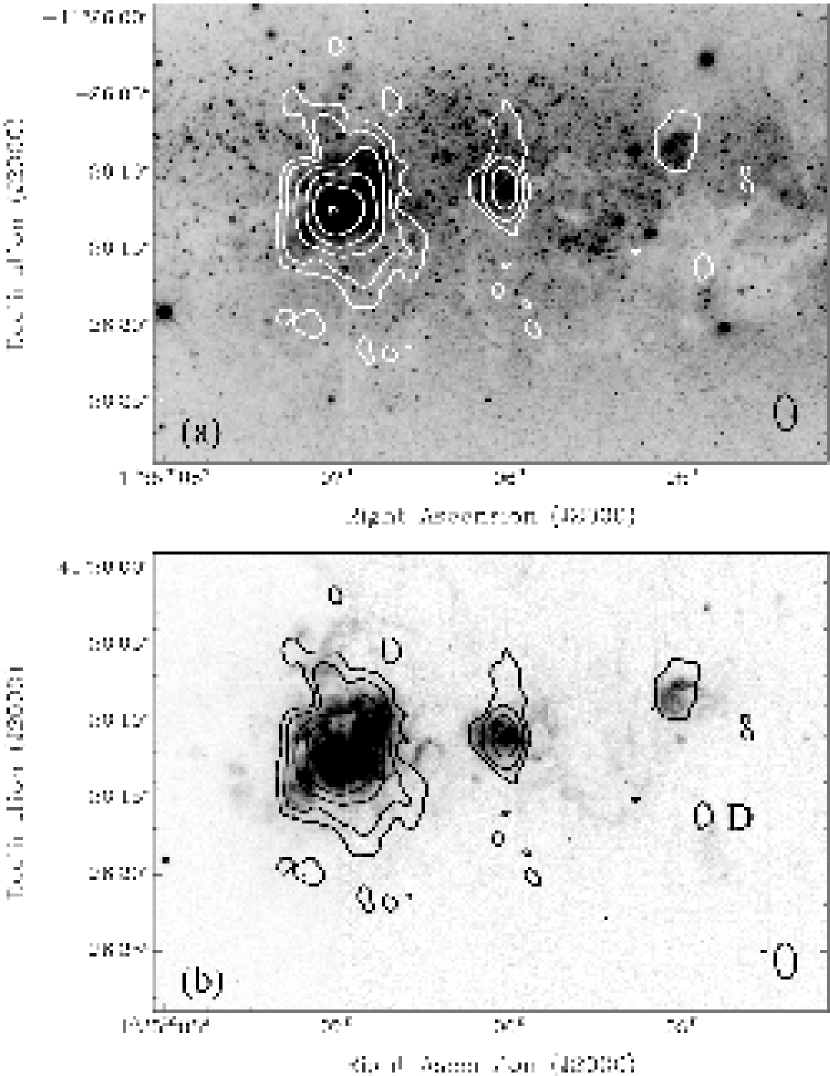
With the high angular resolution afforded by the BnA array at C and X-bands, we can perform a search for deeply-embedded and obscured star formation regions in NGC 625. A second set of maps was produced at each of these frequencies, with matched resolutions of 2.4″ 1.4″ and rms noise levels of 0.017 mJy Beam-1 and 0.016 mJy Beam-1 at C and X-bands, respectively. These images, shown in Figures 4 and 5, were searched for compact sources that may have been lost in the lower-resolution maps.
We find no sources showing positive spectral index values, which are indicative of embedded stellar clusters still in their natal material (Johnson et al., 2001). However, we do detect one partially optically obscured, slightly nonthermal source located within the large dust cloud to the south and west of the three radio continuum peaks seen in the lower-resolution maps. This source, labeled D in Figure 5(b), was then isolated in the low-resolution images and its flux density measured in all three observing bands. This procedure yields a spectral index of 0.22 0.19, indicative of a mix of thermal and nonthermal components, and of an older age for its associated cluster. Due to its low luminosity (and thus large error on the implied spectral index), we do not over-interpret this detection. However, taken at face value, it supports the idea of widespread star formation throughout the disk over the last few tens of millions of years, and suggests that the major dust concentration may also harbor plentiful molecular gas. Indeed, this position is coincident with a CO (21) detection, and observations are planned to map the entire system in CO lines (Côté, Braine, & Cannon, in preparation).
These higher-resolution maps probe structures smaller than 45 pc at the distance of NGC 625. This is the highest matched-beam resolution available at these frequencies for this galaxy, due to its southern declination. A search at higher frequencies could be fruitful, with the advantage in resolution; however, such observations will be difficult given the elevation-dependent effects inherent at those observing bands222See the Very Large Array Observational Status Summary at http://www.vla.nrao.edu/astro/. Comparing the flux densities of sources NGC 625 A, NGC 625 B, and NGC 625 C as measured with three frequencies at lower resolution (discussed above and presented in Table 3) and these higher-resolution data (with only two frequencies), we find the differences to be smaller than the uncertainties. Since the formal errors are smaller on the lower-resolution data (due to the larger wavelength baseline), we quote these values as characteristic of the more luminous H ii regions.
3.4 Extinction Toward The H ii Regions
By comparing thermal radio continuum flux densities with recombination line intensities (e.g., H, H), one can gauge the reddening toward sources that may be partially or completely obscured at optical wavelengths. The wide wavelength separation between the optical and radio allows sources that appear to have little optical extinction (e.g., by comparing relatively closely-spaced optical recombination lines) to be tested for reddening within the system. This method fails for strongly nonthermal sources, so we constrain our discussion to those H ii regions where we have calculated mostly flat radio continuum spectral indices, i.e., regions NGC 625 A, NGC 625 B, and potentially NGC 625 D (see below).
We compare flux densities derived from both the low and the high-resolution X-band observations (the highest-sensitivity frequency presented here) to our previously-published HST/WFPC2 H fluxes (see Cannon et al., 2003). From Caplan & Deharveng (1986), for a purely thermal radio continuum source in the absence of extinction, the H flux and the flux density at 8.46 GHz are related via:
| (3) |
where jHα is the flux at H in erg sec-1 cm-2, j8.46 is the flux density at 8.46 GHz in Jy, and T is the electron temperature in units of 104 K. We adopt the temperatures for the H ii regions from Skillman et al. (2003b, see Table 3). For source NGC 625 D, no temperature is available, so we assume 104 K, typical of the other H ii regions. Given these temperatures, we expect 9.510-10 erg sec-1 cm-2 Jy-1 for NGC 625 A, 9.710-10 erg sec-1 cm-2 Jy-1 for NGC 625 B, and 1.010-9 erg sec-1 cm-2 Jy-1 for NGC 625 D. As shown in Table 3, our calculated value for (which is the average of the low- and high-resolution values, which agree to within 10%) for NGC 625 B is consistent with no additional reddening toward this H ii region. NGC 625 A, on the other hand, suffers from mild extinction at H, A 1.1 0.3 magnitudes. The radio continuum source NGC 625 D is only weakly detected in H in the HST imaging; if its radio emission is thermal (allowed within the errors), then the impied extinction is a lower limit of 2.0 magnitudes. This source appears to be coincident with H ii region #17 from Skillman et al. (2003a); the H flux found therein is larger than our value by 50%. If this latter value correct (implying that the lower surface brightness sensitivity of the HST narrowband filter has missed a substantial fraction of this emission), then the implied extinction falls to 1.1 magnitudes.
These implied extinction values for regions NGC 625 A and NGC 625 B are fully consistent with those found from 1384 MHz radio continuum imaging presented in Cannon et al. (2004a). These results enforce the conclusions drawn from our HST/WFPC2 star formation history analysis, where pronounced and variable extinction was found throughout the disk of this system. Deep infrared imaging would be insightful to probe the de-reddened stellar population behind the large dust concentration.
3.5 Diffuse Continuum Emission
We can estimate the flux density of diffuse radio continuum emission as the difference between the global radio flux density and the flux densities enclosed within the discrete regions discussed above. However, it should be noted that these interferometric observations are biased toward compact, high-surface brightness regions and that a large fraction of putative diffuse emission could be resolved out with these data alone. With these cautions in mind, we estimate that the spectral index of the diffuse emission is nonthermal, 0.49 0.69. Note that the errors on this index are large and are dominated by the errors in the measures of the individual peak flux densities.
From our previous Australia Telescope Compact Array (ATCA)333The Australia Telescope is funded by the Commonwealth of Australia for operation as a National Facility managed by the Commonwealth Scientific and Industrial Research Organisation radio continuum imaging at 1384 MHz (see Cannon et al. 2004a), we find a total L-band flux density of 10.3 1.0 mJy, i.e., within 5% of the measured global flux density from the present observations. Since the ATCA data had shorter baselines than the shortest included here (by roughly a factor of two), the close agreement implies that the diffuse emission may account for up to 10% of the measured flux density in each band. This diffuse emission may be the result of the extended star formation that has been ongoing for the last 50 Myr in this system. We suggest that the strong thermal emission peaks are superposed on a diffuse nonthermal background; the higher thermal luminosities make it more difficult to accurately gauge the total nonthermal budget (see further discussion in § 4.1).
4 Comparison With Nearby Star-Forming Galaxies
As argued above, we interpret the thermal and nonthermal components of the radio continuum emission in NGC 625 as an age progression. As a general rule, the slope of the radio spectral index (where Sν ) appears to be useful as a rough guide to the timescale for recent star formation. Heavily-embedded clusters with ages 1 Myr will appear as sources with positive values of , suggesting optically thick thermal bremsstrahlung emission. As the slope flattens, thermal free-free emission will dominate, and the radio continuum peaks will show a good correlation with H emission. Since the thermal radio flux density is proportional to the total number of Lyman continuum photons, this emission will have a similar timescale to most H ii regions ( 10 Myr). Finally, negative spectral index values indicate a nonthermal electron population where the cumulative effects of SNe explosions and remnants are most pronounced. These effects apparently become dominant on timescales longer than H ii region lifetimes, although a nonthermal population will be introduced after the evolution of the most massive star in a given cluster (e.g., Israel & de Bruyn, 1988). In the next sections we compare the nature of radio continuum emission in dwarf starburst and Wolf-Rayet galaxies in the literature, with these timescale arguments in mind.
4.1 Radio Continuum Emission in Nearby Dwarf Starburst Galaxies
The small number of nearby dwarf starburst systems limits our understanding of the radio continuum properties of this important subclass of star-forming galaxies. Since these systems are efficient avenues of massive star formation that can have dramatic impacts on the surrounding ISM and IGM, it is important that the properties be compared among those systems that have been studied at high resolution and sensitivity. Here, we present a brief comparison of the continuum properties of NGC 625 with those of four other well-studied dwarf starbursts, NGC 1569, NGC 1705, NGC 5253, and He 2-10. This small but growing sample of dwarf starbursts (which is not meant to be comprehensive nor exclusive) is providing detailed insights into the nature of star formation in these systems.
As discussed above, the radio continuum emission in NGC 625 is dominated by regions showing thermal emission, although the diffuse emission appears to be nonthermal in nature. Individual star formation regions display a mix of thermal and nonthermal emission, which we have interpreted as an age sequence for the three highest-surface brightness H ii regions. This is consistent with our resolved stellar populations study (Cannon et al., 2003) and suggests that active star formation has been present throughout the disk for at least the last 30 Myr (see discussion in § 3.2).
At a distance of 2.2 Mpc (Israel, 1988), NGC 1569 is the closest known dwarf starburst galaxy. Israel & de Bruyn (1988) find a nonthermal halo superposed on a disk dominated by thermal emission, much as seen in the present observations. Those authors also infer NGC 1569 to be a “post-starburst” system, which has been borne out by subsequent HST studies (e.g., Greggio et al., 1998). Higher-resolution observations presented in Greve et al. (2002) and Lisenfeld et al. (2004) find a largely thermal radio continuum, with the “super star clusters” (SSCs) being mostly thermal in nature. The thermal radio emission peaks coincide with the H maxima and not the stellar clusters, showing the locations of the most recent star formation. This offset is interpreted as the effect of feedback, where the recent star formation that produced the SSCs has cleared out the regions surrounding them.
NGC 5253 (D 4.1 0.2; Saha et al. 1995) also displays strong thermal radio continuum emission, though again the peaks are not directly coincident with the major stellar clusters (Turner, Ho, & Beck 1998). This high thermal fraction is interpreted as evidence for the youth of the current starburst. Diffuse nonthermal emission surrounds these central thermal peaks, and there also exist inverted-spectrum ( 0.0) sources that higher-frequency observations revealed to be dense, compact ( few pc) H ii regions (Turner, Beck, & Ho 2000). These features suggest that NGC 5253 is currently forming massive stars at a prodigious rate, and that pressures and densities are conducive to the formation of potential SSCs that are still deeply-embedded in their birth material.
At a larger distance of 9 Mpc, He 2-10 is found to demonstrate a strongly nonthermal global spectral index ( 0.5; Kobulnicky & Johnson 1999). However, each of the main radio continuum emission peaks shows either flat or inverted spectral indices. This is interpreted as the signature of very young (age 1 Myr) stellar clusters still in the process of formation (see also Johnson & Kobulnicky, 2003). The fact that He 2-10 contains such a high fraction of young, embedded potential SSCs suggests that the conditions are optimal for the formation of these relatively rare, massive young stellar clusters.
From the above small sample, it appears that radio continuum emission is common in strongly star-forming dwarf galaxies, especially those that have undergone recent massive cluster formation (i.e., SSCs or their precursors). However, NGC 1705, well-known for its intense galactic wind and prominent outflow (Heckman et al., 2001), is not detected in the radio continuum at a sensitivity level sufficient to detect a typical Galactic ultradense H ii region (Johnson, Indebetouw, & Pisano 2003). This is interpreted as a recent and rapid termination of star formation in this system, potentially by the current outflow as it carries energy and perhaps parts of the ISM away from the starburst regions. Based on the lifetime of the massive stellar clusters ( 1–8 Myr; Tremonti et al. 2001), this termination must have been abrupt indeed.
The above sample suggests that most, but not all, systems with vigorous current star formation (i.e., within the last few Myr) will show strong radio continuum emission. On the other hand, systems that have efficiently formed stars over the recent epoch may quickly become undetectable in the radio continuum. The timescales and mechanisms for the decrease in radio continuum flux density are not well-constrained by observations, primarily because the evolution of radio continuum emission processes is intricately linked to the process of feedback in dwarf galaxies. This is an especially difficult quantity to place useful observational constraints on, since there are numerous complicated effects (e.g., turbulence) that have yet to be understood. We present in Table The Nature of Radio Continuum Emission in the Dwarf Starburst Galaxy NGC 625 a brief compilation of important properties that may affect the interpretation of radio continuum emission in these systems, drawing attention to the wide parameter space that dwarf starbursts cover.
As an example of the complex nature of radio continuum emission in these low-mass galaxies, consider NGC 625, NGC 1569, and NGC 1705. All three systems have large starburst regions with high H equivalent widths, and all have outflows detected in x-ray, uv, optical or radio observations [see Heckman et al. (2001) for NGC 1705; Martin, Kobulnicky & Heckman (2002) for NGC 1569; Cannon et al. (2004a) for NGC 625]. NGC 625 and NGC 1569 show thermal radio emission while NGC 1705 shows no thermal emission to reasonable detection levels. Although outflow is suggested to explain the rapid cessation of star formation in NGC 1705 (Johnson et al., 2003), strong outflows exist in both NGC 625 and NGC 1569, and current star formation does not appear to be significantly affected (although the star formation rates in both systems have declined over the last 25 Myr). If outflow and its effects on future star formation are responsible for the variation in radio continuum properties of these star-forming galaxies, then its nature is a complicated one that depends on characteristics of the ISM that have not yet been included in models of the formation and evolution of outflows from these systems.
4.2 Radio Continuum Emission in Wolf-Rayet Galaxies
Each of the above systems displays broad W-R emission features in its optical spectrum (Schaerer, Contini & Pindao 1999b; Skillman et al. 2003b) except for NGC 1705 (Lee & Skillman 2004, in preparation). Based on the lifetimes discussed in Conti (1991) and Schaerer et al. (1999a), these features imply recent ( 6 Myr) star formation bursts with short durations ( 2 – 4 Myr). Of course these spectral features arise from individual star formation regions and indicate the ages of that particular stellar population. However, they are not necessarily indicative of the entire stellar population in the galaxies, as discussed in Cannon et al. (2003). Active star formation can pervade the disks of low-mass galaxies for extended periods of time, and the W-R features simply highlight active regions at the current epoch. It is important to keep this in mind for galaxies at distances where a resolved stellar population analysis is not available.
Since the bulk of W-R galaxies are more distant than the sample discussed above, the number of studies comparing their resolved stellar populations with high-resolution radio continuum maps is small. The largest sample to date was compiled by Beck, Turner, & Kovo (2000), where nine relatively nearby W-R galaxies were observed at multiple frequencies. The results of that study suggest that thermal radio continuum emission is common from W-R galaxies, and in many cases, so is the appearance of positive-index embedded sources. This can be contrasted with the H ii galaxy sample of Deeg et al. (1993), where most galaxies show nonthermal spectral indices. Beck et al. (2000) interpret the prominent free-free emission in W-R galaxies to the youth of these systems, while the strong synchrotron components found in the sample of Deeg et al. (1993) suggest that the star formation events in these systems are somewhat older. This comparison could be problematic, however, given the differences in observing frequency and synthesized beam between the two investigations.
This limited sample of W-R galaxies appears to support the interpretation of the spectral index as a rough age indicator. In this paradigm, NGC 1705 not appearing as a W-R galaxy in the optical places it more correctly in the class of H ii galaxies, and its very low radio continuum luminosity is not as striking as when compared to more active W-R and dwarf starburst galaxies. This scenario is certainly not robust, however, and the effects of feedback in regulating the evolution of radio continuum emission in dwarf starburst galaxies needs more detailed attention. With the imminent completion of the Expanded Very Large Array444See http://www.aoc.nrao.edu/evla/, providing a factor of 10 improvement in spatial resolution and sensitivity, the sample of W-R galaxies can be greatly expanded, and the nature of radio continuum emission therein can be explored in much more detail.
5 Conclusions
We have presented new VLA radio continuum imaging, in the BnA and CnB arrays at L, C and X-bands, of the nearby dwarf starburst galaxy NGC 625. The global spectral index is nearly flat, suggesting that thermal emission dominates the radio continuum luminosity. Examination of the spectral indices of individual star formation regions shows a mix of thermal and nonthermal processes. The highest-surface brightness H ii regions NGC 625 A and NGC 625 B show strong free-free emission, while the less-luminous H ii region NGC 625 C is dominated by nonthermal synchrotron radiation. At 2″ ( 40 pc) resolution, we do not find any deeply-embedded sources in NGC 625. However, we do find (with only 3 significance) one low-luminosity source that has no obvious optical counterpart and that is located in the region of highest optical extinction.
We interpret the mix of thermal and nonthermal emission from the main star formation regions as an age progression, with free-free emission arising from H ii regions with ages 10 Myr, and synchrotron radiation prominent in regions older than this. Comparing to a limited sample of well-studied dwarf starburst and W-R galaxies, we find that global thermal emission is common in these types of systems. The spectral indices are typically flatter than in H ii galaxies, and this is again suggestive that the dominant free-free component in dwarf starburst and W-R galaxies implies younger starburst ages than in more evolved systems where synchrotron emission dominates.
The importance of small-scale processes (i.e., feedback) in regulating the evolution of emission in these systems is highlighted. While a simple age interpretation is suitable for most of this small nearby sample, more complex interpretations are needed when comparing multiwavelength properties of various galaxies. The formation and evolution of outflows is an important parameter, but is relatively poorly constrained by observations. More detailed modeling and higher-resolution observations of larger samples of dwarf starburst and W-R galaxies would be beneficial for understanding the evolution of the radio continuum properties of these important star-forming systems.
References
- Beck et al. (2000) Beck, S. C., Turner, J. L., & Kovo, O. 2000, AJ, 120, 244
- Bomans & Grant (1998) Bomans, D. J. & Grant, M.-B. 1998, Astronomische Nachrichten, 319, 26
- Cannon et al. (2003) Cannon, J. M., Dohm-Palmer, R. C., Skillman, E. D., Bomans, D. J., Côté, S., & Miller, B. W. 2003, AJ, 126, 2806
- Cannon et al. (2004) Cannon, J. M., McClure-Griffiths, N. M., Skillman, E. D., & Côté, S. 2004a, ApJ, in press (astro-ph/0403190)
- Caplan & Deharveng (1986) Caplan, J. & Deharveng, L. 1986, A&A, 155, 297
- Condon (1992) Condon, J. J. 1992, ARA&A, 30, 575
- Conti (1991) Conti, P. S. 1991, ApJ, 377, 115
- Deeg et al. (1993) Deeg, H., Brinks, E., Duric, N., Klein, U., & Skillman, E. 1993, ApJ, 410, 626
- Greggio et al. (1998) Greggio, L., Tosi, M., Clampin, M., de Marchi, G., Leitherer, C., Nota, A., & Sirianni, M. 1998, ApJ, 504, 725
- Greve et al. (2002) Greve, A., Tarchi, A., Hüttemeister, S., de Grijs, R., van der Hulst, J. M., Garrington, S. T., & Neininger, N. 2002, A&A, 381, 825
- Heckman et al. (2001) Heckman, T. M., Sembach, K. R., Meurer, G. R., Strickland, D. K., Martin, C. L., Calzetti, D., & Leitherer, C. 2001, ApJ, 554, 1021
- Hensler et al. (1998) Hensler, G., Dickow, R., Junkes, N., & Gallagher, J. S. 1998, ApJ, 502, L17
- Israel (1988) Israel, F. P. 1988, A&A, 194, 24
- Israel & de Bruyn (1988) Israel, F. P. & de Bruyn, A. G. 1988, A&A, 198, 109
- Johnson et al. (2003) Johnson, K. E., Indebetouw, R., & Pisano, D. J. 2003, AJ, 126, 101
- Johnson & Kobulnicky (2003) Johnson, K. E. & Kobulnicky, H. A. 2003, ApJ, 597, 923
- Johnson et al. (2001) Johnson, K. E., Kobulnicky, H. A., Massey, P., & Conti, P. S. 2001, ApJ, 559, 864
- Kennicutt, Tamblyn, & Congdon (1994) Kennicutt, R. C., Tamblyn, P., & Congdon, C. E. 1994, ApJ, 435, 22
- Kobulnicky & Johnson (1999) Kobulnicky, H. A. & Johnson, K. E. 1999, ApJ, 527, 154
- Kobulnicky, Kennicutt, & Pizagno (1999) Kobulnicky, H. A., Kennicutt, R. C., & Pizagno, J. L. 1999, ApJ, 514, 544
- Kobulnicky et al. (1997) Kobulnicky, H. A., Skillman, E. D., Roy, J., Walsh, J. R., & Rosa, M. R. 1997, ApJ, 477, 679
- Kobulnicky & Skillman (1997) Kobulnicky, H. A. & Skillman, E. D. 1997, ApJ, 489, 636
- Lisenfeld et al. (2004) Lisenfeld, U., Wilding, T. W., Pooley, G. G., & Alexander, P. 2004, MNRAS, 349, 1335
- Marlowe et al. (1997) Marlowe, A. T., Meurer, G. R., Heckman, T. M., & Schommer, R. 1997, ApJS, 112, 285
- Martin (1998) Martin, C. L. 1998, ApJ, 506, 222
- Martin & Kennicutt (1995) Martin, C. L. & Kennicutt, R. C. 1995, ApJ, 447, 171
- Martin et al. (2002) Martin, C. L., Kobulnicky, H. A., & Heckman, T. M. 2002, ApJ, 574, 663
- Méndez et al. (1999) Méndez, D. I., Esteban, C., Filipović , M. D., Ehle, M., Haberl, F., Pietsch, W., & Haynes, R. F. 1999, A&A, 349, 801
- Meurer, Staveley-Smith, & Killeen (1998) Meurer, G. R., Staveley-Smith, L., & Killeen, N. E. B. 1998, MNRAS, 300, 705
- Reif et al. (1982) Reif, K., Mebold, U., Goss, W. M., van Woerden, H., & Siegman, B. 1982, A&AS, 50, 451
- Saha et al. (1995) Saha, A., Sandage, A., Labhardt, L., Schwengeler, H., Tammann, G. A., Panagia, N., & Macchetto, F. D. 1995, ApJ, 438, 8
- Sauvage, Thuan, & Lagage (1997) Sauvage, M., Thuan, T. X., & Lagage, P. O. 1997, A&A, 325, 98
- Schaerer et al. (1999) Schaerer, D., Contini, T., & Kunth, D. 1999, A&A, 341, 399
- Schaerer et al. (1999) Schaerer, D., Contini, T., & Pindao, M. 1999, A&AS, 136, 35
- Schlegel et al. (1998) Schlegel, D. J., Finkbeiner, D. P., & Davis, M. 1998, ApJ, 500, 525
- Skillman et al. (2003a) Skillman, E. D., Côté, S., & Miller, B. W. 2003a, AJ, 125, 593
- Skillman et al. (2003b) Skillman, E. D., Côté, S., & Miller, B. W. 2003b, AJ, 125, 610
- Stil & Israel (2002) Stil, J. M. & Israel, F. P. 2002, A&A, 392, 473
- Tosi et al. (2001) Tosi, M., Sabbi, E., Bellazzini, M., Aloisi, A., Greggio, L., Leitherer, C., & Montegriffo, P. 2001, AJ, 122, 1271
- Tremonti et al. (2001) Tremonti, C. A., Calzetti, D., Leitherer, C., & Heckman, T. M. 2001, ApJ, 555, 322
- Turner et al. (2000) Turner, J. L., Beck, S. C., & Ho, P. T. P. 2000, ApJ, 532, L109
- Turner et al. (1998) Turner, J. L., Ho, P. T. P., & Beck, S. C. 1998, AJ, 116, 1212
- Vacca (1994) Vacca, W. D. 1994, ApJ, 421, 140
- Vacca et al. (1996) Vacca, W. D., Garmany, C. D., & Shull, J. M. 1996, ApJ, 460, 914

| Property | Value | Reference |
|---|---|---|
| Distance (Mpc) | 3.89 0.22 | Cannon et al. (2003) |
| MB | 16.3 | Marlowe et al. (1997) |
| Gal. Lat. (∘) | 73.1 | |
| Foreground E(BV) | 0.016 | Schlegel, Finkbeiner, & Davis (1998) |
| 12 log(O/H) | 8.14 0.02 | Skillman et al. (2003b) |
| Current SFR (M⊙ yr-1) | 0.05 | Skillman et al. (2003a) |
| H i Mass (108 M⊙) | 1.1 0.1 | Cannon et al. (2004a) |
| VHelio (km s-1) | 413 5 | Cannon et al. (2004a) |
| V20 (km s-1) | 95 2 | Cannon et al. (2004a) |
| V50 (km s-1) | 62 2 | Cannon et al. (2004a) |
| Array | Observation | Frequency | TINT | Flux | Phase | Phase Calibrator |
|---|---|---|---|---|---|---|
| Configuration | Date(s) | (GHz) | (Minutes) | Calibrator | Calibrator | Fν (Jy) |
| BnA | 2003 Oct 9 | 1.40 | 178 | 3c 147 | 0155408 | 2.1 0.10 |
| BnA | 2003 Oct 10 | 4.86 | 178 | 3c 147 | 0155408 | 1.09 0.06 |
| BnA | 2003 Oct 11 | 8.46 | 178 | 3c 147 | 0155408 | 0.78 0.04 |
| CnB | 2004 Feb 7 | 4.86 | 178 | 3c 147 | 0155408 | 1.08 0.06 |
| CnB | 2004 Feb 8 | 8.46 | 178 | 3c 147 | 0155408 | 0.78 0.04 |
| Parameter | NGC 625 AaaAdopting the nomenclature of Cannon et al. (2003); see Figures 1(b) and 5(b). | NGC 625 BaaAdopting the nomenclature of Cannon et al. (2003); see Figures 1(b) and 5(b). | NGC 625 CaaAdopting the nomenclature of Cannon et al. (2003); see Figures 1(b) and 5(b). | NGC 625 D | NGC 625 Total Galaxy |
|---|---|---|---|---|---|
| R.A. (J2000)bbCentral position of radio continuum emission peaks are derived from Gaussian fitting. The coordinates of the NGC 625 system are taken from the NASA Extragalactic Database. | 01:35:07.0 | 01:35:06.0 | 01:35:05.0 | 01:35:04.9 | 01:35:04.6 |
| Dec. (J2000)bbCentral position of radio continuum emission peaks are derived from Gaussian fitting. The coordinates of the NGC 625 system are taken from the NASA Extragalactic Database. | 41:26:12.0 | 41:26:11.0 | 41:26:09.5 | 41:26:17.2 | 41:26:10.0 |
| S (mJy) | 7.4 0.8 | 0.80 0.08 | 0.28 0.03 | 0.09 0.02 | 9.9 1.0ccMeasured using an identical aperture around the entire system for each frequency, and integrating all emission above the 3 level. |
| S (mJy) | 6.7 0.7 | 0.77 0.08 | 0.20 0.02 | 0.08 0.02 | 8.9 0.9ccMeasured using an identical aperture around the entire system for each frequency, and integrating all emission above the 3 level. |
| S (mJy) | 6.3 0.7 | 0.60 0.06 | 0.15 0.02 | 0.06 0.02 | 7.6 0.8ccMeasured using an identical aperture around the entire system for each frequency, and integrating all emission above the 3 level. |
| dd in the relation Sν ; this is derived by a least-squares power law fit to each of the data points measured. | 0.09 0.08 | 0.14 0.08 | 0.33 0.08 | 0.22 0.19 | 0.13 0.08 |
| Te (K)eeElectron temperatures are adopted from Skillman et al. (2003b). | 10900 | 10460 | 12810 | — | — |
| QLyc (1050 photons sec-1)ffOnly applicable to sources with a thermal emission origin; see Condon (1992). QLyc and SFR are the averages of each measure from the three available frequencies. | 85 | 9.2 | — | — | — |
| SFR (M⊙ yr-1)f,gf,gfootnotemark: | 0.026 | 0.003 | — | — | — |
| H Flux (10-14 erg sec-1 cm-2)hhDerived in Cannon et al. (2003). | 211 10 | 112 6 | 7.8 0.4 | 0.9 | 350 18 |
| Implied AHα (mag.)ffOnly applicable to sources with a thermal emission origin; see Condon (1992). QLyc and SFR are the averages of each measure from the three available frequencies. | 1.1 0.3 | 0.0 0.2 | — | 2.0iiExtinction toward source NGC 625 D is also calculated, since the error on the spectral index may allow a thermal slope. If the H flux has been underestimated by 50%, then this implied extinction falls to 1.1 magnitudes (see discussion in § 3.4). | — |
| PropertyaaThe number in parentheses after some entries corresponds to the reference from which that data point was taken. | NGC 625 | NGC 1569 | NGC 1705 | He 2-10 | NGC 5253 |
|---|---|---|---|---|---|
| Distance (Mpc) | 3.89 0.22 (1) | 2.2 0.6 (2) | 5.1 0.6 (3) | 9.0 (4)bbNo uncertainty quoted. | 4.1 0.2 (5) |
| H i Mass (M⊙) | 1.1108 (6) | 1.3108 (7) | 1.5108 (8) | 3.3108 (9) | 1.4108 (10) |
| MB | 16.3 | 17.0 | 16.3 | 17.4 | 17.1 |
| E(B-V)ccForeground extinction only, drawn from Schlegel et al. (1998). | 0.016 | 0.695 | 0.008 | 0.112 | 0.074 |
| 12+log(O/H) | 8.14 0.02 (11) | 8.190.02 (12) | 8.22 0.06 (13) | 8.93 (14)bbNo uncertainty quoted. | 8.150.04 (15) |
| Current SFR (M⊙ yr-1)ddApplying H fluxes from the works cited, and the conversion to star formation rate from Kennicutt, Tamblyn, & Congdon (1994). | 0.05 (1) | 0.1 (16) | 0.1 (17) | 1.4 (18) | 0.2 (16) |
| Global spectral index, | 0.13 0.08 (19) | 0.25 (20)bbNo uncertainty quoted. | — | 0.54 0.03 (4) | 0.0 0.1 (21) |
| X-Ray Luminosity | |||||
| (1036 erg/sec) | 100 (22) | 800 (23) | 120 (24) | 1200 (25)eeDiffuse gas component (0.3 - 6.0 keV) only. | 650 (26) |
References. — 1 - Cannon et al. (2003); 2 - Israel (1988); 3 - Tosi et al. (2001); 4 - Kobulnicky & Johnson (1999); 5 - Saha et al. (1995); 6 - Cannon et al. (2004a); 7 - Stil & Israel (2002); 8 - Meurer, Staveley-Smith, & Killeen (1998); 9 - Sauvage, Thuan, & Lagage (1997); 10 - Reif et al. (1982); 11 - Skillman et al. (2003b); 12 - Kobulnicky & Skillman (1997); 13 - Lee & Skillman, in preparation; 14 - Kobulnicky, Kennicutt, & Pizagno (1999); 15 - Kobulnicky et al. (1997); 16 - Martin (1998); 17 - Marlowe et al. (1997); 18 - Méndez et al. (1999); 19 - This work; 20 - Israel & de Bruyn (1988); 21 - Turner et al. (1998); 22 - Bomans & Grant (1998); 23 - Martin et al. (2002); 24 - Hensler et al. (1998); 25 - Martin & Kobulnicky, in preparation; 26 - Martin & Kennicutt (1995)