Chandra X-ray observations of Young Clusters II. Orion Flanking Fields Data.
Abstract
We present results of Chandra observations of two flanking fields (FF) in Orion, outside the Orion Nebula Cluster (ONC). The observations were taken with the ACIS-I camera with an exposure time of about 48 ks each field. We present a catalog of 417 sources, which includes X-ray luminosity, optical and infrared photometry and X-ray variability information. We have found 91 variable sources, 33 of which have a flare-like light curve, and 11 of which have a pattern of a steady increase or decrease over a 10 hour period. The optical and infrared photometry for the stars identified as X-ray sources are consistent with most of these objects being pre-main sequence stars with ages younger than 10 Myr. We present evidence for an age difference among the X-ray selected samples of NGC 2264, Orion FF, and ONC, with NGC 2264 being the oldest, and ONC being the youngest.
1 INTRODUCTION
The Orion Nebula is one of the best studied star formation regions in the Galaxy. The Orion Nebula Cluster (ONC) designates the inner 3 pc ( 20 arcmin) from C Orionis, and contains more than three thousand stars. The core of the ONC, also known as the Trapezium Cluster (Trumpler, 1931; Herbig & Terndrup, 1986), comprises the stars located within 0.3 pc ( 2 arcmin) of C Orionis, it has an inferred stellar density of about 8000 stars pc-3 and it is one of the densest known region of star formation (McCaughrean & Stauffer, 1994). Most of the ONC members are visible, primarily because the massive stars in the Trapezium Cluster have swept the gas from the molecular cloud creating a cavity facing towards us. The structure, dynamics and stellar content of the ONC have been extensively studied (Hillenbrand, 1997; Hillenbrand et al., 1998; Hillenbrand & Carpenter, 2000; Carpenter, 2000; Luhman et al., 2000; O’Dell, 2001). The stars in the ONC are less than 1 Myr old and their masses range from 0.05 M⊙ to 50 M⊙ (Hillenbrand, 1997; Hillenbrand & Carpenter, 2000). Studies of the outer regions of the Orion Nebula (Flanking Fields) have revealed the presence of young stars of ages between 1 and 3 Myrs old (Rebull et al., 2000; Gullbring et al., 1998; Hartmann, 1998), with an accretion disk fraction of about 40% (Rebull et al., 2000). The Orion Nebula provides an excellent laboratory for studying pre-main sequence (PMS) stars, given its proximity (470 pc), its age and its stellar diversity.
PMS stars are strong X-ray emitters; typical PMS stars have X-ray luminosities to above those observed in older main sequence stars (Feigelson & Montmerle, 1999). The X-ray emission in low mass stars comes from magnetic reconnection. In the dynamo model, the strength of the magnetic field, and hence the X-ray activity, depends on the rate of differential rotation and on the depth of the outer convective envelope (Gilman, 1983; Rosner et al., 1985). There is a clear relationship between rotation rate (period) and X-ray luminosity () found in late-type stars in clusters as old as NGC 2547 (15-40 Myrs, Jeffries et al., 2000) through the Hyades (500 Myrs, Stauffer et al., 1997). The ratio between the X-ray and bolometric luminosity, /, increases with increasing rotation rate, until the most rapidly rotating stars reach a maximum X-ray luminosity (or saturation level) such that / (see Pizzolato et al., 2003, and references within). It is much less clear that rotation and / are related in younger clusters. Gagne & Caillault (1994) studied a 4.5 square degree region centered in the Orion Nebula, using X-ray data from the Einstein Observatory. They found that at least 100 sources were associated with late-type PMS stars, and their X-ray activity was not correlated with published rotational periods and spectroscopic rotational velocities. Gagne et al. (1995) used ROSAT X-ray data in a similar study in the Orion Nebula, finding no dependence of X-ray activity on rotation. More recently, the Chandra Observatory has provided significantly improved spatial resolution and sensitivity for X-ray observations. Feigelson et al. (2002) reported X-ray observations of the ONC using the Chandra Observatory ACIS-I detector. They found more than a thousand X-ray sources, 91% of them associated with known stellar members of the cluster. Feigelson et al. (2003) also see no obvious correlation between rotation and / for their ONC sample, and conclude that the X-ray generation mechanism for young PMS stars must be different from that responsible in young main sequence stars. Flaccomio et al. (2003b) analyzed data for a number of young associations and clusters (including Orion), and agree that there is little correlation between / and rotation at very young ages, but conclude that the data are consistent with a single physical mechanism, where the Orion-age stars are simply all at or near the saturation level. We intend to use our Orion flanking field data and other new Chandra data for NGC 2264 Ramírez et al. (2004) to help determine at what age the relationship between rotation and / emerges.
In the present paper, we present results of Chandra observations of two of the flanking fields (FF) in the Orion Nebula (fields #2 & #4 from Rebull et al., 2000), just outside the ONC. We discuss source detection, variability and determination, providing a catalog of 417 X-ray sources. We present evidence that the X-ray selected sample of PMS stars in the flanking fields in Orion are older than a similarly selected sample in the ONC. In paper III (Rebull et al., 2004), we will discuss in more detail the relationships found here between rotation rate, mass accretion rate, disk indicators, and X-ray luminosity, in our field of NGC 2264 and the two Orion flanking fields.
2 OBSERVATIONS
Two flanking fields in Orion were observed with the Advanced CCD Imaging Spectrometer (ACIS) detector on board the Chandra X-ray Observatory (Weisskopf et al., 2002). The imaging array (ACIS-I) consists of four 10241024 front-side illuminated CCDs and covers an area on the sky of about 17’17’. The North Orion Flanking Field (NOFF) is centered at , about 36 ( 5 pc, at a distance of 470 pc) north of the Trapezium Cluster, and it was observed on 2002 August 26 with a total exposure time of 48.8 ks. The South Orion Flanking Field (SOFF), centered at , about 17 ( 2.5 pc, at a distance of 470 pc) south of the Trapezium Cluster, was observed on 2002 September 6 with a total exposure time of 47.9 ks. Figure 1 shows a 1 image of Orion from the Palomar Digital Sky Survey (Reid et al., 1991), with both Chandra ACIS-I fields of view marked as boxes. The fields were selected to maximize the number of stars in the field of view with known periods from Rebull (2001) and with minimal overlap with other contemporaneous Chandra Orion observation (Feigelson et al., 2002; Flaccomio et al., 2003b).
2.1 Data Preparation
Data analysis was performed in the same manner as described in Ramírez et al. (2004), where we discussed similar observations of a field in NGC2264. In summary, we started with the Level 1 processed event list, applied charge transfer inefficiency (CTI) correction as described in Townsley et al. (2000), then filtered by ASCA grades; by time intervals; and by background flaring due to solar activity. Removal of the background flares identified by the latter step reduced the exposure time to 46.9 ks for the NOFF and to 46.3 ks for the SOFF. Finally, the energy range was restricted to 0.3 – 10 keV. The filtering process was done using the Chandra Interactive Analysis of Observations (CIAO) package111http://cxc.harvard.edu/ciao/index.html. Figures 2 and 3 show the ACIS-I image of the filtered observations for the NOFF and the SOFF, respectively.
2.2 Source detection
X-ray sources were identified using the wavdetect tool within the CIAO package. The wavdetect tool works well in detecting X-ray sources in crowded fields. This tool performs a Mexican hat wavelet decomposition and reconstruction of the image as described in Freeman et al. (2002). We used wavelet scales ranging from 1 to 16 pixels in steps of , and the default source significance threshold of . The wavdetect tool was run separately in the four ACIS-I CCDs images for both fields and it produced an original list of 256 sources for the NOFF and 280 sources for the SOFF (see Sec 3.1).
2.3 Astrometric Alignment
The positions of the sources obtained by wavdetect were correlated with 2MASS positions. Each X-ray source was manually checked to confirm that the 2MASS counterpart lay within the radius for count extraction (as defined in Ramírez et al. (2004)). We checked the astrometry of the Chandra observations using all X-ray sources located within an off-axis angle () less than 5 arcmin that have 2MASS counterparts. A total of 85 NOFF sources and 70 SOFF sources meet this criteria. We determined a mean offset in R.A. of 0.02 and a mean offset in DEC of 0.03 between the NOFF Chandra and 2MASS coordinates and a mean offset in R.A. of 0.03 and a mean offset in DEC of 0.03 between the SOFF Chandra and 2MASS coordinates. The Chandra positions were corrected by these mean offsets to put the X-ray sources in the same reference frame as their 2MASS counterparts.
3 RESULTS
3.1 X-ray Photometry
X-Ray aperture photometry was initially performed on the 536 sources detected by the CIAO tool wavdetect. The radius for count extraction, , and the annulus for background determination were defined in the same manner as in Ramírez et al. (2004). The X-ray counts () and background counts were extracted using the CIAO tool dmextract. We computed the background in countsarcsec-2 as a function of off-axis angle (), performing a 3 rejection fit to avoid background counts from annuli that have other sources within. The computed background was constant as a function of , and it had a value of =(0.0720.024)countsarcsec-2 for the NOFF and a value of =(0.0590.021)countsarcsec-2 for the SOFF. The net count, N. C. and the count rate, C. R. were computed for each source as in Ramírez et al. (2004).
We carefully inspected the light curves of all the sources (see Sec. 3.3) and their appearance in the image of the Chandra field of view. A total of 119 (22%) sources were rejected from the original list: 107 sources had light curves consistent with cosmic ray afterglows, 5 sources were detected twice, since wavdetect was run separately in each CCD, and 7 sources were located at the edge of the field of view. Of the 107 light curves having a cosmic ray shape, 106 (99%) contain cosmic ray afterglows flagged by the pipeline. Our final list of 417 X-ray sources (203 from the NOFF, 214 from the SOFF) is provided in Table 1.
3.2 X-ray Luminosities
We selected all sources with more than 500 net counts, extracted their spectra and fit them to measure their X-ray fluxes. A total of 24 sources from the NOFF and 20 sources from the SOFF meet this criteria and they are listed in Table 2. The spectra were extracted within using the CIAO tool dmextract. The spectra of the NOFF and the SOFF sources are shown in Figures 4 and 5, respectively. We used the same spectral fitting process, as described by Ramírez et al. (2004), with the Redistribution Matrix Files (RMF) provided by the CTI corrector (Townsley et al., 2000), Auxiliary Response Files (ARF) created by the CIAO tool mkarf and later corrected for the ACIS low energy quantum efficiency degradation. We adopted a photoelectric absorption model (), which uses Wisconsin cross sections from Morrison & McCammon (1983). This model has one parameter that is the equivalent hydrogen column density (). The hydrogen column density was fixed to a value of 0.08 to match an extinction value of = 0.41, which is the most likely value of the observed extinction towards both Orion flanking fields (see Rebull et al., 2000, for more discussion). As discussed in Ramírez et al. (2004), the error in that comes from fixing is negligible. Finally, we adopted a thermal emission model () based on the model calculations of Mewe et al. (1985, 1986), and Kaastra (1992) with Fe L calculations by Liedahl et al. (1995). This model includes line emissions from several elements. The remaining two parameters in the model are the plasma temperature (kT) and a normalization factor. As in the analysis of NGC 2264 Chandra observations (Ramírez et al., 2004), we used a two temperature model to fix the X-ray spectra. The spectral parameters obtained from the two plasma temperature models are listed in Table 2. The X-ray flux for the brightest sources is determined from the best spectral model derived from the mean model parameters. We computed mean plasma temperatures of (0.630.05) keV and (2.60.3) keV for the NOFF sources and mean plasma temperatures of (0.770.05) keV and (2.90.2) keV for the SOFF sources. The mean plasma temperatures are held constant and the integration of the best fit between 0.3 and 8.0 keV provides the X-ray flux. The resulting X-ray fluxes are listed in Table 2.
We use the X-ray fluxes of the bright sources to compute a X-ray flux weighted conversion factor between count rate and X-ray flux. We obtained a conversion factor of (6.580.13) (erg/cm2/s)/(counts/ks) for the NOFF sources and a conversion factor of (6.720.20) (erg/cm2/s)/(counts/ks) for the SOFF sources. The values of these conversion factors are in reasonably good agreement with the derived conversion factor for our similar X-ray observation in NGC 2264 (6.160.13 (erg/cm2/s)/(counts/ks) Ramírez et al., 2004) and other published values (see Ramírez et al., 2004). The X-ray flux for our catalog of X-ray sources in both Orion fields is listed in column 10 of Table 1. The X-ray luminosity, , listed in column 11 of Table 1, is computed assuming a distance to Orion of 470 pc.
The limiting luminosity in our X-ray observations varies within the field of view, because of the variation of the PSF across the field. The faintest source is located at and it has a count rate of 0.08 counts/ks, corresponding to a X-ray luminosity of 28.15 at the distance of Orion. About 85 % of our sources are located within . At that off-axis angle the limiting count rate has increased to 0.20 counts/ks, corresponding to a X-ray luminosity of log()=28.5 at the distance of Orion. At , we cannot detected X-ray sources fainter than 0.45 counts/ks (log() = 28.9). Therefore, we adopt a value of log()=28.5 dex as the limiting X-ray luminosity for our observations, keeping in mind that this value holds for sources located within .
3.3 Variability
Light curves were determined for all 417 sources detected by wavdetect using the CIAO tool lightcurves with a bin time of 2500 s. The statistics of the light curves of the sources of our X-ray catalog were obtained using the Xronos 222http://heasarc.gsfc.nasa.gov/docs/xanadu/xronos/xronos.html tool lcstats. This provides, among other values, the probability of the light curve being constant, , as derived from the Chi-square value. The values are listed in column 12 of Table 1. The light curves of the sources with 90% were analyzed further, since they are the most likely to be variable. We defined a variable source as those having 2500 s bin light curves with 90%, and 5000 s and 7500 s bin light curves with reduced 2.5, as in Ramírez et al. (2004). There are 91 variable sources that meet this criteria. Variable sources are marked with a ’v’ in column 13 of Table 1. There are 33 variable sources which show a flare shape, defined as a rapid increase and a slow decrease in the X-ray flux. Variable sources with a flare-like light curve are marked with an additional ’f’ in column 13 of Table 1. There are sixteen sources that show a possible flare pattern, described as an increase in X-ray flux happening at the end of our observations or a decrease in X-ray flux occurring at the beginning of our observations. Variable sources with a possible flare pattern are marked with an additional ’p’ in column 13 of Table 1. We have detected a fraction of about 11% flaring sources (8% excluding possible flares) in both Orion flanking fields. A comparable fraction (about 8%) was observed in a similar length observation in NGC 2264 (Ramírez et al., 2004). There are 11 sources that show a steady increase or decrease in their X-ray flux. Those sources are marked with an additional ’s’ in column 13 of Table 1. A similar pattern is observed in two NGC 2264 sources (Ramírez et al., 2004) and three X-ray IC 348 sources (Preibisch & Zinnecker, 2002). These patterns might be understood by rotational modulation of X-ray flares (Stelzer et al., 1999). In Figure 6, we show a selection of light curves of sources of comparable luminosity. In the top panels, we show two light curves with a flare shape; in the middle-top panels, there are two sources that show a steady decrease in their X-ray flux; in the middle-bottom panels, there are two variable light curves. Finally in the bottom panels, two constant light curves are plotted.
4 DISCUSSION
4.1 Description of the optical/infrared catalog
We correlated the X-ray sources with a catalog of optical and near-IR stars in the Orion region; see Tables 3 and 4. We constructed the catalog by merging 30 published catalogs of optical and infrared photometry, spectral types, previous X-ray detections, proper motion surveys, periods, and spectroscopic projected rotational velocities (). Although our X-ray data presented are located in two flanking fields (#2 and #4 from Rebull et al., 2000), we constructed a catalog over this whole region in an attempt to increase the number of stars with known and optical counterparts.
The optical photometry were taken from Rebull et al. (2000), Hillenbrand (1997), Stassun et al. (1999), Wolff et al. (2003), and Gagne et al. (1995), in that order. For near-IR photometry, Carpenter et al. (2001) averaged over their light curves, presenting the most reliable average magnitude. Magnitudes for the remaining stars then came from 2MASS, Muench et al. (2002), Hillenbrand et al. (1998), and Hillenbrand & Carpenter (2000), in that order. Spectral types were taken in this order: Rebull et al. (2000), Hillenbrand (1997), Herbig & Bell (1988), Duncan (1993), Edwards et al. (1993), Smith et al. (1983), Walker (1969, 1983), Gagne & Caillault (1994), Gagne et al. (1995), and Wolff et al. (2003). Gagne & Caillault (1994) and Gagne et al. (1995) collected much of the optical and spectroscopic literature for stars in this region, reporting on X-ray detections using Einstein and ROSAT, respectively. Strom et al. (1990) analyzed Einstein data for some stars in this region. The largest X-ray data base, and the one obviously most similar to our own data, is Feigelson et al. (2002); these Chandra ACIS X-ray detections are in the ONC region; their fields have marginal spatial overlap with the observations reported here. Finally, there are several surveys in this region devoted specifically to obtaining rotation data. Periods were taken from Rebull (2001), Stassun et al. (1999), Herbst et al. (2000, 2001), Carpenter et al. (2001), Gagne et al. (1995), in that order. Spectroscopic rotational velocities came from Rhode et al. (2001), Wolff et al. (2003), Duncan (1993), Smith et al. (1983), Gagne et al. (1995), Hartmann et al. (1986), and finally Walker (1980).
4.2 Comparison of optical/infrared and X-ray Catalogs
We found that 356 (85%) of our 417 X-ray sources have optical and/or infrared counterparts (130 (31%) have known periods). Each X-ray source was manually checked to confirm that the optical and/or infrared counterparts lay within the radius for count extraction (, as defined in Ramírez et al. (2004)). The 356 sources and their corresponding optical and/or infrared photometry are listed in Table 3. Other names of the sources given by the different catalogs used in our compilation are listed in Table 4.
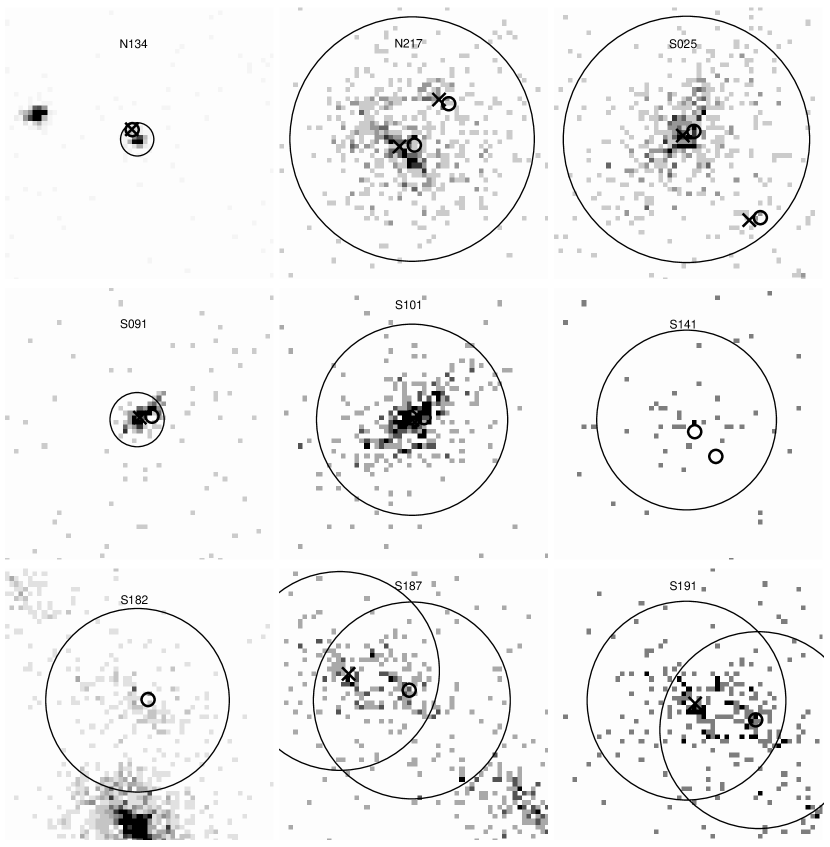
There were cases in which two optical/near-IR counterparts were located within , which is a measure of the size of the PSF in the Chandra field. This was the case for 9 X-ray sources, shown in Figure 7. These sources are marked with a ’c’ in Table 1 and are matched to the closest counterpart in each case. Source N134 seems to be have two components separated by 1”. The optical (Par 1970) and 2MASS counterparts coincide with the weaker component. Par 1970 is a B2 star, which should be weak in X-rays. Source N217 has two pairs of optical and 2MASS counterparts separated by 6.5”. Source S025 has two pairs of optical/2MASS counterparts within the extraction circle. One pair is at the edge of the extraction circle and the other within 1.3” of the X-ray position. Source S091 is an extended source, possibly with two components. Source S101 has two optical and one infrared source within the extraction circle. Source S141 has two optical sources within the extraction circle. Source S182 has a large aperture and its extraction circle contains emission from a nearby X-ray source. Sources S187 and S191 are separated by 5.5” at an off axis angle of about 8.5’. Their circles of extraction ( 10”) overlap considerably. Source S187 has an optical counterpart (Par 1897), while source S191 has an infrared counterpart (2MASS J05351696-0532464). Optical and/or infrared spectroscopy of these objects may help determine the true counterpart of these X-ray sources.
There are 902 stars in our optical/infrared catalog with , , and photometry and with positions inside the field of view of our Chandra observations. Among those 902 stars, 316 (35%) have X-ray Chandra counterparts. Figure 8 shows a magnitude histogram of all the 902 stars with , , and photometry and positions inside the Chandra field (solid line) and the histogram of the 316 X-ray Chandra counterparts (dotted line). The completeness limit of the infrared sample is that of 2MASS. We can see in Figure 8 that our infrared sample goes deeper than the sample of stars with X-ray counterparts. A similar behavior is seen in the optical sample histogram. This means that all the X-ray sources should have been matched to sources in our optical/infrared catalog if they are associated with stars earlier than M4 at the distance of Orion in the absence of extinction.
Among the Orion X-ray sources in our catalog, 130 (31% of the 417 X-ray source) have known periods from Rebull (2001). Among the Orion X-ray sources with known periods, 46 (35% of the 130 X-ray sources with known periods) are classified as variable X-ray sources, and 24 (18% of the 130 X-ray sources with known periods) show a flare or possible flare pattern. Nearly 52% of the 46 flaring X-ray sources are periodic in optical wavelengths, while only 31 % of all the X-ray sources show a periodic optical variation. There are twelve sources with short enough optical periods so that a significant fraction of the period is observed in the time length of the X-ray Chandra observations. However, the low signal to noise of the light curves and the presence of X-ray flares prevent us from drawing any conclusions regarding the presence or absence of rotational modulation of the X-ray flux.
There are 61 X-ray sources that do not have optical or infrared counterparts and they are marked with a ’x’ in column 13 of Table 1. Based on the limiting magnitude of our optical catalog ( 20 mag), the X-ray to optical flux ratio ,, of the sources with only X-ray detection is . Therefore, these sources could be either late M dwarfs or extragalactic objects (Stocke et al., 1991). Given the presence of a dark cloud behind Orion, the detection of background M dwarfs in X-rays is unlikely, so, if these sources detected only in X-rays are M dwarfs, then they should be 470 pc. We have identified 17 of these sources detected only in X-rays with sources in a deep 2MASS image (Kopan 2004, priv comm, 2 magnitudes deeper than the 2MASS All Sky Point Source Catalog) reducing the number of sources detected only in X-rays to 44. Based on the limiting flux of our X-ray sample, the maximun X-ray luminosity of M dwarfs (Fleming et al., 1995), and the limiting magnitude of the deep 2MASS image, we determined that all foreground M dwarfs present in our X-ray sample should have been detected in the deep 2MASS image. Source counts in the Chandra South and North Deep Fields (Rosati et al., 2002; Brandt et al., 2001) predict the presence of about 20 AGN in each ACIS field of view at the flux limit of our observations and assuming a Galactic extinction of 11 magnitudes (from NED extinction calculator333http://nedwww.ipac.caltech.edu/forms/calculator.html). Feigelson et al. (2002) found 101 X-ray sources with no optical counterparts in their 82 ks Chandra observation of the ONC, all highly concentrated towards the center of the ONC. They argued that most of those sources were indeed heavily embedded protostars or young stars seen behind the cloud. They estimated that the extragalactic contamination cannot be more than 15 objects, due to the high extinction of the ONC behind the stars. In our case, the extinction in front of the Orion flanking field stars is significantly lower than on the ONC (Rebull et al., 2000) and our only X-ray sources seem to be concentrated in areas of low extinction determined from a CO map of the area (Bally et al., 1987) and color of 2MASS sources in those areas. Thus, we believe that the most likely explanation is that most of the objects detected only in X-rays are active galaxies. Deeper infrared photometry or deeper X-ray observations may help determine the true nature of these sources.
There are 17 stars for which rotation and spectral type information exist in our optical/infrared catalog, and for which no X-ray counterpart was found. In order to allow us to use these stars in the next paper, we determined upper limits for their X-ray luminosity in the same manner as Ramírez et al. (2004). The upper limit for the X-ray luminosity was computed assuming a distance to Orion of 470 pc. The upper limit results are listed in Table 5.
4.3 Color-Color diagram.
In Figure 9, we have plotted the , color-color diagram of all the infrared sources in the field of view of our Chandra observation. Most of the X-ray sources with infrared colors are located near the locus of the classical T-Tauri (CTT) stars (Meyer et al., 1997). The remaining sources are located within the reddening vectors of late main sequence stars and CTT stars.
4.4 Color-Magnitude Diagrams.
There are 445 stars in our optical/infrared catalog with and photometry and with positions inside both fields of view of the Chandra observations. Among those 445 stars, 280 (63 %) have X-ray Chandra counterparts. In Figure 10, we have plotted ()– color magnitude diagrams of the optical sources in the fields of view of our Chandra observations. The dereddened color and the absolute magnitude were obtained assuming an average extinction of = 0.41 (Rebull et al., 2000), and dereddening relationships from Fitzpatrick (1999) and Mathis (1990). In both panels, we have also plotted isochrones from D’Antona & Mazzitelli (1998), as a reference. The dashed line corresponds to = 8.75 mag., which is the lower limit for a low mass Orion member rotating at the saturation level (log(/)=–3) with log()=28.5 (limit luminosity of our X-ray sample). This means that the most slowly rotating stars earlier than M3 with optical counterparts should be detected by our X-ray sample.
Most of our X-ray sources are younger than years at the distance of Orion, and furthermore the X-ray sources are heavily concentrated between the and the year old isochrones with respect to the general population. Stars that are strong X-ray emitters are likely to be young stars and therefore true members of the Orion cluster. In Rebull et al. (2000), as a result of the lack of membership information for stars this far from the Trapezium, a provisional membership criterion was defined. A line was drawn through an empirically-discovered gap nearly coincident with the 3 Myr isochrone to divide the stars clumping above it in a locus (likely members) from the ones below it (likely field stars). This approximation was supported in Rebull (2001) by the locations of the periodic stars, also likely young and therefore members. The clustering of the X-ray sources above the 3 Myr isochrone is additional confirmation that stars in the locus are more likely to be true members of the cluster than stars below this locus.
There is one star (S038) with brighter than 0 magnitude. Its optical counterpart, Par 1605, has a spectral type of A0V. It has log()=30.1 and /=. X-ray emission from late B stars and early A stars is rare, since they are in the transition between wind driven X-ray emission from hot stars and magnetically driven coronae from late type stars. It is often speculated that the X-ray emission observed in late B and early A stars comes from unseen late type companions (Stelzer et al., 2003; Daniel et al., 2002), that explanation could apply to Par 1605.
There are 3 X-ray sources that appear to be much older than years. One of them (141S), has unreliable photometry because of background contamination from a nearby star. The other sources (N068 and S115) lack both spectral type and membership information. If we deredden sources N068 and S115 (see Figure 9) along reddening vector towards the locus of CTT stars, we derive a value of 5.9 magnitudes for source N068 and value of 2.1 magnitudes for source S115. The locations of sources N068 and S115 are indicated along with their dereddened positions in Figure 9. In Figure 11, we have plotted the color magnitude diagram of all the infrared sources with X-ray counterparts, with isochrones from D’Antona & Mazzitelli (1998). The locations of sources N068 and S115 are indicated along with their possible dereddened position. It is possible that these two objects are the youngest and most embedded of our X-ray sources, if they are indeed members of the Orion complex. The unusual optical colors of these sources could be explained by scattered light from an edge on disk.
4.5 Age Difference.
Figure 12 shows the dereddened color magnitude diagram for three X-ray selected samples. On the left panel, we plot the NGC 2264 sample from Ramírez et al. (2004), which includes 201 stars showing X-ray emission. The central panel shows Orion FF data from the present work. Finally, the right panel shows 584 X-ray ONC sources (Feigelson et al., 2002) that have optical counterparts from our database. The stars from the three samples have been dereddened using the following criteria. If the star has a known spectral type, we have used derived from the spectra. For the remaining stars, we have derived from photometry, assuming that the stars are PMS stars. We use from infrared colors if this is greater than one magnitude. If not, we use the median for each field (=0.25 for NGC 2264, =0.25 for Orion FF, and =1.31 for the ONC, Herbig & Terndrup 1986). This criterion is reasonable for fields with variable reddening, as the ONC, where can be as high as 4 magnitudes.
There are several notable differences among the shown CMDs. NGC 2264 stars appear to be more compactly distributed than the ONC stars. There are fewer high mass stars in the Orion FF sample than in the ONC sample. The NGC 2264 sample appears to be the oldest of the three samples. One way to quantify these differences is through the use of statistical boxes. We have divided each X-ray selected sample into smaller samples containing stars of a determined color range of 0.5 magnitudes of width. For each color range we have determined a box, as defined by Tukey (1977) (see also Cleveland, 1993). The central horizontal line in each box is the median for the range in color, while the bottom and the top of the box shows its inter–quartile range (containing 50% of the sample), and the vertical lines coming out of the box mark the position of the adjacent points of the sample (most extreme values in the sample that are not more than 1.5 times the inter–quartile range). In Figure 13 we show the box plots for the three samples together with isochrones from D’Antona & Mazzitelli (1998). We have only plotted the boxes that overlap with all three samples, are within the range of isochrones (), and are not subject to biases from the optical limit of the catalog or other intrinsic properties (; Rebull, 2001). We have also plotted in the three panels horizontal dotted lines that correspond to the median value of the Orion FF boxes. The median, upper and lower quartile values are listed in Table 6 for each of the color ranges and for three the samples of X-ray sources. All the NGC 2264 medians are systematically lower than the Orion FF medians, with a mean difference of 0.3 magnitudes (=0.1). All the ONC medians are systematically higher than the Orion FF medians, with a mean difference of 0.3 magnitudes (=0.1). The effect of reddening is very small, since the reddening vectors go almost parallel to the isochrones. If we used the median reddening for each field, we find the same mean differences in the median for each color range. If we used a one magnitude higher or one magnitude lower, we get again the same differences in the median .
The observed differences can be explained by a difference in age among the three samples. Using the D’Antona & Mazzitelli (1998) isochrones, we derive an age of 2 Myrs, 1 Myrs, and 0.5 Myrs for the X-ray selected samples of NGC 2264, Orion FF, and ONC, respectively. Alternatively, assuming vertical Hayashi tracks, stellar luminosities scale as (Hartmann, 1998). Thus, differences in luminosity of 0.3 magnitudes corresponds to ratios in age of a factor of 1.5. Searching for young stars in X-rays is known to be a efficient way of finding young stars (for example, the RASS, e.g., Neuhaeuser et al., 1995). Does the age difference for the X-ray selected stars in the three regions apply as well for all low mass members in the three regions? Our own belief is that X-ray selection does not bias YSO population statistics in terms of age and mass (e.g. Feigelson et al., 2002) and therefore our age estimates should be valid for the entire set of stars in the three regions. We caution however that X-ray selection may result in bias for other physical parameters, such as rotation or disk properties (e.g. Flaccomio et al., 2003a, b). In order to provide some support to our assertion concerning X-ray selection bias and age, we have constructed plots like Figure 13 for low mass members of the three clusters located within the Chandra field of view but not restricted to X-ray detection. We derived box-plots for the optical sample of likely members in all three regions using two different reddening prescriptions - one with a mean reddening for each field, and one where we derived reddening exactly as for Figure 13. In both cases, we derived similar ages and age differences for the three fields. We note that this result differs from that reported in Rebull et al. (2000) and Rebull (2001), where no age difference was found between optical samples in the ONC and the Orion flanking fields. The earlier studies used larger fields and a different statistical method that may have smeared out any age differences that might be present. We note that none of the essential conclusions in earlier papers change in any way if the Orion flanking fields are indeed older (or contain a range of older ages) than the ONC.
5 CONCLUSIONS
We present a catalog of Orion X-ray sources from two flanking fields. The observations were taken with the ACIS-I on board the Chandra X-ray Observatory. The catalog, consisting of 417 sources, includes X-ray luminosity, optical and infrared photometry and X-ray variability information. We found 91 variable sources, 33 of which have a flare like light curve, and 11 of which have a pattern of a steady increase or decrease. From the optical and infrared counterparts of the X-ray sources, we have learned that most of the X-ray sources have colors consistent with CTTs that are younger than years. We argue that the data are consistent with an age difference among the X-ray selected samples of NGC 2264, Orion FF, and ONC, with NGC 2264 being the oldest, and ONC being the youngest.
This catalog of X-ray sources will be used to study the relationship between rotational properties and X-ray characteristics of Orion and NGC 2264 stars in paper III (Rebull et al., 2004). We plan to discuss correlations of / with rotation rate (period and sin), disk indicators (, , , and ), and mass accretion rate as derived from excess. We will also compare the / values found here with those from other young clusters.
References
- Bally et al. (1987) Bally, J., Stark, A. A., Wilson, R. W., & Langer, W. D., 1987, ApJ, 312, 45L
- Brandt et al. (2001) Brandt, W. N., Alexander, D. M., Hornschemeier, A. E., Garmire, G. P., Schneider, D. P., Barger, A. J., Bauer, F. E., Broos, P. S., Cowie, L. L., Townsley, L. K., Burrows, D. N., Chartas, G., Feigelson, E. D., Griffiths, R. E., Nousek, J. A., & Sargent, W. L. W., 2001, AJ, 122, 2810
- Carpenter (2000) Carpenter, J., 2000, AJ, 120, 3139
- Carpenter et al. (2001) Carpenter, J., Hillenbrand, L. A., & Skrutskie, M. F., 2001, AJ, 121, 3160
- Cleveland (1993) Cleveland, W.S., 1993, Visualizing Data, Hobart Press, Summit, New Jersey
- D’Antona & Mazzitelli (1998) D’Antona, F. & Mazzitelli, I., 1998, in “Brown Dwarfs and Extrasolar Planets”, ASP Conference Series, eds. R. Rebolo, E. Martin, M.R. Zapatero Osorio, p. 442
- Daniel et al. (2002) Daniel, K. J., Linsky, J. L., & Gagné, M. 2002, ApJ, 578, 486
- Duncan (1993) Duncan, D. K., 1993, ApJ, 406, 172
- Edwards et al. (1993) Edwards, S., Strom, S. E., Hartigan, P., Strom, K. M., Hillenbrand, L. A., Herbst, W., Attridge, J., Merrill, K. M., Probst, R., & Gatley, I., 1993, AJ, 106, 372
- Feigelson & Montmerle (1999) Feigelson, E. D., & Montmerle, T., 1999, ARA&A, 37, 363
- Feigelson et al. (2002) Feigelson, E. D., Bross, P., Gaffney, J. A., Garmire, G., Hillenbrand, L. A., Pravdo, S. H., Townsley, L., & Tsuboi, Y., 2002, ApJ, 574, 258
- Feigelson et al. (2003) Feigelson, E. D., Gaffney, J. A., Garmire, G., Hillenbrand, L. A., & Townsley, L., 2003, ApJ, 584, 911
- Fitzpatrick (1999) Fitzpatrick, E. L., 1999, PASP, 111, 63
- Flaccomio et al. (2003a) Flaccomio, E., Micela, G., & Sciortino, S., 2003a, A&A, 397, 611
- Flaccomio et al. (2003b) Flaccomio, E., Micela, G., & Sciortino, S., 2003b, A&A, 402, 277
- Fleming et al. (1995) Fleming T. A., Schmitt, J. H. M. M., & Giampapa, M. S., 1995, ApJ, 450, 401
- Freeman et al. (2002) Freeman, P. E., Kashyap, V., Rosner, R., & Lamb, D. Q., 2002, ApJS, 138, 185
- Gagne & Caillault (1994) Gagne, M., & Caillault, J.-P., 1994, ApJ, 437, 361
- Gagne et al. (1995) Gagne, M., Caillault, J.-P., & Stauffer, J. R., 1995, ApJ, 445, 280
- Gilman (1983) Gilman, P. A., 1983, ApJS, 53, 243
- Gullbring et al. (1998) Gullbring, E., Hartmann, L., Briceño, C. & Calvet, N., 1998, ApJ, 492, 323
- Hartmann (1998) Hartmann, L., 1998, Accretion Processes in Star Formation (Cambridge: Cambridge Univ. Press)
- Hartmann et al. (1986) Hartmann, L., Hewett, R., Stahler, S., Mathieu, R. D., 1986, ApJ, 309, 275
- Herbig & Terndrup (1986) Herbig, G. H., & Terndrup, D. M., 1986, ApJ, 307, 609
- Herbig & Bell (1988) Herbig, G. H., & Bell, K. R., 1988, Lick Observatory Bull. No. 1111, 1
- Herbst et al. (2000) Herbst, W., Rhode, K. L., Hillenbrand, L. A., & Curran, G., 2000, AJ, 119, 261
- Herbst et al. (2001) Herbst, W., Bailer-Jones, C. A. L., & Mundt, R., 2001, ApJ, 554, 197L
- Hillenbrand (1997) Hillenbrand, L., 1997, AJ, 113, 1733
- Hillenbrand et al. (1998) Hillenbrand, L. A., Strom, S. E., Calvet, N., Merrill, K. M., Gatley, I., Makidon, R. B., Meyer, M. R., & Skrutskie, M. F., 1998, AJ, 116, 1816
- Hillenbrand & Carpenter (2000) Hillenbrand, L. A., & Carpenter, J., 2000, ApJ, 520, 236
- Jeffries et al. (2000) Jeffries, R. D., Totten, E. J., & James, D. J. 2000, MNRAS, 316, 950
- Jones & Walker (1988) Jones, B., and Walker, M., 1988, AJ, 95, 1755.
- Kaastra (1992) Kaastra, J. S., 1992, An X-Ray Spectral Code for Optically Thin Plasmas (Internal SRON-Leiden Report, updated version 2.0)
- Kraft et al. (1991) Kraft, R. P., Burrows, D. N., & Nousek, J. A., 1991, ApJ, 374, 344
- Liedahl et al. (1995) Liedahl, D. A., Osterheld, A. L., & Goldstein, W. H., 1995, ApJL, 438, 115
- Luhman et al. (2000) Luhman, K. L., Reike, G. H., Young, E. T., Cotera, A. S., Chen, H., Reike, M. J., Schneider, G., & Thompson, R. I., 2000, ApJ, 540, 1016
- Mathis (1990) Mathis, J. S., 1990, ARA&A, 28, 37
- McCaughrean & Stauffer (1994) McCaughrean, M. J., & Stauffer, J. R., 1994, AJ, 108, 1382
- Mewe et al. (1985) Mewe, R., Gronenschild, E. H. B. M., & and van den Oord, G. H. J., 1985, A&AS, 62, 197
- Mewe et al. (1986) Mewe, R., Lemen, J. R., & van den Oord, G. H. J., 1986, A&AS, 65, 511
- Meyer et al. (1997) Meyer, M. R., Calvet, N. , & Hillenbrand, L. A., 1997, AJ, 114, 288
- Morrison & McCammon (1983) Morrison, R., McCammon, D., 1983, ApJ, 270, 119
- Muench et al. (2002) Muench, A., Lada, E. A., Lada, C. J., & Alves, J., 2002, ApJ, 573, 366
- Neuhaeuser et al. (1995) Neuhaeuser, R., Sterzik, M. F., Schmitt, J. H. M. M., Wichmann, R., & Krautter, J., 1995, A&A, 297, 391
- O’Dell (2001) O’Dell, C. R., 2001, PASP, 113, 29
- Parenago (1954) Parenago, P. P. 1954, Trudy Gos. Astron. Inst. im. Shternberga, 25, 1
- Park et al. (2000) Park, B.-G., et al. 2000, AJ, 120, 894
- Pizzolato et al. (2003) Pizzolato, N., Maggio, A., Micela, G., Sciortino, S., Ventura, P., 2003, A&A, 397, 147
- Preibisch & Zinnecker (2002) Preibisch, T. & Zinnecker, H., 2002, ApJ, 123, 1613
- Ramírez et al. (2004) Ramírez, S. V., Rebull, L., Stauffer, J., Hearty, T., Hillenbrand, L., Jones, B., Makidon, R., Pravdo, S., Strom, S., & Werner, M., 2004, AJ, in press
- Rebull et al. (2000) Rebull, L. M., Hillenbrand, L. A., Strom, S. E., Duncan, D. K., Patten, B. M., Pavlovsky, C. M., Makidon, R. B., & Adams, M. T., 2000, AJ, 119, 3026
- Rebull (2001) Rebull, L. M., 2001, AJ, 121, 1676
- Rebull et al. (2004) Rebull, L. M., et al. in preparation
- Reid et al. (1991) Reid, I. N., Brewer, C., Brucato, R. J., McKinley, W. R., Maury, A. ,Mendenhall, D., Mould, J. R., Mueller, J., Neugebauer, G., Phinney, J., Sargent, W. L. W., Schombert, J., & Thicksten, R., 1991,PASP, 661
- Rhode et al. (2001) Rhode, K., Herbst, W., & Mathieu, R. D., 2001, AJ, 122, 3258
- Rosati et al. (2002) Rosati, P., Tozzi, P., Giacconi, R., Gilli, R., Hasinger, G., Kewley, L., Mainieri, V., Nonino, M., Norman, C., Szokoly, G., Wang, J. X., Zirm, A., Bergeron, J., Borgani, S., Gilmozzi, R., Grogin, N., Koekemoer, A., Schreier, E., Zheng, W., 2002, ApJ, 566, 667
- Rosner et al. (1985) Rosner, R., Golub, L., & Vaiana, G. S., 1985, ARA&A, 23, 413
- Smith et al. (1983) Smith, M. A., Beckers, J. M., & Barden, S. C., 1983, ApJ, 271, 237
- Stassun et al. (1999) Stassun, K., Mathieu, R. D., Mazeh, T., & Vrba, F. J., 1999, AJ, 117, 2941
- Stauffer et al. (1997) Stauffer, J. R., Balachandran, S. C., Krishnamurthi, A., Pinsonneault, M., Terndrup, D. M., & Stern, R. A., 1997, ApJ, 475, 604
- Stelzer et al. (1999) Stelzer, B., Neühauser, R., Casanova, S., & Montmerle, T., 1999, A&A, 344, 154
- Stelzer et al. (2003) Stelzer, B., Huélamo, N., Hubrig, S., Zinnecker, H., & Micela, G., 2003, A&A, 407, 1067
- Stocke et al. (1991) Stocke, J. T., Morris, S. L., Gioia, I. M., Maccacaro, T., Schild, R., Wolter, A., Fleming, T. A., & Henry, J. P., 1991, ApJS, 76, 813
- Strom et al. (1990) Strom, K. M., Strom, S. E., Wilkin, F. P., Carrasco, L., Cruz-Gonzalez, I., Recillas, E., Serrano, A., Seaman, R. L., Stauffer, J. R., Dai, D., & Sottile, J., 1990, ApJ, 362, 168
- Sung et al. (1997) Sung, H., Bessell, M., & Lee, S.-W., 1997, AJ, 114, 2644
- Tian et al. (1996) Tian, K. P., van Leeuwen, F., Zhao, J. L., & Su, C. G., 1996, A&AS, 118, 503
- Townsley et al. (2000) Townsley, L. K., Broos, P. S., Garmire, G. P., & Nousek, J. A., 2000, ApJ, 534, 139L
- Trumpler (1931) Trumpler, R. J., 1931, PASP, 43, 255
- Tukey (1977) Tukey, J. W., 1977, Exploratory Data Analysis, Addison-Wesley
- Walker (1969) Walker, M., 1969, ApJ, 155, 447
- Walker (1980) Walker, M., 1980, PASP, 102, 726
- Walker (1983) Walker, M., 1983, ApJ, 271, 642
- Weisskopf et al. (2002) Weisskopf, M. C., Brinkman, B., Canizares, C., Garmire, G., Murray, S., & van Speybroeck, L. P., 2002, PASP, 114, 1
- Wolff et al. (2003) Wolff, S., Strom, S. E., & Hillenbrand, L. A., 2003, ApJin press
(figure available at http://spider.ipac.caltech.edu/staff/solange/ramirez07_figs.ps)


| X-ID | Name | RA | DEC | Flux | log() | Commentsbbv: variable star; f: flare-like light curve; p: possible flare in the light curve; s: steady increase or decrease in the light curve; c: source confusion, see details in Sec.4.1;x: source detected only in X-rays, see details in Sec.4.2 | ||||||
|---|---|---|---|---|---|---|---|---|---|---|---|---|
| (2000) | (2000) | (’) | (”) | (ks) | (count/ks) | (erg/cm2/s) | log(erg/s) | % | ||||
| (1) | (2) | (3) | (4) | (5) | (6) | (7) | (8) | (9) | (10) | (11) | (12) | (13) |
| North Orion Flanking Field (NOFF) | ||||||||||||
| N001 | CXORRS J053442.6-044215 | 5 34 42.70 | -4 42 15.294 | 10.93 | 17.50 | 1.00 | 35.9 | 17.25 | 0.114E-12 | 30.48 | 93 | |
| N002 | CXORRS J053444.5-044214 | 5 34 44.53 | -4 42 14.807 | 10.55 | 16.30 | 1.00 | 36.4 | 12.88 | 0.848E-13 | 30.35 | 0 | v,s |
| N004 | CXORRS J053448.2-044740 | 5 34 48.24 | -4 47 40.865 | 7.77 | 9.50 | 0.98 | 40.9 | 36.05 | 0.237E-12 | 30.80 | 0 | v,s |
| N005 | CXORRS J053448.5-044956 | 5 34 48.60 | -4 49 56.658 | 7.78 | 8.70 | 0.96 | 24.7 | 1.56 | 0.103E-13 | 29.43 | 99 | |
| N007 | CXORRS J053451.0-044341 | 5 34 51.05 | -4 43 41.614 | 8.39 | 10.10 | 0.98 | 38.7 | 10.48 | 0.690E-13 | 30.26 | 0 | v,f |
| N008 | CXORRS J053451.2-044757 | 5 34 51.28 | -4 47 57.405 | 7.00 | 9.40 | 0.99 | 41.6 | 55.40 | 0.365E-12 | 30.98 | 23 | v |
| N010 | CXORRS J053452.4-044941 | 5 34 52.46 | -4 49 41.023 | 6.85 | 6.70 | 0.97 | 36.5 | 1.04 | 0.684E-14 | 29.26 | 100 | |
| N011 | CXORRS J053453.0-044811 | 5 34 53.02 | -4 48 11.677 | 6.55 | 6.20 | 0.96 | 40.5 | 0.44 | 0.290E-14 | 28.88 | 100 | |
| N012 | CXORRS J053453.8-044340 | 5 34 53.82 | -4 43 40.195 | 7.83 | 8.80 | 0.98 | 36.7 | 0.44 | 0.290E-14 | 28.88 | 100 | |
| N015 | CXORRS J053454.3-045413 | 5 34 54.31 | -4 54 13.447 | 8.63 | 10.70 | 0.97 | 40.2 | 2.10 | 0.138E-13 | 29.56 | 97 | |
| N016 | CXORRS J053454.4-044540 | 5 34 54.44 | -4 45 40.342 | 6.73 | 6.50 | 0.97 | 41.8 | 0.26 | 0.171E-14 | 28.66 | 100 | |
| N017 | CXORRS J053454.5-045604 | 5 34 54.58 | -4 56 4.736 | 9.96 | 14.40 | 0.98 | 32.5 | 3.88 | 0.255E-13 | 29.83 | 99 | |
| N018 | CXORRS J053455.1-044827 | 5 34 55.12 | -4 48 27.968 | 6.05 | 5.30 | 0.96 | 40.6 | 24.67 | 0.162E-12 | 30.63 | 2 | v |
| N019 | CXORRS J053455.6-045611 | 5 34 55.67 | -4 56 11.579 | 9.89 | 14.20 | 0.98 | 39.3 | 3.78 | 0.249E-13 | 29.82 | 99 | |
| N020 | CXORRS J053456.3-044548 | 5 34 56.31 | -4 45 48.316 | 6.25 | 5.70 | 0.97 | 37.7 | 1.14 | 0.750E-14 | 29.30 | 100 | x |
| N021 | CXORRS J053456.3-044437 | 5 34 56.39 | -4 44 37.961 | 6.77 | 6.60 | 0.97 | 41.5 | 1.79 | 0.118E-13 | 29.49 | 100 | x |
| N022 | CXORRS J053456.8-044605 | 5 34 56.81 | -4 46 5.044 | 6.01 | 5.30 | 0.97 | 39.8 | 8.12 | 0.534E-13 | 30.15 | 95 | |
| N025 | CXORRS J053457.9-044913 | 5 34 57.90 | -4 49 13.139 | 5.43 | 4.40 | 0.95 | 19.6 | 14.61 | 0.961E-13 | 30.40 | 90 | |
| N026 | CXORRS J053458.2-045052 | 5 34 58.22 | -4 50 52.031 | 5.86 | 5.00 | 0.96 | 40.1 | 0.27 | 0.178E-14 | 28.67 | 100 | |
| N027 | CXORRS J053459.3-045011 | 5 34 59.35 | -4 50 11.837 | 5.36 | 4.30 | 0.95 | 42.7 | 2.40 | 0.158E-13 | 29.62 | 89 | |
| N029 | CXORRS J053459.6-044756 | 5 34 59.63 | -4 47 56.143 | 4.92 | 3.70 | 0.95 | 43.4 | 0.68 | 0.447E-14 | 29.07 | 100 | x |
| N030 | CXORRS J053459.7-045158 | 5 34 59.70 | -4 51 58.602 | 6.18 | 5.50 | 0.96 | 42.0 | 0.62 | 0.408E-14 | 29.03 | 98 | |
| N031 | CXORRS J053459.8-045526 | 5 34 59.87 | -4 55 26.028 | 8.66 | 10.80 | 0.98 | 40.3 | 1.18 | 0.776E-14 | 29.31 | 100 | |
| N034 | CXORRS J053500.7-044649 | 5 35 0.80 | -4 46 49.233 | 4.85 | 3.60 | 0.95 | 34.8 | 1.12 | 0.737E-14 | 29.29 | 99 | |
| N035 | CXORRS J053500.9-044819 | 5 35 0.92 | -4 48 19.319 | 4.60 | 3.30 | 0.95 | 43.7 | 0.93 | 0.612E-14 | 29.21 | 98 | |
| N037 | CXORRS J053501.9-044115 | 5 35 1.96 | -4 41 15.366 | 8.22 | 9.70 | 0.98 | 40.8 | 4.65 | 0.306E-13 | 29.91 | 13 | v |
| N038 | CXORRS J053502.0-044731 | 5 35 2.09 | -4 47 31.843 | 4.36 | 3.00 | 0.95 | 34.9 | 1.14 | 0.750E-14 | 29.30 | 100 | |
| N039 | CXORRS J053502.3-044755 | 5 35 2.33 | -4 47 55.508 | 4.21 | 2.90 | 0.95 | 32.3 | 2.64 | 0.174E-13 | 29.66 | 98 | x |
| X-ID | Optical ID | kT1 | kT2 | FluxaaFlux determined from models of mean plasma temperatures | |
|---|---|---|---|---|---|
| (counts/ks) | (keV) | (keV) | (erg/cm2/s) | ||
| North Orion Flanking Field (NOFF) | |||||
| N093 | Par 1817 | 209.4 | 0.77 | 3.40 | 14.20 |
| N256 | Par 2257 | 65.6 | 0.70 | 2.87 | 4.03 |
| N218 | Par 2140 | 60.6 | 0.56 | 1.96 | 3.61 |
| N087 | Par 1798 | 56.0 | 1.05 | 3.62 | 3.78 |
| N008 | Par 1621 | 55.4 | 0.40 | 2.63 | 3.60 |
| N097 | Par 1834 | 52.5 | 0.00 | 3.58 | 3.35 |
| N126 | Par 1950 | 43.5 | 0.65 | 2.22 | 2.65 |
| N044 | Par 1701 | 35.4 | 0.00 | 2.74 | 2.54 |
| N004 | Par 1598 | 36.0 | 0.00 | 2.11 | 2.21 |
| N137 | Par 1967 | 30.3 | 0.31 | 1.39 | 1.88 |
| N165 | Par 2043 | 41.4 | 0.30 | 1.31 | 2.54 |
| N124 | Par 1935 | 27.8 | 0.00 | 1.23 | 1.65 |
| N190 | Par 2081 | 29.5 | 0.85 | 4.40 | 1.77 |
| N222 | Par 2145 | 27.0 | 0.61 | 2.40 | 1.54 |
| N018 | Par 1651 | 24.7 | 0.84 | 3.88 | 1.60 |
| N195 | R01 2133 | 21.1 | 0.40 | 3.25 | 1.25 |
| N080 | Par 1778 | 20.3 | 0.00 | 4.02 | 1.16 |
| N208 | Par 2109 | 17.0 | 0.24 | 1.07 | 0.91 |
| N081 | SMMV 1944 | 17.3 | 0.00 | 1.96 | 1.01 |
| N156 | Par 2017 | 67.2 | 0.00 | 1.38 | 4.06 |
| N046 | Par 1710 | 16.4 | 0.89 | 4.36 | 0.95 |
| N130 | Par 1948 | 16.1 | 0.87 | 5.02 | 0.91 |
| N001 | R01 1413 | 17.2 | 0.00 | 6.76 | 0.82 |
| N175 | Par 2064 | 12.9 | 0.00 | 1.01 | 0.75 |
| South Orion Flanking Field (SOFF) | |||||
| S249 | Par 2069 | 200.9 | 0.85 | 3.71 | 13.30 |
| S168 | Par 1828 | 100.8 | 1.00 | 4.80 | 7.21 |
| S238 | Par 2048 | 103.8 | 0.66 | 3.34 | 7.25 |
| S020 | Par 1553 | 52.0 | 0.70 | 2.43 | 3.40 |
| S198 | Par 1929 | 37.5 | 0.66 | 2.23 | 2.41 |
| S040 | Par 1756 | 34.7 | 0.77 | 2.70 | 2.16 |
| S183 | Par 1874 | 31.6 | 1.00 | 4.45 | 2.13 |
| S152 | Par 1787 | 27.3 | 1.33 | 5.82 | 1.85 |
| S058 | Par 1643 | 26.5 | 0.64 | 2.02 | 1.34 |
| S172 | Par 1846 | 21.2 | 0.64 | 2.65 | 1.26 |
| S202 | Par 1942 | 19.5 | 0.78 | 2.66 | 1.12 |
| S174 | Par 1848 | 19.5 | 0.86 | 3.70 | 1.14 |
| S022 | Par 1564 | 17.8 | 0.64 | 1.63 | 1.12 |
| S047 | Par 1613 | 16.0 | 0.69 | 1.76 | 0.86 |
| S016 | Par 1535 | 15.4 | 0.64 | 1.63 | 0.85 |
| S039 | Par 1616 | 15.6 | 0.64 | 1.47 | 0.85 |
| S176 | Par 1876 | 14.4 | 0.81 | 3.36 | 0.86 |
| S079 | R01 1603 | 13.1 | 0.32 | 3.58 | 0.64 |
| S025 | Par 1571 | 13.4 | 1.04 | 1.88 | 0.84 |
| S104 | CHS 7005 | 21.2 | 0.00 | 0.00 | 0.96 |
| Name | RA | DEC | X-ID | U | V | J | H | K | |
|---|---|---|---|---|---|---|---|---|---|
| (2000) | (2000) | mag | mag | mag | mag | mag | mag | ||
| R01 1413 | 5 34 42.616 | -4 42 14.86 | N001 | 18.79 | 15.52 | 13.07 | 10.99 | 9.94 | |
| Par 1567 | 5 34 44.512 | -4 42 13.71 | N002 | 0.04 | 15.38 | 13.53 | 12.36 | 11.49 | 10.89 |
| Par 1598 | 5 34 48.155 | -4 47 39.98 | N004 | 0.11 | 16.63 | 14.08 | 12.05 | 10.73 | 9.97 |
| CHS 5807 | 5 34 48.548 | -4 49 56.72 | N005 | 13.97 | 12.07 | ||||
| Par 1620 | 5 34 50.988 | -4 43 41.35 | N007 | 16.02 | 13.60 | 12.14 | 11.09 | 10.43 | |
| Par 1621 | 5 34 51.204 | -4 47 56.91 | N008 | 15.85 | 13.45 | 11.88 | 10.66 | 9.96 | |
| R01 1536 | 5 34 52.410 | -4 49 40.29 | N010 | 19.34 | 16.40 | 13.76 | 12.45 | ||
| Par 1639 | 5 34 52.963 | -4 48 10.56 | N011 | 17.10 | 15.20 | 12.23 | |||
| R01 1563 | 5 34 53.670 | -4 43 40.69 | N012 | 18.12 | 15.82 | 14.57 | 13.95 | ||
| 2MASS J05345431-0454129 | 5 34 54.313 | -4 54 13.447 | N015 | 14.81 | 12.42 | ||||
| R01 1570 | 5 34 54.391 | -4 45 39.22 | N016 | 19.70 | 16.11 | 13.83 | 13.11 | ||
| R01 1572 | 5 34 54.501 | -4 56 4.96 | N017 | 18.05 | 14.65 | 12.11 | 10.93 | ||
| Par 1651 | 5 34 55.052 | -4 48 27.54 | N018 | 0.47 | 16.27 | 14.12 | 12.44 | 11.13 | 10.41 |
| R01 1586 | 5 34 55.574 | -4 56 11.23 | N019 | 19.11 | 15.25 | 12.47 | 11.00 | ||
| CHS 6568 | 5 34 56.817 | -4 46 4.78 | N022 | 11.46 | |||||
| R01 1610 | 5 34 57.827 | -4 49 12.54 | N025 | 16.99 | 14.43 | 12.73 | 11.91 | ||
| R01 1620 | 5 34 58.184 | -4 50 51.45 | N026 | 18.61 | 15.72 | 13.30 | 12.38 | ||
| Par 1672 | 5 34 59.269 | -4 50 11.41 | N027 | 15.85 | 13.38 | 11.77 | 10.93 | ||
| R01 1635 | 5 34 59.636 | -4 51 57.50 | N030 | 21.60 | 16.58 | 13.94 | 12.94 | ||
| 2MASS J05345988-0455272 | 5 34 59.874 | -4 55 26.028 | N031 | 17.05 | 14.02 | ||||
| R01 1647 | 5 35 0.740 | -4 46 49.07 | N034 | 16.52 | 13.99 | 12.44 | 11.69 | ||
| R01 1651 | 5 35 0.846 | -4 48 18.71 | N035 | 17.23 | 14.22 | 12.38 | 11.58 | ||
| R01 1659 | 5 35 1.890 | -4 41 14.54 | N037 | 1.35 | 18.86 | 15.55 | 13.22 | 12.14 | |
| R01 1660 | 5 35 2.000 | -4 47 30.73 | N038 | 21.16 | 15.93 | 13.49 | 12.86 | ||
| Par 1692 | 5 35 2.303 | -4 49 15.92 | N040 | 0.24 | 16.74 | 14.28 | 12.70 | 11.88 | |
| R01 1663 | 5 35 2.574 | -4 49 29.12 | N042 | 17.68 | 14.87 | 12.60 | 11.09 | 10.22 | |
| Par 1700 | 5 35 2.891 | -4 48 32.54 | N043 | 16.57 | 16.52 | 14.61 | 13.21 | 12.51 | |
| Par 1701 | 5 35 3.229 | -4 49 20.29 | N044 | 14.31 | 13.01 | 11.32 | 9.96 | 9.08 | |
| R01 1677 | 5 35 3.252 | -4 56 42.63 | N045 | 18.24 | 15.60 | 13.58 | 12.33 | 11.57 | |
| Par 1710 | 5 35 3.622 | -4 50 52.77 | N046 | 16.47 | 15.11 | 13.19 | 11.47 | 10.36 | |
| 2MASS J05350376-0447516 | 5 35 3.748 | -4 47 51.576 | N047 | 14.24 | 13.47 | ||||
| Par 1709 | 5 35 4.292 | -4 46 42.20 | N048 | 9.79 | 9.26 | ||||
| 2MASS J05350469-0452418 | 5 35 4.668 | -4 52 41.560 | N049 | 14.35 | 12.67 |
| X-ID | Par namebbParenago (1954). | R01 nameccRebull (2001). | CHS nameddCarpenter et al. (2001). | 2MASS nameee2MASS Catalog. | Other namesffSMMV (Stassun et al. (1999)); Tian (Tian et al. (1996)); ROSAT (Gagne & Caillault (1994)); Einstein (Gagne et al. (1995)); HBC (Herbig & Bell (1988)); JW (Jones & Walker (1988)); H97 (Hillenbrand (1997)); Feigelson (Feigelson et al. (2002)); HBJM (Herbst et al. (2001)). |
|---|---|---|---|---|---|
| N001 | R01 1413 | CHS 5282 | 2MASS J05344268-0442148 | SMMV 1089 | |
| N002 | Par 1567 | R01 1429 | CHS 5438 | 2MASS J05344454-0442146 | Tian 125,ROSAT 42,SMMV 1126 |
| N004 | Par 1598 | R01 1483 | 2MASS J05344823-0447401 | ROSAT 52 | |
| N005 | CHS 5807 | 2MASS J05344854-0449568 | |||
| N007 | Par 1620 | R01 1521 | 2MASS J05345106-0443414 | ||
| N008 | Par 1621 | R01 1522 | CHS 6064 | 2MASS J05345128-0447570 | Einstein 56,ROSAT 59 |
| N010 | R01 1536 | 2MASS J05345249-0449404 | |||
| N011 | Par 1639 | R01 1542 | 2MASS J05345302-0448104 | ||
| N012 | R01 1563 | 2MASS J05345374-0443407 | |||
| N015 | 2MASS J05345431-0454129 | ||||
| N016 | R01 1570 | 2MASS J05345446-0445393 | |||
| N017 | R01 1572 | 2MASS J05345458-0456053 | |||
| N018 | Par 1651 | R01 1578 | CHS 6412 | 2MASS J05345513-0448277 | ROSAT 72 |
| N019 | R01 1586 | CHS 6469 | 2MASS J05345566-0456117 | ||
| N022 | CHS 6568 | 2MASS J05345682-0446047 | |||
| N025 | R01 1610 | 2MASS J05345791-0449127 | SMMV 1452 | ||
| N026 | R01 1620 | 2MASS J05345826-0450517 | |||
| N027 | Par 1672 | R01 1633 | 2MASS J05345935-0450117 | ||
| N030 | R01 1635 | 2MASS J05345971-0451578 | |||
| N031 | 2MASS J05345988-0455272 | ||||
| N034 | R01 1647 | 2MASS J05350082-0446491 | |||
| N035 | R01 1651 | 2MASS J05350093-0448188 | |||
| N037 | R01 1659 | CHS 7084 | 2MASS J05350196-0441145 | ||
| N038 | R01 1660 | 2MASS J05350208-0447308 | |||
| N040 | Par 1692 | R01 1662 | 2MASS J05350238-0449161 | ||
| N042 | R01 1663 | 2MASS J05350265-0449293 | |||
| N043 | Par 1700 | R01 1668 | CHS 7175 | 2MASS J05350298-0448326 | |
| N044 | Par 1701 | R01 1676 | CHS 7211 | 2MASS J05350326-0449209 | Tian 158 |
| N045 | R01 1677 | 2MASS J05350333-0456430 | |||
| N046 | Par 1710 | R01 1678 | CHS 7251 | 2MASS J05350370-0450530 | |
| N047 | 2MASS J05350376-0447516 | ||||
| N048 | Par 1709 | 2MASS J05350421-0446435 | Tian 161 | ||
| N049 | 2MASS J05350469-0452418 | ||||
| N050 | 2MASS J05350481-0447089 |
| Par Name | R Name | CHS Name | 2MASS Name | Other Names | Counts | Flux | log() | |
|---|---|---|---|---|---|---|---|---|
| (counts) | (counts/ks) | (erg/cm2/s) | log(erg/s) | |||||
| CHS 10870 | 6.30 | 0.3447 | 0.0227 | 28.78 | ||||
| Par 2083 | Tian 250 | 10.70 | 0.4994 | 0.0329 | 28.94 | |||
| Par 2131 | 2MASS J05353948-0451216 | Tian 258 | 9.80 | 0.2455 | 0.0161 | 28.63 | ||
| Par 1654 | R01 1599 | 2MASS J05345622-0445574 | Tian 150 | 8.00 | 0.2016 | 0.0133 | 28.54 | |
| Par 1708 | 2MASS J05350478-0443546 | Tian 162 | 8.40 | 0.2328 | 0.0153 | 28.61 | ||
| CHS 8034 | 2MASS J05351065-0442075 | 6.30 | 0.1464 | 0.0096 | 28.41 | |||
| CHS 8467 | 2MASS J05351406-0453112 | 5.10 | 0.1671 | 0.0110 | 28.46 | |||
| R01 1937 | CHS 9321 | 2MASS J05351974-0448180 | 3.00 | 0.1881 | 0.0124 | 28.51 | ||
| R01 1720 | 2MASS J05350693-0449097 | 13.90 | 0.8425 | 0.0554 | 29.17 | |||
| R01 1806 | 2MASS J05351282-0539077 | JW 398 | 3.00 | 0.2237 | 0.0150 | 28.60 | ||
| CHS 9056 | 2MASS J05351795-0535157 | JW 579,SMMV 2470 | 6.70 | 0.1530 | 0.0103 | 28.43 | ||
| 2MASS J05351898-0537234 | HBJM 10548 | 3.80 | 0.1427 | 0.0096 | 28.40 | |||
| JW 618 | 5.60 | 0.1889 | 0.0127 | 28.53 | ||||
| Par 1810 | R01 1795 | 2MASS J05351235-0536403 | JW 384 | 10.10 | 0.4175 | 0.0280 | 28.87 | |
| Par 1898 | 2MASS J05351596-0539147 | JW 514,Tian 196 | 3.00 | 0.1990 | 0.0134 | 28.55 | ||
| R01 1949 | 2MASS J05352074-0537536 | JW 667 | 8.50 | 0.3344 | 0.0225 | 28.77 | ||
| R01 1451 | 2MASS J05344609-0537312 | JW 79 | 12.10 | 0.3498 | 0.0235 | 28.79 |
| NGC 2264 | Orion Flanking Fields | Orion Nebula Cluster | |||||||
|---|---|---|---|---|---|---|---|---|---|
| Color Range | Upper | Median | Lower | Upper | Median | Lower | Upper | Median | Lower |
| Quartile | Quartile | Quartile | Quartile | Quartile | Quartile | ||||
| 1.0–1.5 | 3.81 | 4.21 | 4.44 | 3.18 | 3.71 | 4.22 | 2.66 | 3.43 | 3.90 |
| 1.5–2.0 | 4.30 | 4.88 | 5.25 | 4.15 | 4.53 | 4.88 | 3.63 | 4.30 | 4.69 |
| 2.0–2.5 | 5.10 | 5.58 | 5.98 | 4.81 | 5.30 | 5.72 | 4.57 | 4.94 | 5.45 |