Discovery of hard non-thermal pulsed X-ray emission
from the anomalous X-ray pulsar 1E 1841-045
Abstract
We report the discovery of non-thermal pulsed X-ray/soft -ray emission up to keV from the anomalous X-ray pulsar AXP 1E 1841-045 located near the centre of supernova remnant Kes 73 using RXTE PCA and HEXTE data. The morphology of the double-peaked pulse profile changes rapidly with energy from 2 keV up to keV, above which the pulse shape remains more or less stable. The pulsed spectrum is very hard, its shape above 10 keV can be described well by a power law with a photon index of . 1E 1841-045 is the first AXP for which such very-hard pulsed emission has been detected, which points to an origin in the magnetosphere of a magnetar. We have also derived the total emission spectrum from the Kes73/1E 1841-045 complex for the 2-270 keV energy range using RXTE HEXTE and XMM-Newton PN data. A comparison of the total emission from the complex with the pulsed+DC emission from 1E 1841-045 as derived from Chandra ACIS CC-mode data (Morii et al., 2003) leaves little room for emission from Kes 73 at energies near 7 keV or above. This suggests that the HEXTE spectrum above 10 keV, satisfactorily described by a power law with index , is dominated by emission from 1E 1841-045. In that case the pulsed fraction for energies above 10 keV would increase from about 25% near 10 keV to 100% near 100 keV. The origin of this DC-component extending up to 100 keV is probably magnetospheric and could be a manifestation of pulsed emission which is “on” for all phases.
1 Introduction
The quest whether anomalous X-ray pulsars (AXPs) and soft gamma-ray repeaters (SGRs) are both manisfestations of isolated neutron stars with ultra-strong magnetic fields ( G), so-called “magnetars” (Thompson & Duncan, 1996), has recently been decided. Notably, the first detection of SGR-like bursts from the direction of AXP 1E 1048.1-5937 (Gavriil et al., 2002b), followed by the detection of SGR-like bursts from AXP 1E 2259+586 (Kaspi et al., 2003) conclusively unified AXPs and SGRs (see also Gavriil et al., 2004). Similarly, Kulkarni et al. (2003) showed that the originally classical SGR 0526-66 was recently found to behave like an AXP. This was predicted uniquely by the magnetar model (Thompson & Duncan, 1996). For recent reviews on AXPs and SGRs see Mereghetti et al. (2002) and Woods (2004).
In this paper we present detailed timing and spectral characteristics of AXP 1E 1841-045, located in the centre of the supernova remnant (SNR) Kes 73 (G27.4+0.0), which is at a kinematic distance between 6 and 7.5 kpc (Sanbonmatsu & Helfand, 1992). The X-ray pulsations of the source were discovered with ASCA (Vasisht & Gotthelf, 1997) and a phase-connected timing solution was published by Gotthelf et al. (2002), who analyzed observations with the Rossi X-ray Timing Explorer (RXTE) spanning 2 years. A linear ephemeris appeared to be consistent with the pulse periods measured over 15 years with Ginga, ASCA, RXTE and BeppoSAX. The measured constant, long-term spin-down of 1E 1841-045 as well as the phase-connected timing with “timing-noise-like” residuals supported a magnetar identification.
Morii et al. (2003) reported detailed results for 1E 1841-045 from Chandra ACIS CC-mode observations. They could for the first time discriminate the compact object from the surrounding SNR Kes 73. Like other AXPs, the phase integrated spectrum (pulsed and DC emission) was well fitted with a power law (photon index 2.0 0.3) plus blackbody model (kT= 0.44 0.02 keV). The photon index is the flattest among AXPs. It should be noted, however, that a two-blackbody fit rendered a similarly good fit. They also reported that the pulse profile is double-peaked, with the second pulse exhibiting a harder spectrum between 3 and 7 keV.
Molkov et al. (2004) published recently a source catalog of 28 sources detected by INTEGRAL/IBIS between 18 and 60 keV in a survey of the Sagittarius Arm tangent region. The source in this catalog with the hardest spectrum was identified with 1E 1841-045 and SNR Kes 73. Since AXPs are “known” to be soft-spectrum sources, the SNR seemed at first glance the most likely counterpart. This identification stimulated us to analyse archival RXTE PCA and HEXTE data to search for a pulsed signature from 1E 1841-045, particularly in the hard X-ray range covered by HEXTE. We also analyzed archival XMM-Newton data in an attempt to unravel the contributions from Kes 73 and the pulsed and unpulsed emissions from 1E 1841-045, combining the informations from our RXTE PCA/HEXTE and XMM-Newton analyses, and the Chandra results on 1E 1841-045 published by Morii et al. (2003) .
2 Instruments and observations
In this study the results come mainly from the analysis of data from two of the three X-ray instruments aboard RXTE , the Proportional Counter Array (PCA; 2-60 keV) and the High Energy X-ray Timing Experiment (HEXTE; 15-250 keV). Both are non-imaging instruments. The PCA (Jahoda et al., 1996) consists of five collimated xenon proportional counter units (PCUs) with a total effective area of cm2 over a (FWHM) field of view. Each PCU has a front Propane anti-coincidence layer and three Xenon layers which provide the basic scientific data, and is sensitive to photons with energies in the range 2-60 keV. The energy resolution is about 18% at 6 keV.
The HEXTE instrument (Rothschild et al., 1998) consists of two independent detectors clusters, each containing four Na(Tl)/CsI(Na) scintillation detectors. The HEXTE detectors are mechanically collimated to a (FWHM) field of view and cover the 15-250 keV energy range with an energy resolution of 15% at 60 keV. The collecting area is 1400 cm2 taking into account the loss of the spectral capabilities of one of the detectors. The maximum time resolution of the tagged events is s. In its default operation mode the field of view of each cluster is switched on and off source to provide instantaneous background measurements. Due to the co-alignment of HEXTE and the PCA, they simultaneously observe the sources in their field of view. Table 1 lists the publicly available RXTE observations used in this study1111E 1841-045 is regularly monitored by RXTE since February 1999. All observations listed in Table 1 have been carried out with the instrumental pointing axis within from 1E 1841-045. In the fourth column the PCU unit 2 screened exposure is given (see Sect. 3.1). A typical observation run consists of several sub-observations spaced more or less uniformly between the start and end date of the observation. In this study the total number of sub-observations amounts 45.
| Obs. | Begin/End Date | Exp.† | |
| id. | (dd/mm/yyyy) | (ks) | |
| 40083 | 15-02-1999 | 23-02-2000 | 105.73 |
| 50082 | 10-04-2000 | 08-03-2001 | 59.91 |
| 60069 | 02-04-2001 | 26-01-2002 | 52.24 |
| 70094 | 16-03-2002 | 27-01-2003 | 53.26 |
| †PCU-2 exposure after screening | |||
3 Timing analysis
3.1 Timing analysis of PCA data
The PCA data from the observations listed in Table 1 have all been collected in Goodxenon or GoodxenonwithPropane mode allowing high-time-resolution (s) studies in 256 spectral channels. Because we are mainly interested in the medium/hard X-ray timing properties of 1E 1841-045 we ignored the events triggered in the Propane layers of each PCU. Furthermore, we used only data from the top xenon layers of each PCU in order to improve the signal-to-noise ratio. Because the number of active PCUs at any time was changing we treated the five PCUs constituting the PCA separately. For each PCU good time intervals have been determined by including only time periods when the PCU in question is on and during which the pointing direction is within from the target, the elevation angle above Earth’s horizon is greater than , a time delay of 30 minutes since the peak of a South-Atlantic-Anomaly passage holds, and a low background level from contaminating electrons is observed. These good time intervals have subsequently been applied in the screening process to the data streams from each of the PCUs (e.g. see Table 1 for the resulting screened exposure of PCU-2 per observation run).

Next, for each sub-observation the arrival times of the selected events (for each PCU unit) have been converted to arrival times at the solar system barycenter (in TDB time scale) using the instantaneous spacecraft position and celestial position of 1E 1841-045 (see Gotthelf et al., 2002). These barycentered arrival times have been folded with the phase connected timing solution given in Gotthelf et al. (2002) using only the first three frequency coefficients to obtain pulse phase distributions for selected energy windows. Combining now the phase distributions from the various PCUs the well-known 2-10 keV profile of 1E 1841-045 (see Gotthelf et al., 2002) could be recognized in each sub-observation, however, phase shifts between the sub-observations made a direct combination impossible. Therefore we correlated the pulse phase distribution of each sub-observation with a chosen initial template and applied the measured phase shifts to obtain an aligned combination with much higher statistics. The correlation is then once repeated with, instead of the initially chosen template, the aligned combination from the first correlation to obtain the final summed profile (see e.g. de Plaa et al., 2003, for a similar iterative method applied for PSR B0540-69). The summed profile for energies between 3.9-7.8 keV deviates from uniformity at a level and is shown in Fig. 1. Its morphology mimics the profile shown by Gotthelf et al. (2002). For the first time, however, pulsed emission has been detected up to keV - the deviation from uniformity is and in the 11.7-16.1 keV and 16.1-23.8 keV energy ranges, respectively - providing strong evidence for a non-thermal origin of the pulsed high-energy emission. This result motivated us to search also the higher-energy HEXTE data for a pulsar signal.

.

3.2 Timing analysis of HEXTE data
HEXTE operated in its default rocking mode during the observations listed in Table 1 allowing the collection of real-time background data from two independent positions to either side of the on-source position. For the timing analysis we selected only the on-source data. Good time intervals have been determined using similar screening filters as used in the case of the PCA. The selected on-source HEXTE event times have subsequently been barycentered and folded according to the ephemeris given in Gotthelf et al. (2002) using again only the first three frequency coefficients. Applying the phase shifts as derived from the contemporaneous PCA measurements to the HEXTE phase distributions of each sub-observation we could obtain the HEXTE pulse phase distributions in 256 spectral channels for the combination of observations listed in Table 1. The HEXTE integral ( keV) pulse profile deviates from uniformity at a level and shows strong similarities with the PCA profile for energies above keV. Most remarkably, the pulse profile for energies greater than 50.3 keV reaches a significance of , proving the existence of pulsed emission from 1E 1841-045 at hard X-rays/ soft -rays (see Fig. 2).
3.3 Energy dependence of the pulse profile morphology
We have investigated the morphology of the pulse phase distributions as a function of energy using both the RXTE PCA and HEXTE data. This kind of information could provide clues to the origin and physics of the processes responsible for the pulsed high-energy radiation. In Fig. 3 a collage of pulse-phase distributions is shown for different energy bands between and keV 222For HEXTE the 26-35.2 energy window is ignored in this collage because of a huge background line near 30 keV due to the activation of iodine.. A striking feature is that pulse minimum occurs in the phase range irrespective of the energy band. Furthermore, the structured broad profile, measured with high statistics in the PCA data, seems to behave as two components (“pulses”) separated in phase, with the relative contributions varying with energy. The first “pulse” near phase 0.1 is dominant over the second “pulse” near phase 0.5 for energies below keV. Above this energy the second pulse, however, has a similar intensity level as the first pulse. Quantitatively this behaviour is shown in Fig. 4, where the ratio of the number of excess counts in phase range 0.8-1.25 (P1) and 0.25-0.7 (P2) for RXTE PCA data is plotted as a function of energy (phase range 0.7-0.8 is chosen as a DC-reference window).

The of a fit to a function parameterized as improves by about (1 degree of freedom) relative to the of a fit assuming a constant, i.e. no energy dependence of the ratio. Thus, we conclude that the morphology of the high-energy ( keV) pulse profiles of 1E 1841-045 changes with energy.
4 Spectral analysis
In this section high-energy ( keV) spectra are presented for: 1) the total pulsed emission from 1E 1841-045 based on RXTE PCA and HEXTE data, and 2) the total high-energy emission from the Kes 73 supernova remnant plus the embedded AXP 1E 1841-045 using RXTE HEXTE on/off data and XMM Newton PN data.
4.1 Pulsed X-ray spectrum of 1E 1841-045
The number of pulsed counts in the differential PCA/HEXTE energy bands has been determined by fitting a truncated Fourier series, , with the pulse phase, to the measured pulse phase distributions. It turned out that 3 harmonics () were sufficient to describe the measured distributions accurately for all energy intervals. For example, in Figs. 1 and 2 the best fit truncated Fourier series are shown as dashed lines for the PCA 3.9-7.8 keV and HEXTE keV pulse phase distributions, respectively.
In case of the PCA we derived for each PCU the energy response matrix (energy redistribution including the sensitive area) for the combination of observations listed in Table 1 and subsequently took the different PCU (screened) exposure times into account in the construction of the weighted PCU-combined energy response. The pulsed excess counts per energy band are fitted in a procedure assuming a power-law photon spectrum folded through the PCU-combined energy response. The best fit power-law model to the PCA pulsed data has a photon index of . The derived 2-10 keV total pulsed flux333Spectral cross-calibration between the BeppoSAX MECS and RXTE PCA instruments indicate that the normalization of the PCA spectra is about 20% higher than that of the MECS. The PCA fluxes are therefore multiplied by 0.81 (see e.g. Kuiper et al., 2004, about this subject) is ( erg/cm2s, which is consistent with the 2-10 keV pulsed flux of ( erg/cm2s given in Gotthelf et al. (2002) who used a smaller dataset and a different extraction method (on/off).
In the spectral “deconvolution” process of the HEXTE total pulsed counts the on-axis444It was not necessary to derive off-source HEXTE response matrices taking into account the reduction in the sensitive area due to the collimator response because all observations were performed nearly on-axis. cluster A and B energy response matrices have been employed taking into account the (slightly) different screened on-source exposure times of each cluster. The exposure times have been corrected for the considerable deadtime effects.
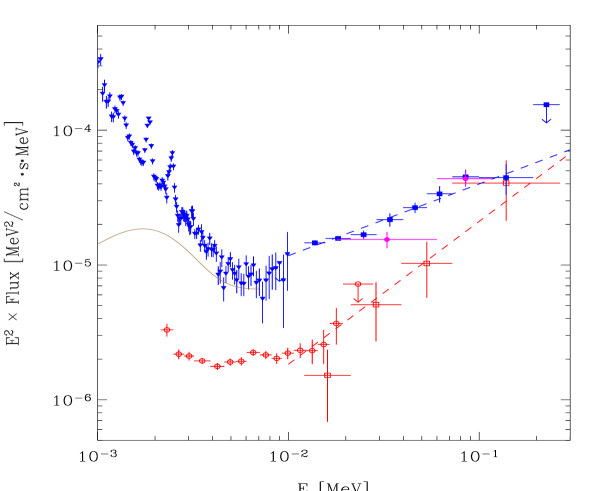
The total pulsed PCA and HEXTE flux measurements are shown in Fig. 5 as red open circles and squares, respectively. In this spectral representation the hardening of the pulsed flux near 10 keV is striking. A power-law model fitted to the PCA/HEXTE total pulsed flux measurements for energies above 10 keV yielded a photon index of . Such a spectral hardening has not been observed yet for any of the AXPs currently known.
4.2 Total X-ray spectrum of Kes 73 plus 1E 1841-045
For HEXTE a model independent way for deriving the total flux from the Kes 73/1E 1841-045 complex exists based on the source on/off observations. The off-source observations make it possible to obtain instantaneous background estimates. Subtracting the properly scaled background contribution (every 32 s on-source observation is accompanied by a 28 s off-source observation; 4 s is consumed in the slew process) from the on-source measurements yielded the total excess counts from the Kes 73/1E 1841-045 complex for energies above keV. These excess counts have been converted to flux values using similar procedures as discussed before and the resulting flux measurements are shown as blue filled squares in Fig. 5. A power-law fit through these points yielded a photon index of , slightly softer than the pulsed emission for energies above 10 keV.
In order to extend the total emission spectrum towards lower energies we analysed archival XMM Newton data from an observation targetted at 1E 1841-045. We used data taken on October 5, 2002, starting at 03:16:47 UTC. We processed the data using the latest version of the XMM-Newton analysis software, SAS 6.0.0. For the analysis, we first produced light curves in different energy bands of a region in the sky far from the supernova remnant to check for solar flares that might have affected the observation. Since no flares were detected in the light curves, we used the total length of the observation, s of on source time, for the rest of the analysis. We produced images and spectra both for the EPIC PN and the two EPIC MOS instruments, and checked that all instruments yielded consistent results. Since the EPIC PN has the largest overall effective area and is sensitive to higher energies than MOS, we only concentrated on this instrument for the rest of our analysis.
We extracted a spectrum of a circular region of 2 arcmin radius centered on 1E 1841-045 containing both the AXP and the supernova remnant. We checked that the spectrum is not affected by pile up555Pile up occurs when two or more photons hit the same CCD pixel within a read-out cycle. In that case the instruments count those photons as single event with an energy approximately equal to the sum of the energies of the individual photons. Pile up reduces the apparent flux of the source and at the same time makes the spectrum appear harder than it really is.. To produce a background spectrum we selected an area near the supernova remnant, but sufficiently far from it to avoid contamination from the supernova itself. Next we produced an energy response matrix and an ancilliary response file, the latter properly weighted using the surface brightness distribution of the extended emission of the source over the detector. We rebinned the spectrum such that we had about 3 bins per resolution element. Since the source is relatively bright, with this rebinning we obtained at least 25 counts per bin in the range 0.3 – 7 keV, and at least 16 counts per bin up to 11 keV. The “deconvolved” spectrum () is shown in Fig. 5: it displays a relatively bright continuum, on top of which several emission lines of Mg, Ar, S, and Si coming from the supernova remnant can be seen.
5 Discussion
We have presented the surprising discovery of very hard, photon index 0.94 0.16, pulsed hard X-ray emission extending up to energies of 150 keV from the AXP 1E 1841-045, obtained using archival monitoring observations by the PCA and HEXTE aboard RXTE. Such hard, non-thermal emission can only originate within the magnetosphere of a neutron star/magnetar. In fact, the total pulsed X-ray spectrum of 1E 1841-045 is very reminiscent to that of young spin-down powered pulsars. Particularly the spectrum of the Vela pulsar with a blackbody spectrum at lower X-ray energies and a hard power-law extension to higher energies looks very similar. These hard power-law spectral extensions with photon indices of are also found for the young (radio weak/quiet) spin-down powered pulsars PSR B1509-58, PSR B1846-0258, PSR J1811-1925, PSR J1930+1852, all associated with SNRs , like 1E 1841-045, and the old millisecond pulsars PSR J0218+4232, PSR B1821-24 and PSR B1937+21.
Such hard X-ray emission from AXPs has hardly been considered in the modelling of AXPs. However, Cheng & Zhang (2001) studied the production of high-energy gamma-ray radiation in the outer magnetospheres of AXPs. They argue that due to the strong field of a magnetar, the gamma-ray emission rooted at the polar caps will be quenched. However, far away from the pulsar surface, i.e. in the outer gaps, the gamma-rays could be emitted because the local magnetic field will drop below the critical quantum limit. The production process would be curvature radiation by the acceleration of electrons/positrons, resulting from the collisions between high-energy photons from the outer gap and the soft X-rays originating from the stellar surface. They applied their model calculations also to the case of 1E 1841-045, and predict an integral gamma-ray photon flux for energies above 100 MeV of 8.7 10-9 (d/6 kpc)-2 cm-2 s-1, which is below the EGRET sensitivity but above the sensitivity of GLAST. The very-hard pulsed spectrum we measured with HEXTE might be consistent with this interpretation.
We studied the energy dependence of the pulse profile morphology and confirm the findings by Morii et al. (2003), namely the pulse profile is double-peaked, and the second pulse has a harder spectrum for energies below 7 keV. However, this trend does not continue above keV. Within the statistics, both pulses remain visible at about the same strengths up to 150 keV. Significant variations with energy of pulse profile morphologies below keV have been reported earlier for three other AXPs (4U 0142+61, 1RXS 1708-4009 and 1E 2259.1+586) by Gavriil et al. (2002a).
The set of spectra shown in Fig. 5 summarizes our present knowledge on the contributions from the different components constituting the total emission from the direction of Kes 73 and AXP 1E 1841-045, i.e. the pulsed and DC components of 1E 1841-045, and the emission from SNR Kes 73. In addition to the total pulsed spectrum (PCA/HEXTE) and the pulsed+DC+Kes-73 spectrum (XMM EPIC PN/HEXTE) derived in this work, we show the INTEGRAL IBIS ISGRI flux values for energies 18–120 keV (Molkov et al., 2004), and the Chandra ACIS spectrum (Morii et al., 2003) for the pulsed+DC spectrum of 1E 1841-045. We note that the INTEGRAL flux points are consistent with our total HEXTE spectrum (one should realize that these preliminary INTEGRAL IBIS ISGRI flux values have still systematic uncertainties of 10%).
For energies up to about 7 keV we have information on the relative contributions: 1) the pulsed fraction of 1E 1841-045 is 25%, 2) there is very little margin for emission from SNR Kes 73 around 7 keV. This suggests that the HEXTE spectrum above 10 keV is dominated by emission from 1E 1841-045 (pulsed+DC), and above keV the spectrum is totally due to pulsed emission. This would mean that also the DC emission from 1E 1841-045 extends up to keV! An alternative interpretation is that the relative contribution from Kes 73 increases again above 10 keV due to a new hard component. Although the latter seems unlikely, higher spatial-resolution measurements at energies above 10 keV would be required to exclude this possibility.
If we assume that the contribution from Kes 73 is small or negligible above 10 keV, the challenge is now to explain the hard DC emission from 1E 1841-045. Most plausible might be an origin in the magnetosphere, namely for the situation that the pulsed emission is “on” for all phases. In the competing polar cap (e.g. as discussed for AXPs by Zhang & Harding, 2000) and outer gap (see e.g. Cheng & Zhang, 2001) scenarios explaining the high-energy emission from spin-down powered pulsars there are geometries for which this is indeed possible. Allowing for a small contribution from Kes 73, e.g. up to about 30 keV, and knowing that pulsar spectra depend on pulse phase, detailed model calculations are required to investigate this interpretation further.
References
- Cheng & Zhang (2001) Cheng, K.S. and Zhang, L. 2001, ApJ, 562, 918
- Gavriil et al. (2002a) Gavriil, F.P. and Kaspi, V.M. 2002, ApJ, 567, 1067
- Gavriil et al. (2002b) Gavriil, F.P., Kaspi, V.M., Woods, P.M. 2002, Nature, 419, 142
- Gavriil et al. (2004) Gavriil, F.P., Kaspi, V.M., Woods, P.M. 2004, AdSpR., 33, 654
- Gotthelf et al. (2002) Gotthelf, E.V., Gavriil, F.P., Kaspi, V.M., et al. 2002, ApJ, 564, L31
- Jahoda et al. (1996) Jahoda, K., Swank, J.H., Giles, A.B., et al., 1996, Proc. SPIE, 2808, 59
- Kaspi et al. (2003) Kaspi V.M., Gavriil, F.P., Woods, P.M., et al. 2003, ApJ, 588, 93
- Kuiper et al. (2004) Kuiper, L., Hermsen, W., Stappers, B. 2004, AdSpR., 33, 507
- Kulkarni et al. (2003) Kulkarni, S.R., Kaplan, D.L., Marshall, H.L., et al. 2003, ApJ, 585, 948
- Mereghetti et al. (2002) Mereghetti, S., Chialone, L., Israel, G.L., et al. 2002, Proc. 270 WE-Heraeus Seminar, 29
- Morii et al. (2003) Morii, M., Sato, R., Kataoka, J., et al. 2003, PASP, 55, L45
- Molkov et al. (2004) Molkov, S.V., Cherepashchuk, A.M., Lutovinov, A.A., et al. 2004, preprint (astro-ph/0402416v1)
- de Plaa et al. (2003) de Plaa, J., Kuiper, L., Hermsen, W. 2003, A&A, 400, 1013
- Rothschild et al. (1998) Rothschild, R.E., Blanco, P.R., Gruber, D.E., et al. 1998, ApJ, 496, 538
- Sanbonmatsu & Helfand (1992) Sanbonmatsu, K.Y. and Helfand, D.J. 1992, AJ, 104, 2189
- Thompson & Duncan (1996) Thompson, C. and Duncan R.C. 1996, ApJ, 473, 322
- Vasisht & Gotthelf (1997) Vasisht, G. and Gotthelf, E.V. 1997, ApJ, 486, 129
- Woods (2004) Woods, P.M. 2004, AdSpR., 33, 630
- Zhang & Harding (2000) Zhang, B. and Harding A.K. 2000, ApJ, 535, L51