HST Discovery of an Optical Counterpart to the Supersoft X-ray Source in the Globular Cluster M311affiliation: Based on observations with the NASA/ESA Hubble Space Telescope obtained at STScI, which is operated by AURA, Inc. under NASA contract NAS 5-26555.
Abstract
We report the detection, with HST, of an optical counterpart to the transient supersoft X-ray source 1E 1339.8+2837, in the globular cluster M3. The counterpart is found near the faint end of the subgiant branch in the vs color magnitude diagram, but is extremely bright in . Variability is detected over a range of timescales suggesting the presence of an accretion disk and perhaps also ellipsoidal variations of the subgiant secondary. The optical colors of the binary are similar to those of cataclysmic variables recently discovered in 47 Tucanae and NGC 6397. We suggest that magnetically channeled accretion may explain the relatively low X-ray luminosity of this source’s supersoft state.
1 Introduction
Supersoft X-ray sources (SSSs) are characterized by high bolometric luminosities ( erg s-1) and extremely soft X-ray spectra (blackbody temperatures of 15–80 eV). These characteristics are best explained by white dwarfs (WDs) that are burning hydrogen-rich matter accreted onto their surface from a companion star at the rate of about M⊙ per year (Kahabka & van den Heuvel 1997). These accretion rates are about a hundred times higher than those typically found in cataclysmic variables (CVs), the more common form of mass accreting binary containing a WD. Such high accretion rates can be supplied by mass transfer on a thermal time scale from a slightly evolved companion star (mass 1.3–2.5 M⊙) that is more massive than the WD (Kahabka & van den Heuvel 1997).
Of the nine known SSSs in the Milky Way (Kahabka & van den Heuvel 2003), only one is found in a globular cluster. A low luminosity X-ray source ( erg s-1) named 1E 1339.8+2837 was discovered just inside the 33′′ core radius of M3 (NGC 5272) by Einstein (Hertz & Grindlay 1983; we assume a distance of 10.1 kpc to M3, using Djorgovski 1993). This source had a much higher luminosity of erg s-1 when observed by ROSAT in January 1991 and January 1992 (Hertz, Grindlay, & Bailyn 1993) and a very soft spectrum ( eV, Hertz et al. 1993; eV, Dotani et al. 1999). This supersoft outburst is 10-100 times less luminous than most other SSSs (see Kahabka & van den Heuvel 2003 and Kahabka & van den Heuvel 1997). The ROSAT luminosity and temperature imply a WD radius of only cm, suggesting that only part of the WD surface is undergoing burning. The source has been seen in quiescence ( erg s-1) with a hard X-ray spectrum several times since the 1991/1992 outburst (6/1992, 7/1993, 7/1994, 7/1995 with ROSAT, and 1/1997 with ASCA; Dotani et al. 1999).
Because 1E 1339 is located in a globular cluster its distance and reddening are well known, helping in modeling of the system. Also, excellent constraints on the binary parameters are possible if the secondary in the system is found, combined with good optical photometry. No successful identification of an optical companion has yet been made, but very few searches have been reported in the literature. Hertz et al. (1993) report a star in the ROSAT error circle with UV magnitudes consistent with those of a horizontal branch star, and Geffert (1998) reports a blue star and a variable star within a 5′′ error circle, but provides no further details.
Here, we report the first detection of an optical companion to 1E 1339 in M3 using the ROSAT X-ray position determined by Verbunt (2001). HST imaging is used to combat crowding near the center of the cluster. We briefly discuss the implications of this detection, addressing the origin of the supersoft X-ray emission, and the parameters of the binary system. More details about the implications of these results will be given in Kahabka et al. (2004; in preparation).
2 Observations, Data Analysis and Results
The two archival WFPC2 datasets analyzed for this paper are program GO-5496 obtained in April 1995 (PI: F. Pecci) and program GO-6805 obtained in May 1998 (PI: C. Bailyn). These observations were obtained when the SSS was likely in quiescence (see above). Only a subset of the WF2 images in GO-5496 were analyzed (those with intermediate length exposures), while all of the WF2 images for GO-6805 were analyzed (see Table 1). In both of these datasets the candidate for the optical counterpart to 1E 1339 was found on the WF2 chip, and only the images for this chip are analyzed here.
2.1 Photometry
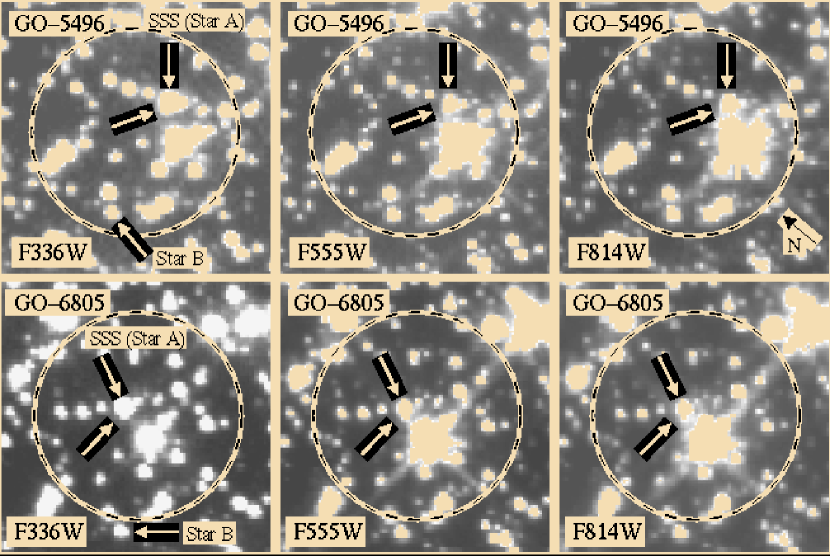
For both the GO-5496 and GO-6805 datasets, the F336W, F555W and F814W images were combined into deep, doubly oversampled images using the drizzle routines of Fruchter & Hook (2002). This procedure allowed for the removal of cosmic rays. Figure 1 shows a small region of the WF2 images in each filter for both datasets. The dashed circle (radius = 22, or 2-) is centered on the ROSAT position of 1E 1339 (Verbunt 2001). Note the shift in the position of this circle between the two HST observing epochs because of uncertainties in the HST astrometry. One star in the X-ray error circle appears from inspection to be relatively bright in , and is labeled as Star A. The offsets between the nominal X-ray position of the SSS and Star A are 097 (0.88-) and 036 (0.33-) for the GO-5496 and GO-6805 datasets respectively.
To create color magnitude diagrams (CMDs) for the WF2 chip, star lists were created in each of the three filters and PSF fitting was performed on the deep images. The instrumental F336W, F555W and F814W magnitudes were then converted into , and magnitudes using the zeropoints and color corrections of Holtzman et al. (1995). Stars were included in a CMD if they were detected in either and or and (the maximum matching distance between filters was 1.5 oversampled pixels).
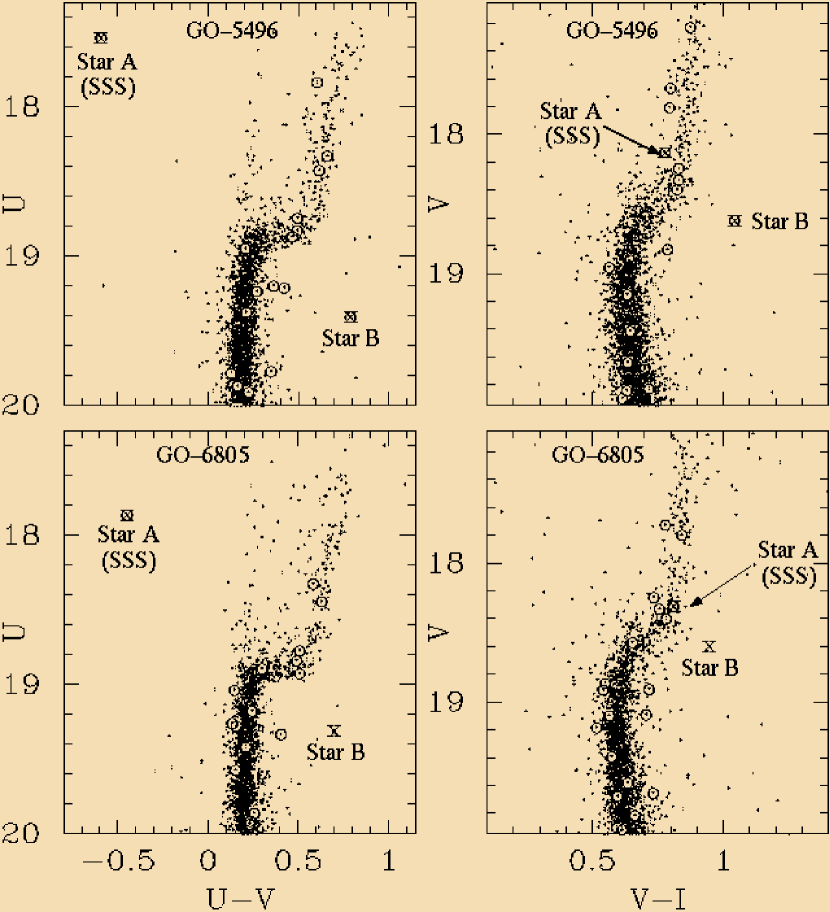
The resulting vs and vs CMDs are shown in Fig. 2. Stars within 15 of the nominal position of 1E 1339 are circled. The photometric scatter for these objects is slightly larger than average because the SSS is located in the most crowded region of the WF2 chip, the area closest to the center of M3. Only two of the circled objects clearly have unusual colors, and these stars (denoted Stars A and B) are labeled in each CMD. Star A is bright and has extremely blue colors in the vs CMD, but falls close to the subgiant branch ridgeline in the vs CMD (the photometry is given in Table 2). A comparison of the CMD position of Star A between the 1995 and 1998 epochs shows evidence for variability, since the star appears to be slightly fainter and redder in the 1998 dataset in both the vs and vs CMDs (the difference is less obvious with the redder color). This evidence for variability is confirmed by time series analysis given in § 2.2.
Star A is not a blue straggler because its colors in both epochs ( and ) are much bluer than the mean color of the blue straggler sequence (), and it lies on the subgiant branch in the vs CMD. This ‘blue excess’ in and secondary (subgiant) dominated luminosity in and is similar to that found for the CVs in NGC 6397 (Cool et al. 1998) and 47 Tuc (Edmonds et al. 2003), suggesting that 1E 1339 is also a CV. Extra support for this hypothesis is given in § 2.2. A key difference between this system and nearly all of the CVs found in 47 Tuc and NGC 6397 is that Star A includes a subgiant secondary, with ranging between 3.01 and 3.19. The one exception is AKO 9, the 1.16 day period CV in 47 Tuc (Edmonds et al. 2003).
Star B is located near the outer edge of the 2- error circle in the GO-5496 data, and just outside the 2- error circle in GO-6805. Its positions in the vs and vs CMDs suggest that the star is a luminous red giant that falls well behind the cluster. Therefore Star B is unlikely to be responsible for the supersoft X-ray emission.
2.2 Time Series
Figure 3 shows time series in F336W, F555W and F814W for Star A, with example time series for two stars with similar magnitudes, offset by 0.5 mag (for clarity). To derive errors, we analyzed the time series of 25 stars with magnitudes that are within several tenths of a magnitude of Star A. The 1- error bars plotted in Fig. 3 show the mean standard deviation for these 25 stars, with 3- deviations removed.
Star A is clearly variable. The standard deviations of the time series for Star A exceed the mean standard deviations of the 25 reference stars by factors of 9.8 (F336W), 4.3 (F555W) and 2.6 (F814W) for GO-5496, and by factors of 5.6 (F336W), 3.2 (F555W) and 3.0 (F814W) for GO-6805. We fit straight lines () to the data (where is in units of magnitudes and is in units of time measured in days) using least squares fitting (see Fig. 3). For the GO-6805 data we derived mag/day (2.8-; F336W), mag/day (4.7-; F555W), and mag/day (5.1-; F814W). None of the reference time series in any of the 3 filters had mag. Similar fits are shown for the GO-5496 data, although the short time series mean that the derived parameters are less useful.
After subtracting the fitted straight lines from the GO-6805 data, we found that the standard deviation of the F336W time series is still significantly larger than expected (4.9-), while the excesses for the F555W and F814W filters are only marginally significant (2.5- and 2.0- respectively). Clearly, the GO-6805 variability shows a drift over the 0.5 day observation added to variations at higher frequencies.
The slow variations shown in Fig. 3 may, in part, be ellipsoidal variations. These are expected for systems where the secondary is filling its Roche lobe, and should be detectable, given adequate signal-to-noise, in systems where the secondary dominates the light in particular filters (as the SSS does in and ). If the variations are ellipsoidal in origin, then their approximately linear nature shows we are observing no more than a quarter of the SSS’s orbital period. This implies that the orbital period of the SSS must be at least 2 days. Using the stellar evolution models of Bergbusch & Vandenberg (1992), Kepler’s third law and the Roche lobe equation of Paczyński (1971) we estimate that the period of the SSS should be just over 2 days (assuming that the star’s radius does not change significantly from its equilibrium value). Longer monitoring with HST could easily test for the expected periodic variations. Ground-based observations will require excellent seeing or adaptive optics because the SSS is only 09 away from a much brighter neighboring star111This saturated star is either a red giant or a horizontal branch star and is identified as the variable star V224, when using the finding chart of Bakos, Benko, & Jurcsik (2000). However, Corwin and Carney (2001) found no evidence for it being variable. A possible solution to this mystery is that the nearby SSS went through an outburst and its variability was then so extreme that it affected measurements of the nearby bright star..
Changes in the brightness of the accretion disk may also contribute to the slow variations. For example, some contribution from an accretion disk may be visible in the vs CMD for GO-5496, where the SSS is bluewards of the subgiant branch by 0.05–0.1 mag. Also, the magnitude differences between the GO-5496 and GO-6805 observations are probably caused by some difference in accretion luminosity. The shorter term variations are almost certainly flickering from the accretion disk.
3 Discussion
To summarize, the properties of Star A (blue color, variability, and the close astrometric match with the ROSAT position of the SSS) mean that it is almost certainly the optical counterpart of 1E 1339. The optical colors of the SSS are similar to those of the CVs in 47 Tuc and NGC 6397, suggesting that 1E 1339 may be a type of CV, consistent with the scenarios predicted by Hertz et al. (1993) and Dotani et al. (1999).
One popular scenario to allow the high mass transfer rates required for steady nuclear burning on the surface of the WD is for mass transfer to occur on a thermal timescale. This is believed to occur in binaries with a slightly evolved companion star that is more massive than the WD primary (Kahabka & van den Heuvel 1997). With a secondary mass for the SSS of no more than 0.9 M⊙ (less depending on how much mass has been lost), it should be easy to fulfill this requirement by normal stellar evolution in a primordial binary or an exchange collision between a primordial binary and a WD. WDs with masses of 0.55 M⊙ are currently being produced in the cluster (applying the initial-to-final mass relation of Weidemann 2000), and WDs with similar masses will be common. Therefore, our results are broadly consistent with expectations of high mass transfer rates to explain nuclear burning on the surface of the WD primary. However, a slightly evolved companion star with a mass between 1.3 and 2.5 M⊙ is ruled out by these observations, since the only globular cluster stars in this mass range (besides neutron stars) are blue stragglers.
A useful diagnostic for this system is the ratio. We used the 0.5-2.5 keV X-ray flux values of Dotani et al. (1999) from April and June 1995, and January 1997, and to derive =0.9–2.8. These large values are consistent with those found for magnetic (DQ Her) systems by Verbunt et al. (1997). We speculate that magnetic behavior might explain why only part of the WD surface appeared to undergo hydrogen burning in 1991/1992. It has already been argued that large numbers of magnetic CVs may be found in globular clusters (Grindlay et al. 1995 & Edmonds et al. 1999). We note that studies of field CVs have shown that some CVs can turn on as SSSs (Greiner et al. 1999 & Patterson et al. 1998), with luminosities ( erg s-1) that are lower than those of the original set of Milky Way and Magellanic Cloud SSSs. One of these, T Pyx, might be a magnetic CV (Patterson et al. 1998).
Chandra observations, led by C.O.H., will provide new constraints on the X-ray spectrum and variability of 1E 1339, and, with a larger sample of optically identified X-ray sources, should give us excellent (0.1-0.2”) relative astrometry between HST and Chandra. One dataset was obtained in November 2003 and two will follow in 2004. The second of these Chandra observations will be coordinated with optical and UV observations with HST/ACS in 2004. Spectroscopic studies of this relatively bright binary should be possible with HST/STIS, but will be a challenge for ground-based telescopes because of the nearby giant star.
References
- Bakos, Benko, & Jurcsik (2000) Bakos, G. A., Benko, J. M., & Jurcsik, J. 2000, Acta Astronomica, 50, 221
- Bergbusch & Vandenberg (1992) Bergbusch, P. A. & Vandenberg, D. A. 1992, ApJS, 81, 163
- Corwin & Carney (2001) Corwin, T. M. & Carney, B. W. 2001, AJ, 122, 3183
- Cool et al. (1998) Cool, A. M., Grindlay, J. E., Cohn, H. N., Lugger, P. M., & Bailyn, C. D. 1998, ApJ, 508, L75
- Djorgovski (1993) Djorgovski, S. 1993, ASP Conf. Ser. 50: Structure and Dynamics of Globular Clusters, 373
- Dotani, Asai, & Greiner (1999) Dotani, T., Asai, K., & Greiner, J. 1999, PASJ, 51, 519
- Edmonds et al. (1999) Edmonds, P. D., Grindlay, J. E., Cool, A., Cohn, H., Lugger, P., & Bailyn, C. 1999, ApJ, 516, 250
- Edmonds, Gilliland, Heinke, & Grindlay (2003) Edmonds, P. D., Gilliland, R. L., Heinke, C. O., & Grindlay, J. E. 2003, ApJ, 596, 1177
- Fruchter & Hook (2002) Fruchter, A. S. & Hook, R. N. 2002, PASP, 114, 144
- Geffert (1998) Geffert, M. 1998, A&A, 340, 305
- Greiner et al. (1999) Greiner, J., Tovmassian, G. H., Di Stefano, R., Prestwich, A., González-Riestra, R., Szentasko, L., & Chavarría, C. 1999, A&A, 343, 183
- Grindlay et al. (1995) Grindlay, J. E., Cool, A. M., Callanan, P. J., Bailyn, C. D., Cohn, H. N., & Lugger, P. M. 1995, ApJ, 455, L47
- Hertz & Grindlay (1983) Hertz, P. & Grindlay, J. E. 1983, ApJ, 275, 105
- Hertz, Grindlay, & Bailyn (1993) Hertz, P., Grindlay, J. E., & Bailyn, C. D. 1993, ApJ, 410, L87
- Holtzman et al. (1995) Holtzman, J. A., Burrows, C. J., Casertano, S., Hester, J. J., Trauger, J. T., Watson, A. M., & Worthey, G. 1995, PASP, 107, 1065
- Kahabka & van den Heuvel (1997) Kahabka, P. & van den Heuvel, E. P. J. 1997, ARA&A, 35, 69
- Kahabka & van den Heuvel (2003) Kahabka, P. & van den Heuvel, E. P. J. 2003, in Compact Stellar X-Ray Sources, eds. W. H. G. Lewin and M. van der Klis, Cambridge University Series (submitted)
- Paczyński (1971) Paczyński, B. 1971, ARA&A, 9, 183
- Patterson et al. (1998) Patterson, J. et al. 1998, PASP, 110, 380
- Verbunt, Bunk, Ritter, & Pfeffermann (1997) Verbunt, F., Bunk, W. H., Ritter, H., & Pfeffermann, E. 1997, A&A, 327, 602
- Verbunt (2001) Verbunt, F. 2001, A&A, 368, 137
- Weidemann (2000) Weidemann, V. 2000, A&A, 363, 647
| Dataset | Observation Date | Camera | Filters | Exposures |
|---|---|---|---|---|
| GO-5496 | 1995 April 25 | WFPC2 | F336W (‘’) | 4800 s |
| WFPC2 | F555W (‘’) | 4100 s | ||
| WFPC2 | F814W (‘’) | 4140 s | ||
| GO-6805 | 1998 May 14 | WFPC2 | F336W (‘’) | 16600 s |
| WFPC2 | F555W (‘’) | 2160 s | ||
| WFPC2 | F814W (‘’) | 16100 s |
| Dataset | RA | Dec | |||
|---|---|---|---|---|---|
| (J2000) | (J2000) | ||||
| GO-5496 | 13 42 09.6871aaCoordinates were derived using metric on HST image u2li0103t | 28 22 47.046 | 17.53(5) | 18.13(5) | 17.35(5) |
| GO-6805 | 13 42 09.7501bbCoordinates were derived using metric on HST image u4r00103r | 28 22 47.531 | 17.86(5) | 18.31(5) | 17.50(5) |
| ROSAT | 13 42 09.76ccCoordinates from Verbunt (2001) | 28 22 47.2 |