Ionized gas and stellar kinematics of seventeen nearby spiral galaxies ††thanks: Based on observations carried out at the European Southern Observatory, La Silla (Chile) (ESO 56.A-0684 and 57.A-0569)., ††thanks: Tables 3 and 4 are only available in electronic form at the CDS via anonymous ftp to cdsarc.u-strasbg.fr (130.79.128.5) or via http://cdsweb.u-strasbg.fr/Abstract.html.
Ionized gas and stellar kinematics have been measured along the major axes of seventeen nearby spiral galaxies of intermediate to late morphological type. We discuss the properties of each sample galaxy distinguishing between those characterized by regular or peculiar kinematics. In most of the observed galaxies ionized gas rotates more rapidly than stars and have a lower velocity dispersion, as is to be expected if the gas is confined in the disc and supported by rotation while the stars are mostly supported by dynamical pressure. In a few objects, gas and stars show almost the same rotational velocity and low velocity dispersion, suggesting that their motion is dominated by rotation. Incorporating the spiral galaxies studied by Bertola et al. (1996), Corsini et al. (1999, 2003) and Vega Beltrán et al. (2001) we have compiled a sample of 50 S0/a–Scd galaxies, for which the major-axis kinematics of the ionized gas and stars have been obtained with the same spatial () and spectral ( ) resolution, and measured with the same analysis techniques. This allowed us to address the frequency of counterrotation in spiral galaxies. It turns out that less than and less than (at the confidence level) of the sample galaxies host a counterrotating gaseous and stellar disc, respectively. The comparison with S0 galaxies suggests that the retrograde acquisition of small amounts of external gas gives rise to counterrotating gaseous discs only in gas-poor S0s, while in gas-rich spirals the newly acquired gas is swept away by the pre-existing gas. Counterrotating gaseous and stellar discs in spirals are formed only from the retrograde acquisition of large amounts of gas exceeding that of pre-existing gas, and subsequent star formation, respectively.
Key Words.:
galaxies: kinematics and dynamics – galaxies: spiral – galaxies: structure1 Introduction
Studying the interplay between ionized gas and stellar kinematics allows us to address different topics concerning the dynamical structure of disc galaxies and to constrain the processes leading to their formation and evolution. These topics include the study of the mass distribution of luminous and dark matter (see Sofue & Rubin 2001 for a review), the ubiquity of supermassive black holes and their relationship with the large-scale properties of the host galaxies (see Merritt & Ferrarese 2001 for a review), the discovery of kinematically decoupled components (see Bertola & Corsini 1999 for a review), the origin of disc heating (Merrifield, Gerssen & Kuijken 2001 and references therein), and the presence of pressure-supported ionized gas in bulges (Bertola et al. 1995; Cinzano et al. 1999).
All these issues will greatly benefit from a survey devoted to the comparative measurements of ionized gas and stellar kinematics in S0s and spiral galaxies. Since these are available only for a limited number of objects, in the past years we began a scientific programme aimed at deriving detailed velocity curves and velocity dispersion radial profiles of ionized gas and stars along the major axes of disc galaxies (Bertola et al. 1995, 1996; Corsini et al. 1999, 2003; Vega Beltrán et al. 2001; Funes et al. 2002) to be used for mass modelling (Corsini et al. 1999; Cinzano et al. 1999; Pignatelli et al. 2001).
This paper is organized as follows. An overview of the properties of the sample galaxies as well as the spectroscopic observations and data analysis are presented in Section 2. The resulting ionized gas and stellar kinematics are given and interpreted in Section 3. In particular, we derived the central velocity dispersion of stars of all the sample galaxies with the aim of studying the relationship between that the disc circular velocity and bulge velocity dispersion (Ferrarese 2002; Baes et al. 2003) in a forthcoming paper (but see also Pizzella et al. 2003). The fraction of spiral galaxies hosting a counterrotating component is estimated in Section 4 by analysing the major-axis kinematics of all the spiral galaxies we have observed in recent years. Our conclusions are discussed in Section 5.
| Object | Type | PA | Scale | |||||||||
|---|---|---|---|---|---|---|---|---|---|---|---|---|
| [stars] | [gas] | |||||||||||
| [name] | [RSA] | [RC3] | [mag] | [°] | [°] | [] | [Mpc] | [pc] | [′′] | [mag] | ||
| (1) | (2) | (3) | (4) | (5) | (6) | (7) | (8) | (9) | (10) | (11) | (12) | (13) |
| NGC 210 | Sb(rs) | SABb(s) | 11.60 | 165 | 49 | 1650 | 23.2 | 113 | 150 | 0.3 | 0.8 | |
| NGC 615 | Sb(r) | SAb(rs) | 12.47 | 155 | 67 | 1849 | 25.7 | 125 | 108 | 0.7 | 0.9 | |
| NGC 1620 | — | SABbc(rs) | 13.08 | 25 | 70 | 3509 | 46.1 | 224 | 86 | 0.7 | 1.2 | |
| NGC 2590 | — | SAbc(s): | 13.94 | 77 | 72 | 4960 | 63.4 | 308 | 67 | 0.5 | 1.0 | |
| NGC 2708 | — | SABb(s)pec? | 12.80 | 25 | 60 | 1984 | 23.5 | 114 | 78 | 0.6 | 0.8 | |
| NGC 2815 | Sb(s) | SBb(r): | 12.81 | 10 | 72 | 2535 | 30.0 | 145 | 104 | 0.4 | 1.0 | |
| NGC 3054 | SBbc(s) | SABb(r) | 12.35 | 118 | 52 | 2430 | 28.5 | 138 | 114 | 0.5 | 0.9 | |
| NGC 3200 | Sb(r) | SABc(rs): | 12.83 | 169 | 73 | 3526 | 43.4 | 211 | 125 | 0.5 | 0.9 | |
| NGC 3717 | Sb(s) | SAb:sp | 12.24 | 33 | 81 | 1748 | 19.6 | 95 | 180 | 0.4 | 0.5 | |
| NGC 4682 | Sc(s) | SABcd(s) | 13.14 | 83 | 61 | 2344 | 28.8 | 140 | 77 | 0.3 | 0.8 | |
| NGC 5530 | Sc(s) | SAbc(rs) | 11.79 | 127 | 62 | 1092 | 11.7 | 57 | 125 | 0.6 | 0.9 | |
| NGC 6118 | Sc(s) | SAcd(s) | 12.42 | 58 | 65 | 1580 | 21.4 | 104 | 140 | 0.6 | 0.8 | |
| NGC 6878 | Sc(r) | SAb(s) | 13.45 | 125 | 40 | 5821 | 77.3 | 375 | 48 | 0.6 | 1.0 | |
| NGC 6925 | Sbc(r) | SAbc(s) | 12.07 | 5 | 75 | 2783 | 37.7 | 183 | 134 | 0.6 | 0.9 | |
| NGC 7083 | Sb(s) | SAbc(s) | 11.87 | 5 | 53 | 3093 | 39.7 | 192 | 116 | 0.5 | 1.0 | |
| NGC 7412 | Sc(rs) | SBc(s) | 11.88 | 65 | 42 | 1712 | 22.7 | 110 | 116 | 0.4 | 0.8 | |
| NGC 7531 | Sbc(r) | SABbc(r) | 12.04 | 15 | 67 | 1591 | 20.9 | 102 | 134 | 0.4 | 0.6 | |
NOTES – (2)Morphological classification from Sandage & Tammann (1981, RSA hereafter). (3)Morphological classification from RC3. (4)Total observed blue magnitude from RC3 except for NGC 3954, NGC 4682 and NGC 5530 (LEDA). (5)Major-axis position angle from RC3. (6)Inclination, derived as . The observed axial ratio is taken from RC3 and the intrinsic flattening has been assumed following Guthrie (1992). (7)Heliocentric velocity of the galaxy derived at the centre of symmetry of the rotation curve of the gas. . (8)Distance obtained as with Mpc-1 and , the systemic velocity derived from corrected for the motion of the Sun with respect to the Local Group, as in RSA. (10)Radius of the 25 mag arcsec-2 isophote derived as with from RC3. (11)Absolute total blue magnitude corrected for inclination and extinction from RC3. (12)Radial extension of the stellar rotation curve in units of from this paper. (13)Radial extension of the ionized gas rotation curve in units of from this paper.
2 Sample selection, spectroscopic observations and data reduction
2.1 Sample selection
All the observed galaxies are bright () and nearby ( ) with an intermediate-to-high inclination (). The Hubble morphological type of the sample galaxies ranges from Sb to Scd (de Vaucouleurs et al. 1991, RC3 hereafter) with eight unbarred, seven weakly barred and two strongly barred galaxies (RC3). The galaxies have been chosen for their strong emission lines. An overview of the basic properties of the sample galaxies is given in Table 1. The distribution of their absolute magnitudes, which brackets the M∗ value for spiral galaxies (Marzke et al. 1998, for ) is shown in Figure 1.

2.2 Spectroscopic observations
The spectroscopic observations of our sample galaxies were carried out at the ESO in La Silla with the 1.52 m ESO telescope on 1996 January 22–27 (run 1 hereafter), and on 1996 August 9–14 (run 2 hereafter).
The telescope mounted the Boller & Chievens Spectrograph. The grism No. 26 with 1200 blazed at 5730 Å was used in the first order in combination with the slit and the Loral CCD No. 24 with pixels of . The wavelength range between 4940 Å and 6940 Å was covered with a reciprocal dispersion of 0.98 Å pixel-1, which guarantees adequate oversampling of the instrumental broadening function. Indeed, the instrumental resolution, obtained by measuring the width of emission lines of a comparison spectrum after the wavelength calibration, was Å (FWHM). This corresponds to an instrumental velocity dispersion of Å (i.e. and at the blue and red edges of the spectra, respectively). The angular sampling was pixel-1.
At the beginning of each exposure, the slit was centred on the galaxy nucleus using the guiding TV camera and aligned along the galaxy major axis. Details of the slit position and spectra exposure times are given in Table 2. Comparison lamp exposures were obtained before and/or after each object integration to allow an accurate wavelength calibration. Quartz lamp and twilight sky flat-fields were used to map pixel-to-pixel sensitivity variations and large scale illumination patterns. A dozen of late G and early K stars were observed with the same set up to serve as templates in measuring the stellar kinematics. The value of the seeing FWHM during the different observing runs ranged between and , as measured by fitting a two-dimensional Gaussian to the guide star.
| Object | Run | texp | P.A. |
|---|---|---|---|
| [name] | [s] | [∘] | |
| NGC 210 | 2 | 160 | |
| NGC 615 | 2 | 155 | |
| NGC 1620 | 1 | 25 | |
| NGC 2590 | 1 | 77 | |
| NGC 2708 | 1 | 20 | |
| NGC 2815 | 1 | 10 | |
| NGC 3054 | 1 | 118 | |
| NGC 3200 | 1 | 169 | |
| NGC 3717 | 1 | 33 | |
| NGC 4682 | 1 | 85 | |
| NGC 5530 | 2 | 127 | |
| NGC 6118 | 2 | 58 | |
| NGC 6878 | 2 | 125 | |
| NGC 6925 | 2 | 5 | |
| NGC 7083 | 2 | 5 | |
| NGC 7412 | 2 | 65 | |
| NGC 7531 | 2 | 15 |
2.3 Routine data reduction
The spectra were bias subtracted, flat-field corrected, cleaned for cosmic rays and wavelength calibrated using standard MIDAS111MIDAS is developed and maintained by the European Southern Observatory. routines. Cosmic rays were identified by comparing the counts in each pixel with the local mean and standard deviation (as obtained from the Poisson statistics of the photons knowing the gain and readout noise of the detector), and then corrected by interpolating a suitable value. In the central regions (typically for ) cosmic rays have been removed by manually editing the spectra.
The instrumental resolution as a function of wavelength was derived as the Gaussian FWHMs measured for several unblended arc lamp lines distributed over the whole spectral range of a wavelength-calibrated comparison spectrum. Finally, the spectra of the same galaxy were aligned and co-added using the centers of their stellar continua as reference. In the resulting spectra, the contribution from the sky was determined by interpolating along the outermost – at the edges of the slit, where galaxy light was negligible. The sky level was then subtracted. Since the spatial extension of the emission lines can exceed that of the stellar continuum, different ranges for sky subtraction have been considered in ionized gas and stellar kinematic measurements. In few cases the galaxy emission lines extended through the whole slit length. The sky level was derived by scaling the sky frame derived for a different galaxy to match the intensity of the relevant night sky emission lines.
2.4 Measuring ionized gas and stellar kinematics
The ionized gas kinematics was measured by the simultaneous Gaussian fit of the emission lines present in the spectra (namely [N II], H, and [S II]). The galaxy continuum was removed from the spectra, as was done for measuring the stellar kinematics. We fitted a Gaussian to each emission line in each row of the continuum-subtracted spectrum, assuming them to have the same line-of-sight velocity (), and velocity dispersion (). Velocities and velocity dispersions were corrected for heliocentric velocity and instrumental FWHM, respectively. An additional absorption Gaussian was added to the fit to take into account for the presence of the H absorption line and the flux ratio of the [N II] lines have been fixed at 1:3. Far from the galaxy centre (for ) we averaged adjacent spectral rows in order to increase the signal-to-noise ratio of the relevant emission lines. We checked for a few galaxies that the error in the kinematic parameter determination derived by means of Monte Carlo simulations did not differ significantly from the formal errors given as output by the least-squares fitting routine. We therefore decided to assume the latter as error bars on the gas kinematics. For each galaxy we derive the heliocentric systemic velocity, , as the velocity of the centre of symmetry of the ionized gas rotation curve (Table 1).
The stellar kinematics were measured from the galaxy absorption features present in the wavelength range running from 5050 Å to 5550 Å and centred on the Mg line triplet ( Å). We used the Fourier correlation quotient method (FCQ, Bender 1990) following the prescriptions of Bender, Saglia & Gerhard (1994). The spectra were binned along the spatial direction to obtain a nearly constant signal-to-noise ratio larger than 20 per resolution element. The galaxy continuum was removed row by row by fitting a fourth to sixth order polynomial as in Bender et al. (1994). The K1 III star HR 5777 was adopted as a kinematic template. This allowed us to derive, for each spectrum, the line-of-sight stellar velocity (), and velocity dispersion () by fitting a Gaussian to the line-of-sight velocity distribution (LOSVD) at each radius. Velocities were corrected for heliocentric velocity. We derived errors for the stellar kinematics from photon statistics and CCD read-out noise, calibrating them by Monte Carlo simulations as done by Gerhard et al. (1998). These errors do not take into account possible systematic effects due to any template mismatch.
The ionized gas and stellar kinematics of all the sample galaxies are tabulated in Tables 3 and 4, respectively, and plotted in Figure 2.
3 The ionized gas and stellar kinematics
3.1 Velocity curves and velocity dispersion profiles of ionized gas and stars
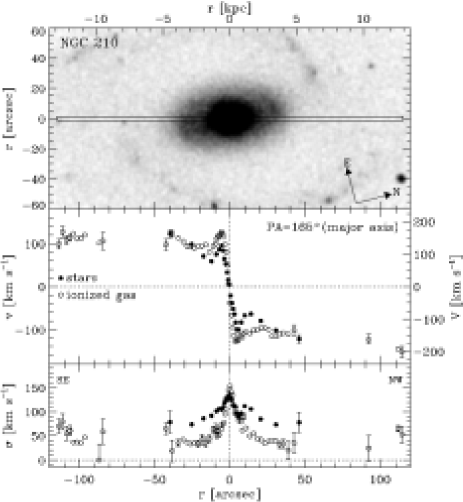
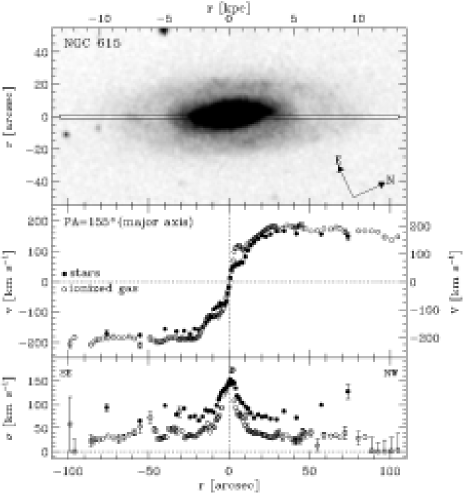
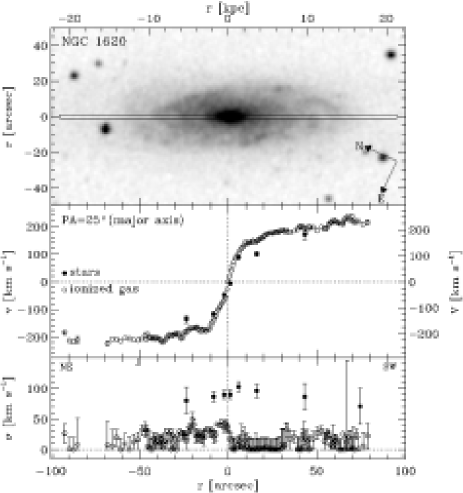
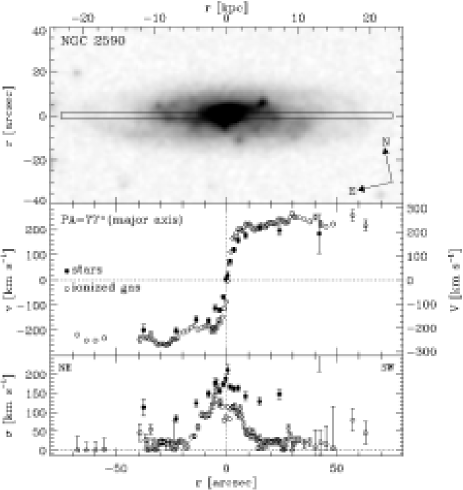
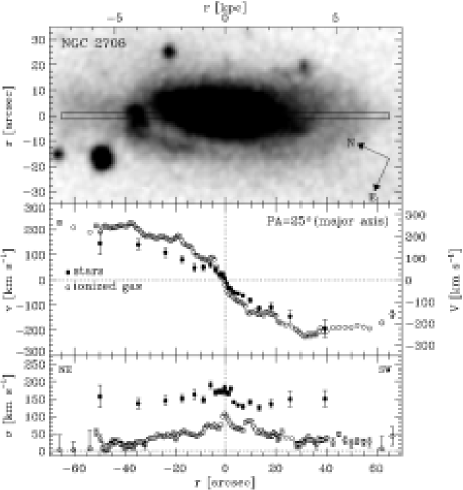
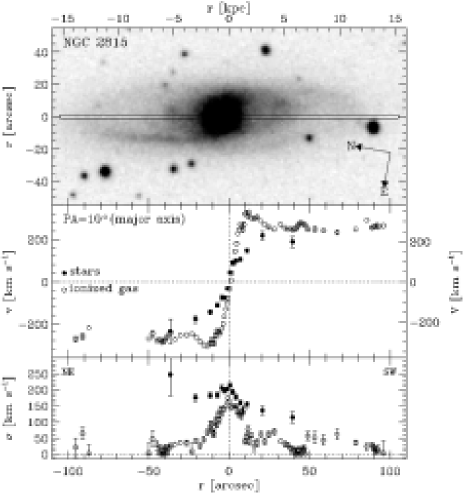
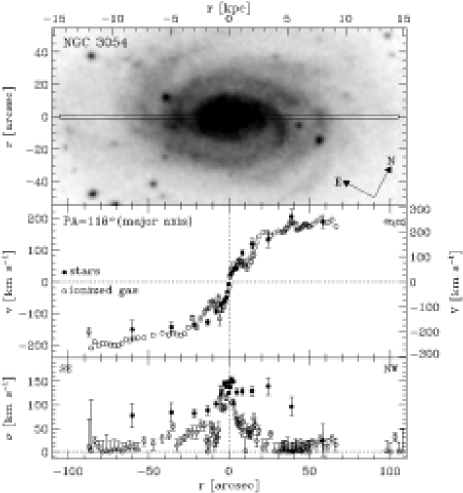
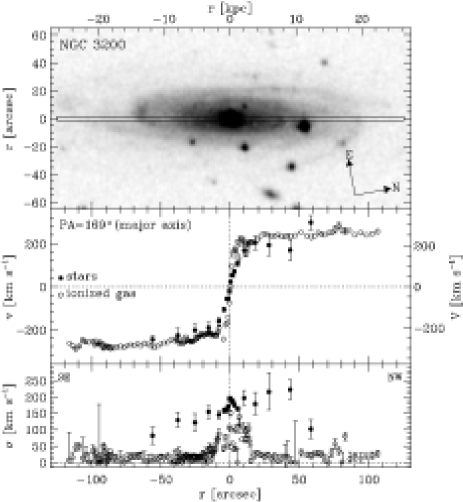
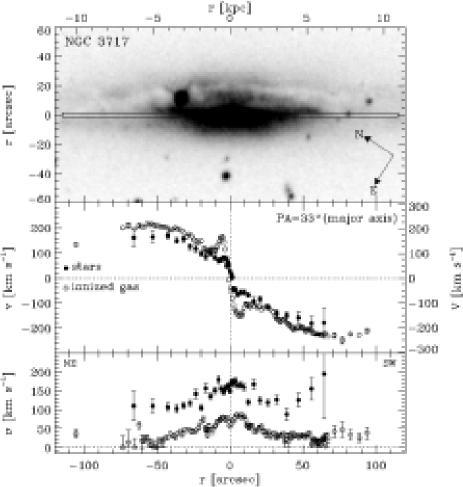
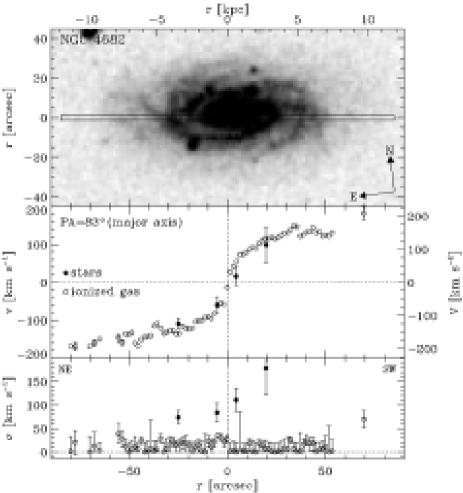
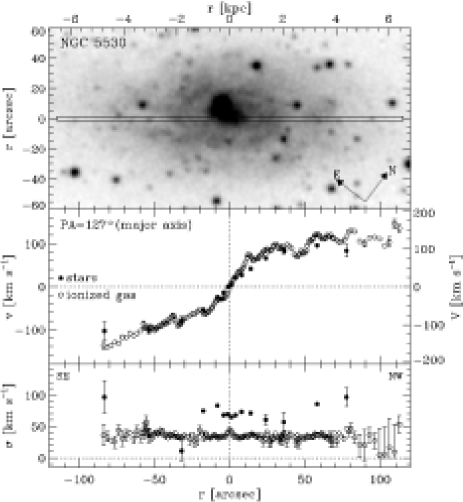
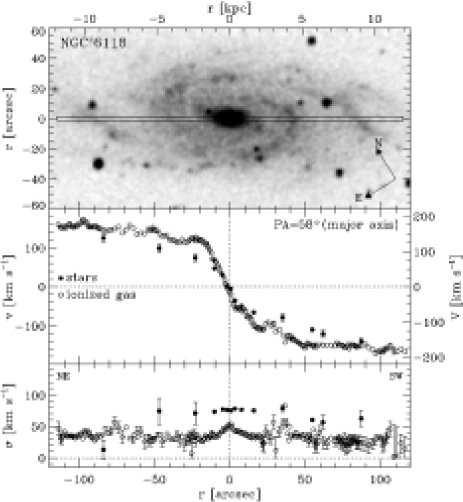
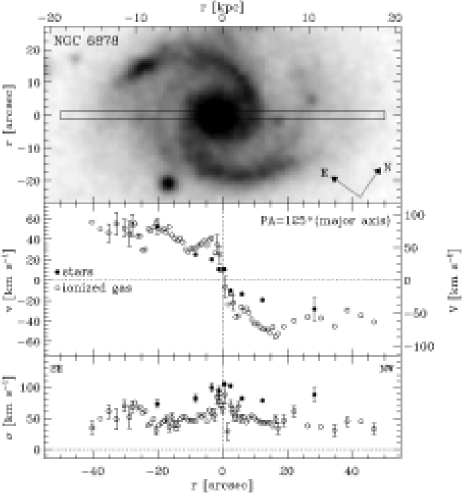
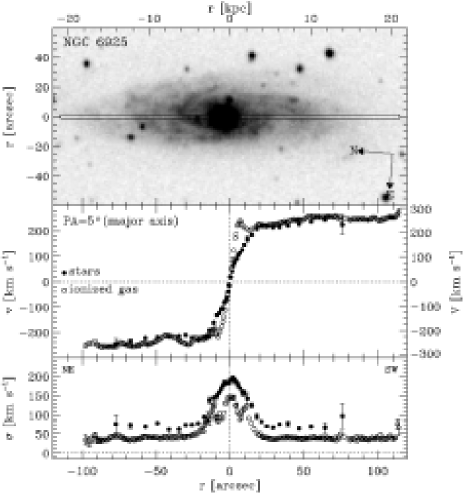
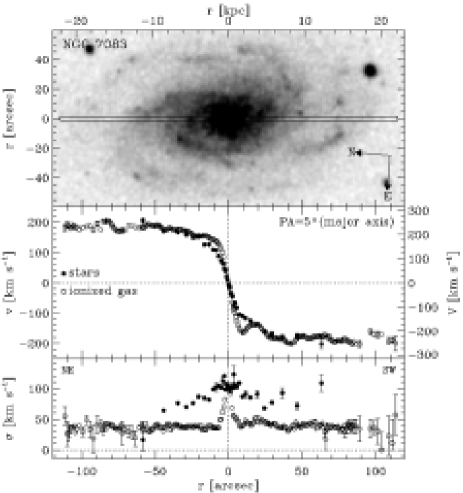
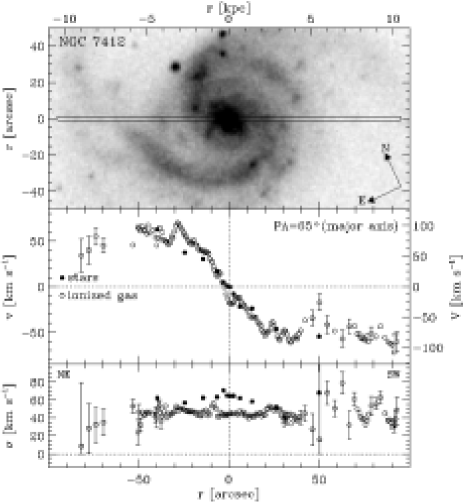
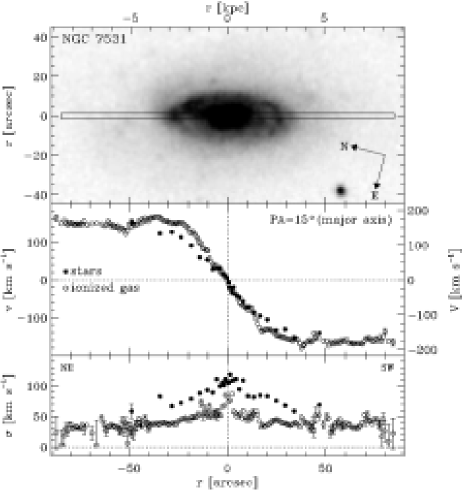
The resulting ionized gas and stellar kinematics of all our sample galaxies are shown in Figure 2. For each object the plot is organized as it follows:
-
1.
In the upper panel we display the galaxy image obtained from the Digitized Sky Survey. The galaxy image has been rotated and the slit position has been plotted to allow a better comparison between morphological and kinematic properties. The slit width and length correspond to those adopted in obtaining the spectra.
-
2.
In the middle panel we plot the velocity curves of the gaseous (open circles) and stellar (filled circles) components. The velocity scale on the left of the plot indicates the observed velocity after subtraction of the systemic velocity given in Table 1. The velocity scale on the right indicates the rotation velocity after the deprojection for the galaxy inclination given in Table 1. Error bars are not plotted when smaller than symbols. The position angle of the slit is specified.
-
3.
In the lower panel we plot in radial profiles the velocity dispersion of the gaseous (open circles) and stellar (filled circles) components. Error bars are not plotted when smaller than their symbols.
The kinematic measurements obtained for the sample galaxies extend typically to for the gaseous and for the stellar component. The curves are generally regular and symmetric about the centre.
3.2 Comparison with the literature
The ionized gas and/or stellar kinematics of some of the sample galaxies have been measured by other authors. We used these data sets to assess the accuracy and reliability of our measurements. In most cases differences between different authors are due to slit centring and/or positioning, different analysis techniques, or both (see Fisher 1997 for a discussion).
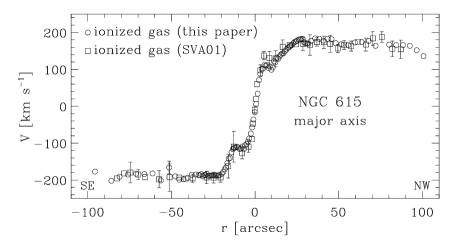
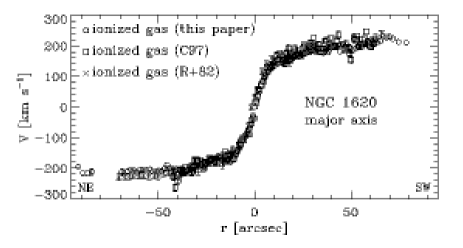
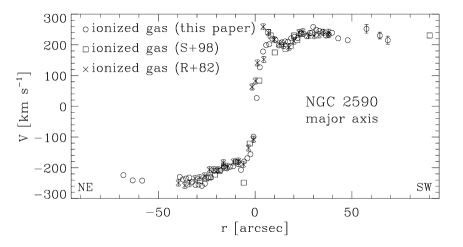
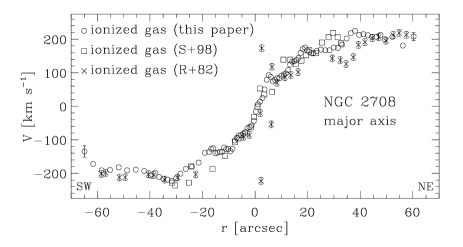
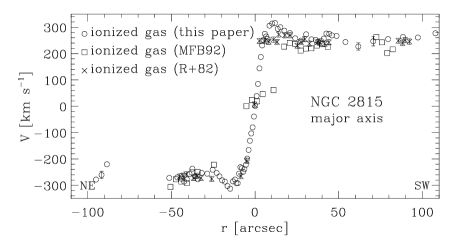
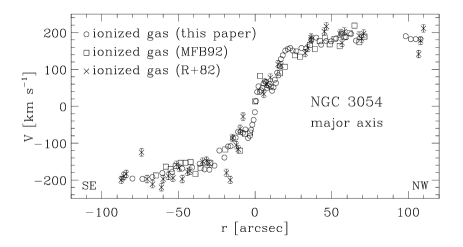
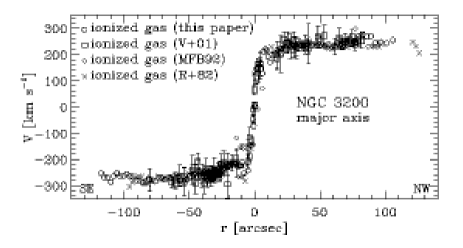
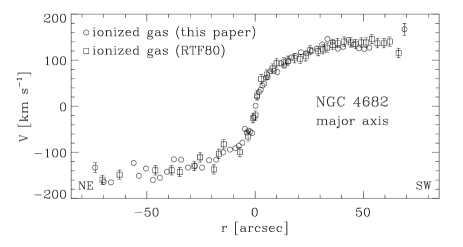
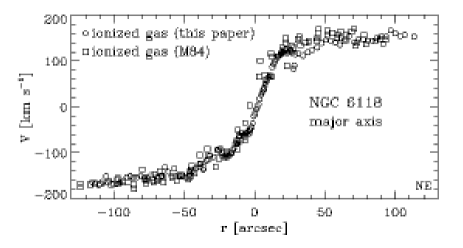
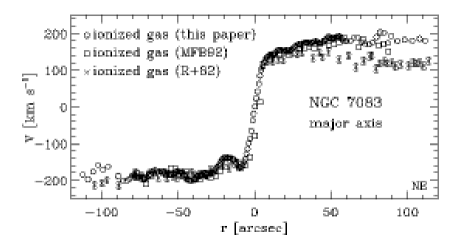
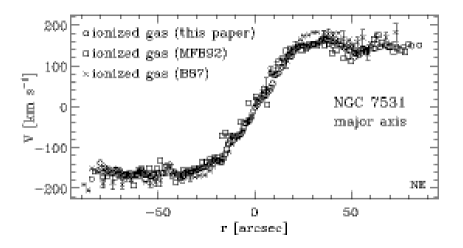
Ionized gas velocity curves have been already measured along the major axes of NGC 615, NGC 1620, NGC 2708, NGC 2815, NGC 3054, NGC 3200, NGC 4682, NGC 6118, NGC 7083 and NGC 7531. However, these measurements had previously been obtained with a lower spatial and/or velocity resolution with respect to ours. In Figure 3 we plot our kinematic measurements compared to the available data. The agreement is good and the discrepancies ( ) are due to the different spatial sampling and accuracy of velocity measurements. Only in the case of NGC 7083 do we notice a systematic difference ( ) on the north-east side of the rotation curve between our data and those of Rubin et al. (1982). We attribute such a discrepancy to the wavelength calibration of Rubin et al. (1982) since it is not present when we consider the data of Mathewson, Ford & Buchhorn (1992).
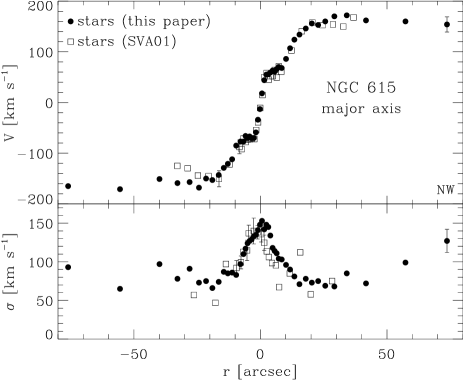
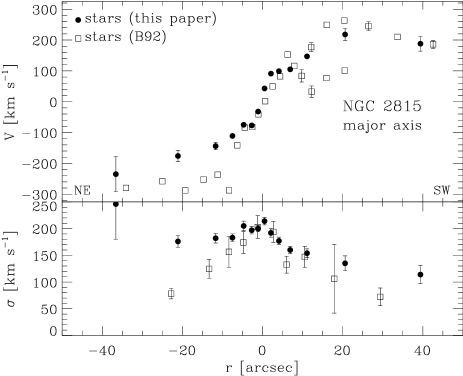
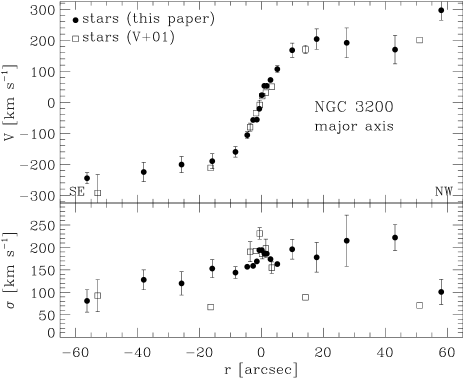
In Fig. 4 we compared our kinematic measurements for the stellar component of NGC 615, NGC 2815 and NGC 3200 to the data derived by Bottema (1992), Sil’chenko, Vlasyuk & Alvarado (2001) and Vega Beltrán et al. (2001), respectively. The overall agreement is good both for velocities and velocity dispersions, except for NGC 2815. Indeed, we measured on the south-east side of this galaxy lower rotation velocities and higher velocity dispersions with respect to those of Bottema (1992).
3.3 The central velocity dispersion of stars
A tight correlation between the central velocity dispersion of the spheroid and the galaxy circular velocity has recently been found for a sample of elliptical and spiral galaxies (Ferrarese 2002; Baes et al. 2003). Since the bulge velocity dispersion and circular velocity are related to the masses of the central black hole (Ferrarese & Merritt 2000; Gebhardt et al. 2000) and dark matter halo (e.g. Bullock et al. 2001), respectively, the correlation between velocity dispersion and circular velocity is equivalent to unity between the mass of the black hole and the mass of the dark halo (Ferrarese 2002).
With the aim of exploring this correlation in a forthcoming paper (Pizzella et al. 2004, in preparation, but see also Pizzella et al. 2003), we tested how the central stellar velocity dispersion depends on the radius of the aperture in which it has been measured. Indeed when comparing the values of to those derived by other authors it is necessary to take this effect into account. Ferrarese (2002) took as reference aperture that corresponding to where is the effective radius of the bulge, and adopted the aperture correction by Jorgensen, Franx & Kjaergaard (1995).
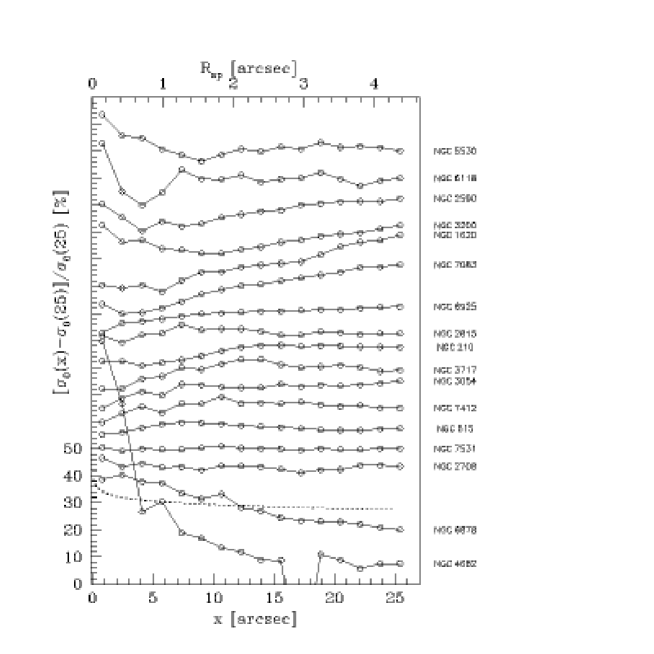
To test the reliability this correction when applied to spiral galaxies, we measured the value of for each sample galaxy in different radial bins obtained by averaging the central 1, 3, …, 31 rows of the spectrum (corresponding to , , …, and , respectively). In Figure 5 the resulting profiles of as a function of the radius of the circularized aperture are compared to that obtained for a galaxy with and by applying the aperture correction by Jorgensen et al. (1995). These are typical values for the central velocity dispersions and the bulge effective radii of our sample galaxies (Baggett, Baggett & Anderson 1998).
It turns out that in most of cases the observed profile is not centrally peaked and is nearly constant or even rising for large-aperture radii. This suggests that the empirical correction by Jorgensen et al. (1995), which was originally proposed for elliptical galaxies with centrally peaked velocity dispersions but negligible rotation velocities, is no longer valid for our late-type spiral galaxies. In this case the slit aperture is positioned along the galaxy major axis; therefore, the contribution of the rotation velocity (which remains spatially unresolved after the binning process) to the measured velocity dispersion increases with radius. The contribution of the rotation velocity makes the actual orientation of the slit is a critical parameter when the aperture correction is applied.
We therefore decided to not apply any aperture correction to the measured value of . However, as shown in Figure 5, there is no strong dependence of on aperture for all the sample galaxies, except for NGC 4682. This peculiar behaviour is due to the low signal-to-noise ratio () for the innermost two radial bins.
3.4 Interplay between kinematics of ionized gas and stars
Building a complete dynamical model to address the question of the mass distribution of the sample galaxies is beyond the scope of this paper. However, it is possible to derive some hints about their structure directly from the analysis of the interplay between the kinematics of their gas and stars. At each radius, () and () are the observed rotational velocities of the stars and the ionized gas, respectively. Following Vega Beltrán et al. (2001), we distinguished two classes in the sample galaxies, according to their kinematics and assuming that the gaseous and stellar discs are coplanar:
(i) Galaxies in which ionized gas rotates faster than stars and has a lower velocity dispersion than the stars (i.e., and ): NGC 210, NGC 615, NGC 1620, NGC 2590, NGC 2708 (although it has asymmetric rotation curves for both gas and stars), NGC 2815, NGC 3200, NGC 3717, NGC 6118, NGC 6878, NGC 6895 and NGC 7083. The different kinematic behaviour of the gaseous and stellar components can be explained by a model where the gas is confined in the disc and supported by rotation, while the stars are mostly supported by dynamical pressure. This is consistent with the application of the asymmetric drift (e.g. Binney & Tremaine 1987).
(ii) Galaxies for which and : NGC 4682, NGC 5530 and NGC 7412. The observed difference between the velocity dispersion of the two components is . The motions of both ionized gas and stars are dominated by rotation.
The weakly barred spirals NGC 3054 and NGC 7531 show peculiar kinematics that are unexpected if the gas is moving in circular orbits in a disc coplanar to the stellar one. In fact, in NGC 3054 and for , and and at larger radii, while NGC 7531 has intermediate properties between the two classes. It is characterized by and for , and and for . These cases cannot be explained without invoking a warp in the gaseous disc or non-circular gas motions.
4 The frequency of counterrotation in spiral galaxies
4.1 Detectability of counterrotation
The presence of counterrotation in disc galaxies is generally interpreted as the signature of the external origin of the gaseous component (Bertola, Buson & Zeilinger 1992). Since we are going to discuss the frequency of counterrotation in disc galaxies, it is necessary to establish our capability of detecting a counterrotating component when it is present.
In order to estimate the frequency of counterrotating components we considered the sample of spiral galaxies obtained from Bertola et al. (1996; one Sa galaxy), Corsini et al. (1999; six Sa galaxies), Vega-Beltrán et al. (2001; sixteen Sa–Scd galaxies. NGC 224 and NGC 3031 have been excluded from this analysis since the available kinematic data do not extend to the disc region), Corsini et al. (2003; ten S0/a–Sa galaxies), and this paper (seventeen Sb–Sc galaxies). The sample consists of 50 spiral galaxies (), with apparent magnitude , inclination and systemic velocity . Their major-axis ionized gas and stellar kinematics have been obtained with the same spatial (FWHM ) and spectral ( ) resolution, and measured with the same analysis technique. These 50 spiral galaxies represent our qualified sample, for which we are confident that we are able to detect any counterrotating or kinematically decoupled gaseous and/or stellar component.
Revealing the presence of ionized gas that is counterrotating with respect to the stellar component is straightforward. Indeed in most a cases visual inspection of the shape and orientation of spectral emission and absorption lines enables us to detect when the gas and stars are rotating opposite directions (e.g. NGC 4450; Rubin, Graham & Kenney 1992). The techniques we adopted to derive the gaseous and stellar kinematics allowed us to measure differences of a few in the rotation velocities of the two components. We are therefore confident that we are able to detect all the counterrotating gaseous components hosted in our sample galaxies.
Disentangling a counterrotating stellar component is a more difficult task. In fact, the kinematics of two counterrotating stellar populations is measured from the same absorption features and depends on the dynamical status of the components, as well as on the spectral resolution of the available data. We estimated the upper limit on the fraction of counterrotating stars we can detect assuming that the counterrotating components are discs with the same scale length and different luminosity as follows. We assumed the stars in the disc of NGC 615 as the prograde component of the model. We selected the spectrum of NGC 615 since the absorption lines in the wavelength and radial ranges where we are going to measure the stellar kinematics are nearly symmetric with respect to the centre, have a large radial extension and are characterized by a high signal to noise ( per Å for , and per Å for ). We obtained the retrograde component of model by flipping the spectrum of NGC 615 about the centre of the slit. This corresponds to inverting all the line-of-sight velocities of the prograde component with respect to the systemic velocity of the galaxy. We built a series of synthetic spectra with a different fraction of counterrotating stars (, , …, ) by means of a linear superposition of the prograde and retrograde models. The retrograde model has been divided by its own continuum and then multiplied by the continuum of the prograde model to remove asymmetries in the continuum shape on the two sides of the galaxy disc. We measured the stellar kinematics in the disc-dominated region and derived the radial profile of LOSVD of the synthetic spectra by applying the FCQ method as described in Section 2.4. We recognized the signature of the presence of two counterrotating components, namely the splitting of the LOSVD into two peaks, for . We assume this value to be our limiting sensitivity for the detection of counterrotating stars in the galaxy disc. We did not consider the bulge-dominated region, where disentangling the fraction of counterrotating stars requires further constraints on the dynamical status of the bulge. We conclude that no more than of the stars in the disc of our sample galaxies reside in retrograde orbits.
A similar analysis has been done by Kuijken, Fisher & Merrifield (1996) who found an upper limit of on counterrotating stars. We attribute this difference to the fact that they created the prograde and retrograde models by convolving the spectrum of a kinematic template with the appropriate LOSVD while we adopted a real (and therefore more noisy) spectrum. It has to be noted that this is a limit on the relative surface brightness of the prograde and retrograde component. If the retrograde component is more radially concentrated than the prograde one (e.g. NGC 3593; Bertola et al. 1996), it could be detected even if its luminosity is less than of the galaxy luminosity.
4.2 Fraction of disc galaxies hosting a counterrotating gas component
We found that ionized gas is counterrotating with respect to stars in 2 out 50 galaxies. They are the Sa NGC 3593 (Bertola et al. 1996) and S0/Sa NGC 7377 (Corsini et al. 2003), which corresponds to a frequency of . Applying Poisson distribution statistics, this means that less than (at the confidence level) of the sample galaxies have a counterrotating gaseous component. Only a few other spirals are known to host a counterrotating gaseous disc (NGC 3626, Ciri, Bettoni & Galletta 1996; Haynes et al. 2000; NGC 4138, Jore, Broeils & Haynes 1996; Haynes et al. 2000; NGC 7217, Merrifield & Kuijken 1994) or a kinematically decoupled gas component (NGC 5854, Haynes et al. 2000; and the spirals hosting an inner polar disc listed by Corsini et al. 2003).
For comparison, a similar analysis can be done for the lenticular galaxies. Combining the data of Bertola et al. (1992, 1995), Kuijken et al. (1996), and Kannappan & Fabricant (2001) with those for the S0 NGC 980 of Vega Beltrán et al. (2001), we obtained a sample of 53 S0 galaxies for which the kinematics of the ionized gas and stellar components have been measured along (at least) the major axis. A counterrotating or kinematically decoupled gaseous component has been found found in seventeen of these galaxies. We also took into account the galaxies whose ionized gas angular momentum is misaligned with respect to that of the stellar component since we aimed at deriving the fraction of S0 galaxies hosting a gaseous component of external origin. This fraction corresponds to (at the confidence level) from Poisson distribution statistics and is consistent with previous results by Bertola et al. (1992), Kuijken et al. (1996) and Kannappan & Fabricant (2001).
4.3 Fraction of disc galaxies hosting a counterrotating stellar component
In our qualified sample of 50 spiral galaxies we found the presence of a counterrotating stellar disc in the Sa NGC 3593 (Bertola et al. 1996). Applying Poisson distribution statistics this means that less that (at the confidence level) of the sample galaxies have a counterrotating stellar component. Only two other spirals are known to host two counterrotating stellar discs, one of these is corotating with the gaseous disc as observed in NGC 3593. They are the Sa NGC 4138 (Jore et al. 1996; Haynes et al. 2000) and the Sab NGC 7217 (Merrifield & Kuijken 1994). A kinematically decoupled stellar component orthogonally rotating with respect to the galaxy disc, has been observed in the bulge of the early-type spirals NGC 4698 (Corsini et al. 1999; Bertola et al. 1999) and NGC 4672 (Sarzi et al. 2000).
Kuijken et al. (1996) estimated that less than (at the confidence level) of their S0 galaxies host a significant fraction of counterrotating stars. This is actually the case for NGC 4550 (Rubin et al. 1992; Rix et al. 1992) where half of the disc stars are moving in retrograde orbits.
5 Summary and conclusions
We have measured the ionized gas and stellar kinematics along the major axes of seventeen intermediate- to late-type spiral galaxies. The rotation curves and velocity dispersion profiles of ionized gas and star typically extend out to and , respectively.
In most of cases the different kinematic behaviour of ionized gas and stars can be easily explained if gas is confined in the disc and supported by rotation while the stars belong mostly to the bulge and are supported by dynamical pressure. However, kinematic peculiarities have been observed at least in NGC 3054 and NGC 7531.
In addition, we discussed the frequency of counterrotation in disc galaxies. We considered our seventeen spiral galaxies with those studied in previous papers (Bertola et al. 1996; Corsini et al. 1999, 2003; Vega Beltrán et al. 2001) to build a qualified sample of 50 bright and nearby spirals, ranging from S0/a to Scd, for which the ionized gas and stellar kinematics have been measured along the major axis with the same analytical technique. We found that less than and less than (at the confidence level) of these galaxies host a counterrotating gaseous and stellar disc, respectively. For comparison, we found that of S0s host a counterrotating gaseous disc, and Kuijken et al. (1996) estimated that less than (at confidence level) host a significant fraction of counterrotating stars.
To interpret the observed frequencies of the gaseous and stellar counterrotating components of disc galaxies, we suggest a scenario in which S0 and spiral galaxies are subject to external gas acquisition with equal probability.
The retrograde acquisition of small amounts of external gas gives rise to counterrotating gaseous discs only in S0 galaxies, since in spiral galaxies the acquired gas is swept away by the pre-existing gas. The formation of counterrotating gaseous discs is favoured in S0 galaxies since they gas-poor systems, while spiral discs host large amounts of gas (Roberts & Haynes 1994; Bettoni, Galletta & Garcìa-Burillo 2003), which is corotating with the stellar component. When they acquire external gas in retrograde orbits, the gas clouds of the new retrograde and pre-existing prograde components collide, lose their centrifugal support, and accrete toward the galaxy centre. A counterrotating gaseous disc will be observed only if the mass of the newly supplied gas exceeds that of the pre-existing one (Lovelace & Chou 1996; Thakar & Ryden 1998). A counterrotating stellar disc is the end-result of star formation in the counterrotating gas disc. For this reason we observe a larger fraction of counterrotating gaseous disks in S0s than in spirals. This also explains why the mass of counterrotating gas in most S0 galaxies is small compared to that of the stellar counterrotating components (Kuijken et al. 1996). The fraction of S0s with a kinematically decoupled gas disc is consistent with the that we expect if all the gas in S0s is of external origin (Bertola et al. 1992).
Counterrotating gaseous and stellar discs in spirals are both the results of retrograde acquisition of large amounts of gas, and they are observed with the same frequency. In this framework stellar counterrotation is the end result of star formation in the a counterrotating gaseous disc.
Acknowledgements.
This research has made use of the Lyon-Meudon Extragalactic Database (LEDA) and of the NASA/IPAC Extragalactic Database (NED). We thank Sheila Kannappan for providing us her kinematic data and Giuseppe Galletta for useful discussions.References
- Baes et al. (2003) Baes, M., Buyle, P., Hau, G. K. T., & Dejonghe, H. 2003, MNRAS, 341, L44
- Baggett, Baggett, & Anderson (1998) Baggett, W. E., Baggett, S. M., & Anderson, K. S. J. 1998, AJ, 116, 1626
- Bender (1990) Bender, R. 1990, A&A, 229, 441
- Bender, Saglia, & Gerhard (1994) Bender, R., Saglia, R. P., & Gerhard, O. E. 1994, MNRAS, 269, 785
- Bertola & Corsini (1999) Bertola, F. & Corsini, E. M. 1999, in IAU Symp. 186, Galaxy Interactions at Low and High Redshift, ed. J. E. Barnes & D. B. Sanders (Dordrecth: Kluwer), 149
- Bertola, Buson, & Zeilinger (1992) Bertola, F., Buson, L. M., & Zeilinger, W. W. 1992, ApJ, 401, L79
- Bertola et al. (1995) Bertola, F., Cinzano, P., Corsini, E. M., Rix, H., & Zeilinger, W. W. 1995, ApJ, 448, L13
- Bertola et al. (1996) Bertola, F., Cinzano, P., Corsini, E. M., Pizzella, A., Persic, M., & Salucci, P. 1996, ApJ, 458, L67
- Bertola et al. (1999) Bertola, F., Corsini, E. M., Vega Beltrán, J. C., Pizzella, A., Sarzi, M., Cappellari, M., & Funes, J. G. 1999, ApJ, 519, L127
- Bettoni, Galletta, & García-Burillo (2003) Bettoni, D., Galletta, G., & García-Burillo, S. 2003, A&A, 405, 5
- Binney & Tremaine (1987) Binney, J. & Tremaine, S. 1987, Galactic Dynamics (Princeton: Princeton University Press)
- Bottema (1992) Bottema, R. 1992, A&A, 257, 69 (B92)
- Bullock et al. (2001) Bullock, J. S., Kolatt, T. S., Sigad, Y., Somerville, R. S., Kravtsov, A. V., Klypin, A. A., Primack, J. R., & Dekel, A. 2001, MNRAS, 321, 559
- Buta (1987) Buta, R. 1987, ApJS, 64, 1 (B87)
- Cinzano et al. (1999) Cinzano, P., Rix, H.-W., Sarzi, M., Corsini, E. M., Zeilinger, W. W., & Bertola, F. 1999, MNRAS, 307, 433
- Ciri, Bettoni, & Galletta (1995) Ciri, R., Bettoni, D., & Galletta, G. 1995, Nature, 375, 661
- Corsini et al. (1999) Corsini, E. M., Pizzella, A., Sarzi, M., Cinzano, P., Vega Beltrán, J. C., Funes, J. G., Bertola, F., Persic M., & Salucci, P. 1999, A&A, 342, 671
- Corsini et al. (2003) Corsini, E. M., Pizzella, A., Coccato, L., & Bertola, F. 2003, A&A, 408, 873
- Courteau (1997) Courteau, S. 1997, AJ, 114, 2402 (C97)
- de Vaucouleurs et al. (1991) de Vaucouleurs, G., de Vaucouleurs, A., Corwin, H. G. Jr., Buta, R. J., Paturel, G., & Fouquè, P. 1991, Third Reference Catalogue of Bright Galaxies (New York: Springer-Verlag) (RC3)
- Ferrarese (2002) Ferrarese, L. 2002, ApJ, 578, 90
- Ferrarese & Merritt (2000) Ferrarese, L., & Merritt, D. 2000, ApJ, 539, L9
- Fisher (1997) Fisher, D. 1997, AJ, 113, 950
- Funes et al. (2002) Funes, J. G., Corsini, E. M., Cappellari, M., Pizzella, A., Vega Beltrán, J. C., Scarlata, C., & Bertola, F. 2002, A&A, 388, 50
- Gerhard et al. (1998) Gerhard, O., Jeske, G., Saglia, R. P., & Bender, R. 1998, MNRAS, 295, 197
- Gebhardt et al. (2000) Gebhardt, K., Bender, R., Bower, G., et al. 2000, ApJ, 539, L13
- Guthrie (1992) Guthrie, B. N. G. 1992, A&AS, 93, 255
- Haynes et al. (2000) Haynes, M. P., Jore, K. P., Barrett, E. A., Broeils, A. H., & Murray, B. M. 2000, AJ, 120, 703
- Jore, Broeils, & Haynes (1996) Jore, K. P., Broeils, A. H., & Haynes, M. P. 1996, AJ, 112, 438
- Jorgensen, Franx, & Kjaergaard (1995) Jorgensen, I., Franx, M., & Kjaergaard, P. 1995, MNRAS, 276, 1341
- Kannappan & Fabricant (2001) Kannappan, S. J. & Fabricant, D. G. 2001, AJ, 121, 140
- Kuijken, Fisher, & Merrifield (1996) Kuijken, K., Fisher, D., & Merrifield, M. R. 1996, MNRAS, 283, 543
- Lovelace & Chou (1996) Lovelace, R. V. E. & Chou, T. 1996, ApJ, 468, L25
- Mathewson, Ford, & Buchhorn (1992) Mathewson, D. S., Ford, V. L., & Buchhorn, M. 1992, ApJS, 81, 413 (MFB92)
- Marzke et al. (1998) Marzke, R. O., da Costa, L. N., Pellegrini, P. S., Willmer, C. N. A., & Geller, M. J. 1998, ApJ, 503, 617
- Merrifield & Kuijken (1994) Merrifield, M. R. & Kuijken, K. 1994, ApJ, 432, 575
- Merrifield, Gerssen, & Kuijken (2001) Merrifield, M. R., Gerssen, J., & Kuijken, K. 2001, in Galaxy Disks and Disk Galaxies, ed. J. G. Funes & E. M. Corsini, ASP Conf. Ser. 230, (San Francisco: ASP), 221
- Meyssonnier (1984) Meyssonnier, N. 1984, A&AS, 58, 351 (M84)
- Merritt & Ferrarese (2001) Merritt, D. & Ferrarese, L. 2001, ASP Conf. Ser. 249: The Central Kiloparsec of Starbursts and AGN: The La Palma Connection, ed. J. H. Knapen et al. (San Francisco: ASP), 335
- Pignatelli et al. (2001) Pignatelli, E., Corsini, E. M., Vega Beltrán, J. C., Scarlata, C., Pizzella, A., Funes, J. G., Bertola, F., Zeilinger, W. W., & Beckman, J. E., 2001, MNRAS, 323, 188
- Pizzella et al. (2003) Pizzella, A., Dalla Bontà, E., Corsini, E. M., Coccato, L., & Bertola, F. 2003, in IAU Symp. 220, Dark Matter in Galaxies, ed. S. Ryder et al. (San Francisco: ASP), in press (astro-ph/0311023)
- Rix, Franx, Fisher, & Illingworth (1992) Rix, H., Franx, M., Fisher, D., & Illingworth, G. 1992, ApJ, 400, L5
- Roberts & Haynes (1994) Roberts, M. S. & Haynes, M. P. 1994, ARA&A, 32, 115
- Rubin, Thonnard, & Ford (1980) Rubin, V. C., Thonnard, N., & Ford, W. K. 1980, ApJ, 238, 471 (RTF80)
- Rubin, Thonnard, Ford, & Burstein (1982) Rubin, V. C., Thonnard, N., Ford, W. K., & Burstein, D. 1982, ApJ, 261, 439 (R82)
- Rubin, Graham, & Kenney (1992) Rubin, V. C., Graham, J. A., & Kenney, J. D. P. 1992, ApJ, 394, L9
- Sandage & Tammann (1981) Sandage, A., & Tammann, G. A. 1981, A Revised Shapley-Ames Catalog of Bright Galaxies (Wahigton: Carnegie Institution) (RSA)
- Sarzi et al. (2000) Sarzi, M., Corsini, E. M., Pizzella, A., Vega Beltrán, J. C., Cappellari, M., Funes, J. G., & Bertola, F. 2000, A&A, 360, 439
- Sil’chenko, Vlasyuk, & Alvarado (2001) Sil’chenko, O. K., Vlasyuk, V. V., & Alvarado, F. 2001, AJ, 121, 2499 (SVA01)
- Sofue & Rubin (2001) Sofue, Y. & Rubin, V. 2001, ARA&A, 39, 137
- Sofue et al. (1998) Sofue, Y., Tomita, A., Tutui, Y., Honma, M., & Takeda, Y. 1998, PASJ, 50, 427 (S+98)
- Thakar & Ryden (1998) Thakar, A. R. & Ryden, B. S. 1998, ApJ, 506, 93
- Vega Beltrán et al. (2001) Vega Beltrán, J. C., Pizzella, A., Corsini, E. M., Funes, J. G., Zeilinger, W. W., Beckman, J. E., & Bertola, F. 2001, A&A, 374, 394 (V+01)