Period and chemical evolution of SC stars
Abstract
The SC and CS stars are thermal-pulsing AGB stars with C/O ratio close to unity. Within this small group, the Mira variable BH Cru recently evolved from spectral type SC (showing ZrO bands) to CS (showing weak C2). Wavelet analysis shows that the spectral evolution was accompanied by a dramatic period increase, from 420 to 540 days, indicating an expanding radius. The pulsation amplitude also increased. Old photographic plates are used to establish that the period before 1940 was around 490 days. Chemical models indicate that the spectral changes were caused by a decrease in stellar temperature, related to the increasing radius. There is no evidence for a change in C/O ratio. The evolution in BH Cru is unlikely to be related to an on-going thermal pulse. Periods of the other SC and CS stars, including nine new periods, are determined. A second SC star, LX Cyg, also shows evidence for a large increase in period, and one further star shows a period inconsistent with a previous determination. Mira periods may be intrinsically unstable for C/O; possibly because of a feedback between the molecular opacities, pulsation amplitude, and period. LRS spectra of 6 SC stars suggest a feature at m, which resembles one recently attributed to the iron-sulfide troilite. Chemical models predict a large abundance of FeS in SC stars, in agreement with the proposed association.
keywords:
stars: individual: BH Cru – stars: AGB and post-AGB – stars: spectral classification1 Introduction
The observed properties of stars on the Asymptotic Giant Branch (AGB) are largely determined by the ratio of carbon to oxygen in their atmospheres. Carbon abundances in AGB stars increase due to dredge-up following their regular thermal pulses. After a series of these events, which happen every – yr, the enhanced carbon may cause a transition from an oxygen-rich star to a carbon-rich star, via the intermediate S-stars (e.g., Lloyd Evans, 1984).
The SC stars (Keenan & Boeshaar, 1980) form a continuous spectral sequence intermediate between the S and C stars (Catchpole & Feast, 1971). They show very strong sodium D-lines, and strong CN bands (Stephenson, 1973), and either weak ZrO bands (SC stars) or C2 bands (CS stars). The molecular abundances indicate a C/O number ratio very close to unity, so that CO formation leaves little C or O for the other molecules.
The SC star BH Crucis has simultaneously been found to show a unique combination of a lengthening period (Bateson, McIntosh & Venimore, 1988; Walker & Marino, 1991; Walker, Ives & Williams, 1995), and evolution in spectral type from SC to CS (Lloyd Evans, 1985), with ZrO bands (Catchpole & Feast, 1971) disappearing and C2 band appearing. The spectral evolution has been interpreted as due to an increase in C/O ratio (Whitelock, 1999). Both the period and abundance changes have been suggested to be caused by a recent thermal pulse (Whitelock, 1999; Wood & Zarro, 1981). BH Cru could therefore present a unique case of real-time AGB evolution.
In this paper we present an analysis of the light curve of BH Cru, to quantify the period and amplitude variation. Chemical modelling is used to investigate whether the change in relative molecular abundances can be explained as due to a decrease in effective temperature, at constant C/O ratio. We also present new periods for other SC stars, including two stars which may show period changes similar to BH Cru.
2 Pulsation in BH Cru
2.1 The star
BH Cru (also known as He 120) was reported to be variable by Welch (1969), and assigned a spectral type of SC 4.5-7 (Keenan, 1971; Keenan & Boeshaar, 1980). The star is bright, reaching a visual magnitude of 7, with an amplitude between 1m and 3m. Whitelock et al. (2000) suggest a distance of , from the Mira relation. At Galactic metallicity, carbon stars form for initial masses (Groenewegen & de Jong, 1993, their Table 5). The galactic -height of BH Cru of about 100 pc is consistent with such a progenitor star. A strong Sr I 4607Å line shows evidence for s-process element enhancements.
Optical photometry from Walker (1979) and infrared photometry from Whitelock et al. (2000) are listed in Table 1. The colours are typical for unobscured carbon stars, and the IRAS flux densities are consistent with photospheric emission. The K[12] colour gives a black-body temperature of 3000 K, identical to the stellar temperature (section 3.3 below). There is no evidence for on-going mass loss, neither from self-obscuration in the near-infrared, nor from a mid-infrared dust excess. The lack of mass loss is unusual for such a long-period Mira.
2.2 Recent period evolution
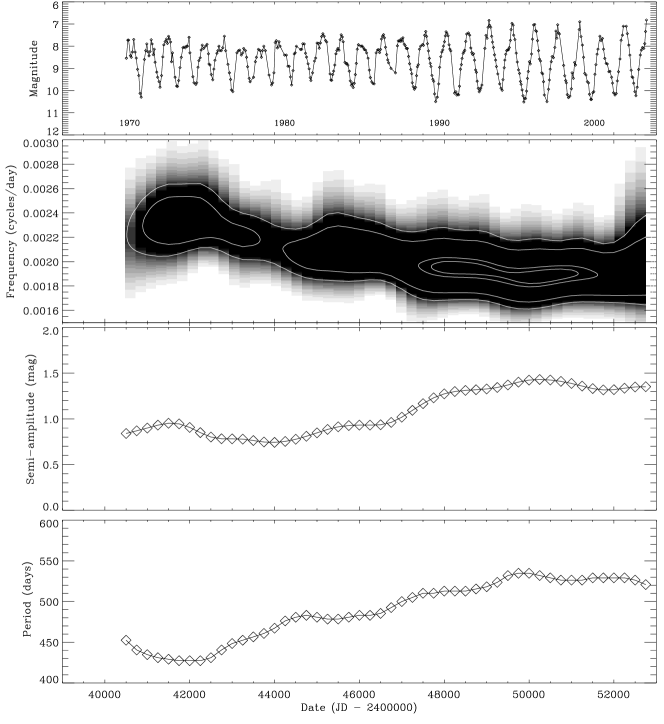
We have analysed visual observations collected by the Royal Astronomical Society of New Zealand (RASNZ). Only data from individual observers contributing 15–20 observations or more for each star were used. The light curve was binned into 20-day averages and analysed using wavelet transforms, which have the advantage of being sensitive to changes of the pulsation properties (period, amplitude) over time (e.g., Bedding et al. 1998). We have used the weighted wavelet Z-transform (WWZ) (Foster, 1996) developed at the AAVSO specifically for unevenly sampled data.
The visual light curve is shown in the top panel of Fig. 1. During the 1970s, the maxima tended to be flat and long-lived, with pronounced but shorter-lasting minima. From 1990 onward, the maxima became more pronounced and slightly brighter, with a hump on the ascending part that is very common among Mira variables. In the first few years, the light curve also showed a secondary minimum superposed on the plateau of maximum. Double maxima and minima of alternating depth are not uncommon among the longer-period Miras, e.g. R Cen (Hawkins, Mattei & Foster, 2001). In R Dor (Bedding et al., 1998), a split maximum preceded a change in pulsation mode.
The wavelet plot of BH Cru confirms the period evolution first reported by Bateson et al. (1988). The second panel of Fig. 1 shows the pulsation frequency as function of time, where the contours represent the significance level. The ‘best’ period is plotted in the bottom panel. From 1970 until around 1995, we see a steady increase in the period. Since 1995, the period has been more or less constant. The period was 425 days at the time of discovery (1969), 500 days in 1990 and 535 days in 1999. This large increase of over 25% within (at most) 20 years is unparallelled: among known Miras, only T UMi (Gál & Szatmáry, 1995; Mattei & Foster, 1995) has shown a comparable, but opposite, change. The new case of LX Cyg (Templeton et al., 2003) is discussed further below.
Although the period evolution shows some possible fluctuations, it can be well fitted with a constant rate of change of 5 days per year, corresponding to 1.4% per cycle, between 1975 and 1995. (The pre-1970 part of the curve shows a reverse change, but this may be affected by edge effects in the wavelet analysis.)
The semi-amplitude (third panel of Fig 1) shows similar strong evolution. It was around 0.8 mag before 1980 and, in parallel with the period increase, the semi-amplitude rapidly increased to 1.4 mag in about 1992. Except for a single faint maximum in AD 2000, the amplitude has since remained constant.
Fig. 2 illustrates the correlation between the increases in amplitude and period. It shows a roughly linear correlation, with the semi-amplitude increasing by about 50 mmag/cycle, or about 5% per cycle. The correlation between period and semi-amplitude evolution mirrors that seen in R Hya (Zijlstra, Bedding & Mattei, 2002), and also in R Aql and S Ori (Bedding et al., 2000) and Y Per (Kiss et al., 2000).

2.3 Older period data
Although BH Cru was only discovered to be variable in 1969, the region has been extensively covered by older surveys. But we have not found published records of BH Cru prior to 1969. The star is absent from the CP catalogue (Gill & Kapteyn, 1900) but this has a completeness limit of 9.2 mag and the blue magnitude of BH Cru is always below this. The deeper CD catalogue (Thome, 1932) goes to 10 mag, but also does not include it. These limits do not allow for an unambiguous interpretation. We have therefore searched the Harvard plates for evidence of its pre-discovery behaviour.
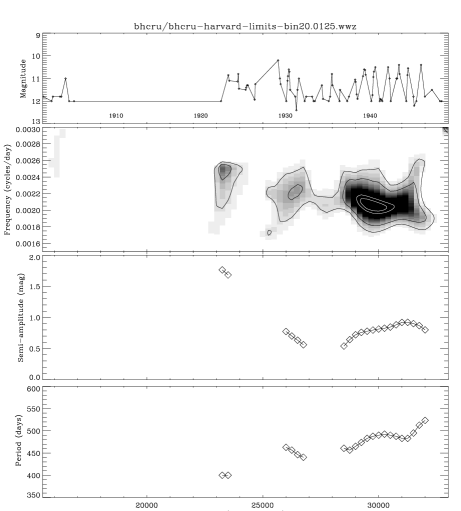
The Harvard Plate Stack contain 96 good observations of BH Cru, 15 detections with uncertain magnitude, and 37 plates where the star is not visible. The plates are almost exclusively blue. Combined with BH Cru’s , the star exists near the limit of the plates while at maximum. The data are shown in Fig. 3. We performed a wavelet analysis using the 96 good and 15 uncertain determinations, and also included upper limits where they were fainter than 11.8mag. (The brighter limits do not constrain the variability.)
BH Cru was a pulsating variable well before its discovery as such. Strong pulsations are evident, with an amplitude between 1 and 2 magnitude. The plates before 1910 are consistent with little or no fluctuations, but the sampling is poor and this is not conclusive. The data are too patchy for a well-determined period, however a period of about 490 days is indicated around 1940. The period at 1930 may have been slightly shorter (about 440 days).
Compared to Fig. 1, the period around 1940 was about 10 per cent longer than in the early 1970’s. The data suggest that the period was not constant even in this early phase and there may have been a further increase shortly after 1940. Further data would be desirable, but the conclusion from the available data is that between 1945 and 1970 the period must have decreased. The recent period instability may be part of a recurrent behaviour.
2.4 Physical changes in BH Cru
The pulsation equation for Mira variables is
| (1) |
for first overtone pulsators, where the pulsation constant (Fox & Wood, 1982), or
| (2) |
for fundamental mode pulsators (Wood, 1990). is the period in days and and are the radius and mass in solar units.
In Mira variables, decreases on times of scales of – yr because of the stellar wind, but over a century it is approximately constant. In any case, BH Cru shows no evidence for large mass loss. can be assumed as constant on this short time scale. The radius is not directly known; it is however the only parameter whose changes can explain the period evolution of BH Cru.
Miras are thought to be fundamental-mode pulsators, although this is not as well determined for the very long period variables. However, the observed optical radii for Miras are much larger than those predicted from the fundamental mode, and agree better with first overtone pulsators (Haniff, Scholz & Tuthill, 1995). The discrepancy may be due to missing opacity in the atmosphere models. van Belle et al. (2002) find increased diameters also at K, which they attribute to circumstellar (water) emission. Here we prefer Eq. (1) since it better fits the atmospheres.
The period of BH Cru increased by 25% since 1970, corresponding to a 16% change in the radius from Eq. (1). For a stable bolometric magnitude, this would decrease the effective temperature by 7.5%: K at the temperature of 3200 K (Loidl, Lançon & Jørgensen, 2001). Fundamental-mode models require a smaller radius change (12%) and temperature change (K).
If the luminosity also increased, a smaller temperature decrease would be required. The mean magnitude of the infrared light curve changed by no more than 0.1 mag, between 1980 and 1995, and the JK colour reddened by no more than 0.05 mag. The bolometric correction at K therefore decreased by less than 0.05 mag, using Fig. 16 of Whitelock et al. (2000). The mean magnitude of the optical light curve was constant to within 0.5 mag but it is much more sensitive to temperature variations and varying molecular opacity. Overall, the data is consistent with evolution at constant luminosity; any increase in the luminosity did not exceed 10%.
Assuming an initial radius of 300 R⊙, BH Cru will have expanded by , at an average velocity of . Typical small-amplitude Mira variables expand at – during the pulsation cycle. The small average expansion velocity would therefore not be expected to significantly disrupt the pulsational behaviour.
3 Equilibrium chemistry: ZrO and C2
3.1 Spectral changes
The spectral evolution of BH Cru is remarkable. Before 1973, BH Cru showed evidence for ZrO, but lacked C2 lines (Catchpole & Feast, 1971); the ZrO line was weak or absent around 1970 (Keenan, 1971) but strong in 1967 (Stephenson, 1973); Catchpole & Feast (1971) reported it as weakly present on an undated plate. In 1980, lines of C2 had appeared and the ZrO lines were no longer present (Lloyd Evans, 1985). The spectra taken around 1980 cover a substantial part of the light curve: cyclical variability cannot account for the observed evolution (Lloyd Evans, 1985). The few spectra taken around 1970 show ZrO lines of variable strength: during some part of the pulsation cycle, the pre-1973 spectra may have been lacking in ZrO as well. But the strong ZrO bands visible at times before 1973 did not re-occur over any part of te pulsation cycle in 1980.
The change has been interpreted as tracing an increase in the C/O ratio from to (Whitelock, 1999), associated with the dredge-up of carbon produced in a helium shell flash (a thermal pulse). However, below we investigate whether the change in effective temperature of the star can also explain the abundance changes, without requiring a change in the C/O ratio. We note that a possible recurrent shift in spectrum between the presence of ZrO and C2 has been seen in TT Cen (Stephenson, 1973).
A temperature effect is indicated by the fact that SC stars tend to have earlier subtypes than CS stars. Only two SC stars (see Appendix A) are known to reach types later than SC5 (BH Cru and LX Cyg), while three of the five CS stars are classed as C7 or later. The temperature zero point for C and S stars subclasses differ: C5 corresponds in temperature to about M0. However, SC7 and C7 have similar temperatures (Keenan & Boeshaar, 1980), and the late CS stars have therefore lower stellar temperatures than any of the SC stars with known subclass.
3.2 Temperature dependence


To investigate the temperature and C/O dependence in isolation of other parameters, we model the photospheric composition as a molecular equilibrium (e.g., Tsuji, 1973; Wyckoff & Clegg, 1978; Tarafdar, 1987; Sharp & Huebner, 1990). We calculate the molecular equilibrium composition by a direct minimisation of the Gibbs free energy of the system using a steepest descent technique (White, Johnson & Dantzig, 1958). The free energy of the system is given by
| (3) |
where is the number of moles of molecule and is the chemical potential of molecule ,
| (4) |
Here, is the Gibbs free energy of formation of molecule , is the total pressure of the system (a model parameter), and . The Gibbs free energy of formation of a molecule is a temperature-dependent thermo-chemical property that can be found for example in the JANAF tables (Chase et al., 1985). To estimate the value at other temperatures, we used an interpolation formula. Sharp & Huebner (1990) provide coefficients to a polynomial fit of the form
| (5) |
to the Gibbs free energies for 210 species using JANAF data. We added further species appropriate to AGB stars in the same way.
At chemical equilibrium, is a minimum (Zemansky, 1957). The equilibrium composition is therefore the set of mole numbers which minimises . Full details of the minimisation technique subject to these constraints can be found in Markwick (2000).
We adopt solar elemental abundances (Anders & Grevesse, 1989; Cameron, 1973) except for carbon which is enhanced to vary the C/O ratio. Models were run for values of the C/O ratio, between 1.01 and 1.5. The resulting equilibrium abundances of the molecules C2, ZrO and YO for a variety of temperatures and C/O ratios are shown in Figures 4–6. A plot of the H2 partial pressure is given in Fig. 7 to allow conversion of the partial pressures into fractional abundances.


Figure 4 shows clearly that the photospheric abundance of C2 increases with decreasing temperature over the range 4000–2800 K. Furthermore, the model shows that oxides such as ZrO can still exist at C/O ratio , although at reduced abundance (Fig. 5). The relative abundances shown in the figure do not take the s-process enhancements into account. In BH Cru, [Zr/H] (Abia & Wallerstein, 1998): assuming a linear scaling, the ZrO and C2 relative abundances are almost equal for C/O at . Abia & Wallerstein (1998) give C/O.
The photospheric temperature of BH Cru is taken as 3200 K (Loidl et al. 2001; these authors found a temperature close to minimum of about 2800 K). At these temperatures, Fig. 4 shows that even a relatively small decrease in temperature leads to a large increase in the abundance of C2: a decrease of 300 K can yield a ten-fold increase. The peak abundance is reached at K.
The disappearance of ZrO and appearance of C2 took place between 1973 and 1980 Lloyd Evans (1985). Assuming a constant rate of period evolution, the period increased by days or roughly 12% over this time. This corresponds to a radius increase of 8% and a temperature decrease of 4% if the luminosity remained constant (assuming first overtone pulsation). The for a current temperature of 3200 K would have increased the C2 abundance by a factor of 3–5 and decreased the ZrO abundance by a similar factor. The YO abundance should have decreased as well (see Fig. 6), but this molecule has only been weakly detected (Keenan & Boeshaar, 1980) and there is no observational mention of a change with time.
3.3 Atmosphere models
The model above has two shortcomings; we do not consider the extended atmosphere, and no time-dependent chemistry is included. Chemical equilibrium is unlikely to hold at the conditions and dynamic time scales within an extended pulsation-driven atmosphere. However, we do not attempt to address time-dependent chemistry here.

The extended atmosphere is described using the hydrostatic atmosphere models of Loidl et al. (2001). These models include equilibrium chemistry for a large number of molecules (but excluding e.g., Mg and Fe molecules and CaCl). Opacities are included for 7 carbon-star molecules only: CO, CN, CH, C2, HCN, C2H2 and C3. C/O is used. The models are shown in Fig. 8 for two different temperatures, corresponding to two different phases of the pulsation cycle. Comparison between the two temperatures confirms the strong dependence of the oxides and C2 on temperature. At the higher temperatures, C2 is mainly present near the photosphere. At the lower temperature, the abundance in the extended atmosphere is much higher. Model spectra at the two temperatures are shown in Fig. 9.

3.4 Optical spectra

The spectra of oxygen-rich Miras variables show few atomic lines due to the absorbing molecular blanket which hides the photosphere. In SC stars, this blanket is transparent and the spectrum is covered in lines (Tsuji, 1964).
Infared spectra of BH Cru are presented by Loidl et al. (2001): they show strong CN and weak C2 bands. We obtained optical spectra of BH Cru and some comparison SC/CS stars using the double-beam spectrograph at the MSSSO 2.3-m telescope, centred at the 6500Å ZrO band. The data were taken on 2003 May 18 and 21, under non-photometric conditions. The dispersion is 0.55Å/pixel and the resolution is about 1Å. The spectra are flat-fielded using an internal lamp and sky-subtracted. We did not correct for the atmospheric and instrumental response.
The spectra are shown in Fig. 10. Typical noise per wavelength pixel is 1%. The many lines repeat between the spectra, and are largely due to s-enhanced metals (e.g. Abia & Wallerstein, 1998). The 6708Å line is present in all other spectra but weak or absent in BH Cru. In all cases it is weaker than the adjacent LaI 6710Å. The lithium line overlaps with another line and the identification is not unambiguous (Reyniers et al., 2002).
The model spectrum of BH Cru (see previous section) is shown in the top diagram. The model is for 3200 K: the 2900 K model also gives an acceptable fit. The good fit obtained around 6500Å confirms the absence of the ZrO band (6474–6540Å) in BH Cru: the good fit is obtained in spite of this band not being included in the opacities in the model. All other stars which were observed show the band, although with varying strength. The broad 6350Å ZrO band is similarly seen in all stars except BH Cru.
BH Cru shows possible absorption lines at 6053 & 6070Å, which differ from the other stars and may be from the C2 Swan-band. Other lines of the Swan bands at 6190 & 6480Å are not detected, but the confusion at our resolution is too high to rule out their presence. C2 is present in BH Cru longward of 7000Å (Loidl et al., 2001).
The double CaCl band at 6200Å is seen in TT Cen only. This band is common in carbon stars, but is often blended and masked by strong CN bands. The CaCl abundance depends very little on the C/O ratio (Fig. 11). The CaCl band strength tends to vary over the pulsation cycle (Sanford, 1950), being strongest near minimum light: TT Cen was observed near minimum. TT Cen may be compared to VX Aql (Wyckoff & Wehinger, 1976), in which CaCl also is the strongest molecular band. Both these stars are long-period Miras. Clegg & Wyckoff (1977) show that CaCl is favoured by high density environments.
3.5 Dust
Stars with C/O close to unity have difficulty forming dust: the removal of C and O from the chemistry means that neither silicates nor carbon grains can form. It is therefore not surprising that the SC stars show little evidence for significant dust emission. A few ISO spectra have very poor S/N at mid-infrared wavelengths, and weak features would not be seen.
We therefore retrieved the IRAS LRS spectra of the seven SC/CS stars with 12-m fluxes above 15 Jy: BH Cru, AM Cen, FU Mon, UY Cen, S Lyr, VX Aql, and WZ Cas. The spectra mostly show adequate but low S/N (the brightest star in the sample, UY Cen, only has Jy). In order to emphasize any excess, we have subtracted a pseudo-continuum represented by a power law that was scaled to the flux at 14 m for each star.
The top panel of Fig. 12 shows the resulting spectrum of WZ Cas. The impression of a weak silicate feature is deceptive: it reflects a deep CS absorption feature at 8m.


None of the other SC LRS stars resembles WZ Cas. We have co-added the remaining six spectra and again subtracted a pseudo-continuum to produce a ’typical’ SC-star LRS spectrum (lower panel of Fig. 12). Compared to WZ Cas, the continuum-subtracted spectrum rises beyond 15 m. The wavelength coverage is insufficient to decide whether this is a dust continuum or a broad feature. However, the rise resembles that seen in some young stellar objects, where it is part of a feature peaking at 23m. This feature has previously been attributed to FeO, but Keller et al. (2002) found a fit to the iron-sulfide troilite. Hony et al. (2002) report the same feature and presumably the same mineral in planetary nebulae, and suggest a carbon-star origin. If the SC stars show the same feature, it would strongly support the identification with troilite, as formation of this mineral should benefit from the removal of O from the dust formation.


Figures 13 and 14 show the calculated equilibrium abundances of FeO and FeS. As expected, FeO declines sharply as the C/O ratio increases. FeS also shows a decline but is less sensitive especially at photospheric temperatures. At all but the lowest temperatures, FeS is the more abundant molecule by three orders of magnitude. The formation of an iron sulfide such as troilite would therefore not be unexpected. However, the evidence for a troilite feature is weak and this point remains to be confirmed.
Ferrarotti et al. (2000) suggest that FeSi would be the main dust component in S stars. This mineral has bands at 32 and 50 micron. ISO SWS spectra are available for three SC stars: WZ Cas, S Lyr and W Cas. The S/N is low and no emission can be seen longward of 30 micron.
Evidence for mass loss in BH Cru comes from a blue-shifted (by ) possible rubidium line Abia & Wallerstein (1998). Otherwise, the SC stars show little evidence for significant mass loss. (Of the stars in Table 2, only FU Mon was detected in CO and a mass-loss rate of derived with a very low expansion velocity () (Jorissen & Knapp, 1998).) This is in marked contrast to the oxygen-rich Miras and carbon Miras, even though the SC stars form an intermediate evolution. It is however understandable, as the mass loss is driven by radiation pressure on dust. SC stars are expected to form a phase of mass-loss interruption (Zijlstra et al., 1992) while evolving from an oxygen-rich to a carbon-rich star.
4 LX Cyg: another BH Cru
Large period changes similar to BH Cru are very rare among Mira variables: Zijlstra & Bedding (2003) describe 6 cases, including R Hya. They estimate that the type of evolution seen in BH Cru occurs in per cent of well observed Miras, over a century of observations. To find one on-going case among the small group of SC/CS stars (16 in total) would be unexpected. To find a second one would suggest a correlation between the rare spectral class and the period evolution.
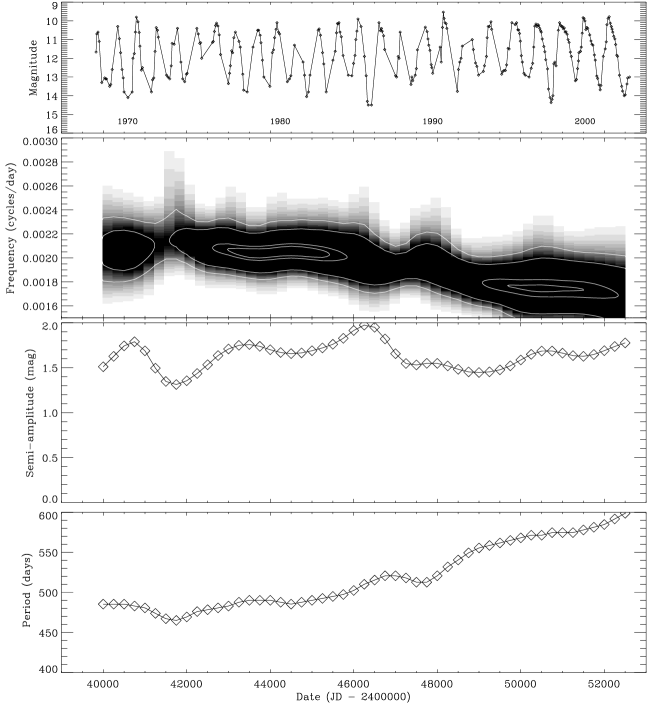
There is in fact a second case of period evolution among the SC stars. LX Cyg is an SC3 star with a catalogued (GCVS) period of 465 days. An increase of its period was independently discovered by Alksne & Alksnis (1985) and by Broens et al. (2000) and Templeton et al. (2003). Templeton et al. (2003) have analyzed an extended data set. They find that historical records of LX Cyg show the period was fairly stable at about 460d from its first measurement around JD 2426000 to 2439000, after which it increased to around 580 days. We note that BH Cru and LX Cyg are the two SC stars in Table 2 with the latest subtypes and longest periods. A spectrum kindly taken for us by James Bryan in 2003 confirms that LX Cyg is an SC star, but does not allow a current subclass to be determined.
We carried out a wavelet analysis of the AAVSO data, identical to the one shown for BH Cru. The result is shown in Fig. 15: the axis scales are the same as in Fig. 1, to facilitate the comparison. The rate of period change in LX Cyg is very similar to that in BH Cru. The pulsation amplitude is somewhat larger and has not changed significantly, and the total change in period is larger.
A redetermination, or in several cases a first determination, of the periods of the SC/CS stars is given Appendix A. There we show that our period of VX Aql (609 days; unknown subtype) is inconsistent with a earlier determination (470 days). We have insufficient data to confirm a period cange, but it seems possible that VX Aql is a third case of a SC star with an evolving period. If true, all SC star with periods longer than about 470 days show this effect. Many normal Miras with such periods also show fluctuations (Zijlstra & Bedding, 2003), but limited to about 10 per cent in period. The SC stars show much larger changes. Even without VX Aql, a link between the C/O ratio near unity, and the unstable periods, seems likely.
5 Discussion
A few Miras are known to show changing periods. The well-known case of R Hya was studied by Zijlstra et al. (2002) who find evidence for a stable period of 495 days before AD 1800, followed by a declining period, and a newly stable period of 385 dats since AD 1950. R Aql shows similar behaviour. TY Cas was recently added to the list of variable periods (Hazen & Mattei, 2003). But overall, period evolution among Miras is rare. Greaves & Howarth (2000) examined a sample of 100 Miras, and apart from the previously known case of T UMi (Gál & Szatmáry, 1995; Mattei & Foster, 1995; Szatmáry et al., 2003), found no further case of long-term period change. Wood (1976) studied 45 stars and found small period changes with greater than 99 per cent significance in 6 cases, but no large-scale evolution. Mattei & Foster (2000) performed a trend analysis of 383 long period variables using 90 years of AAVSO data. Only 9% showed evidence for trends, and of these only 9 stars showed strong trends. Percy & Au (1999) analysed a sample of 391 Mira variables and found some evidence for a slow average increase in periods with time, but few or no stars with large period variability.
This suggests that over the past 50–100 years, period evolution has only occurred in of well-observed Miras. To find a case among the seven SC/CS stars classified in the GCVS as Miras with established periods is not ruled out by this rate. But the discovery of a second case implies an overrepresentation of the SC/CS stars. The rate of occurence of period evolution among semi-regular variables is not known.
Period changes in Miras have normally been attributed to a recent thermal pulse or helium flash (Wood & Zarro, 1981). This explains the rarity of such objects. Fast period evolution will only occur during and immediately after the helium flash (Vassiliadis & Wood, 1993). At any one time, only may be found at the rapid period increase. This model would therefore suggest that BH Cru is in a unique evolutionary phase, following a thermal pulse occuring during the 1960s.
But the fact that, among the small number of SC stars, LX Cyg is also undergoing similar changes, makes the thermal-pulse explanation rather unlikely. The fact that historical records suggest recurrent period changes in BH Cru also argues against a thermal pulse. There are alternative models for period changes, predicting a non-linear instability in the Mira structure. In the case of R Hya (Zijlstra et al., 2002) those may yield a better fit to the data.
In AGB stars, the visual pulsation amplitude is largely determined by varying molecular opacities: e.g., the extreme amplitudes of oxygen-rich Miras is caused by the varying TiO and VO bands. The low molecular opacities in SC stars can explain their low pulsation amplitudes (Appendix A). However, the molecular abundances become very sensitive to small changes in the chemical equilibrium, and this may affect the pulsation amplitude. An increased pulsation will lower the effective temperature and this shifts the chemical equilibrium. This process can result in a positive feedback, which leads to larger pulsation amplitudes. Bedding, Conn & Zijlstra (2000) have suggested that a change in the amplitude can cause a period change (rather than the usually assumed reverse relation) due to non-linear effects. The positive feedback on the amplitude may thus affect the period as well, and may be a possible cause of the pulsation instability observed in BH Cru, LX Cyg and possibly VX Aql.
Finally, although we argue against a thermal pulse, we note even if a thermal pulse did occur, the C/O ratio in BH Cru would not have changed. Carbon dredge-up following a thermal pulse does not commence until yr after the thermal pulse (Mowlavi, 1999), when the radius has returned to its pre-thermal pulse value, and is continuing to decrease. The dredge-up for the models of Mowlavi (1999) lasts for about 100 yr while the period of the star is decreasing, well after the initial sharp period increase. Thus, in either case, the change from SC to CS star would be due to a lower temperature, and not a increase in the C/O ratio. The distinction between SC and CS stars may measure effective temperature, rather than an evolutionary progression (Stephenson, 1973).
6 Conclusions
Our investigation of the evolving variable BH Cru shows an increase in its period of 25% within 25 yr. The period has stabilized at about 540 days. The visual semi-amplitude has increased simultaneous with the period increase, up to a value of 1.25 mag. The changing period shows that the radius of the star has increased, and the temperature decreased, the latter confirmed by a slow reddening.
The spectral type of BH Cru changed simultaneously from SC to CS. Chemical equilibrium modelling, both for the potosphere and a hydrostatic atmosphere, explains this as due to the decrease in the effective temperature. The lower temperature favours formation of C2 and causes the fractional abundances of ZrO and YO to decrease. Our calculations explore a range of C/O, for which oxides are still found although at reduced abundances. The distinction between SC and CS stars does not require an evolution from C/O, as sometimes is suggested, although this can also play a role. Infrared spectra suggest the possible presence of the iron-sulfide troilite in SC stars. Chemical calculations show that FeS is abundant in the photosphere, and in the absence of silicates or carbon grains, may be an important dust component.
We determined new periods for a number of SC/CS stars, including three for stars with no previously known period. One star, LX Cyg, shows a much longer period than previously determined, and is confirmed as undergoing period evolution similar to BH Cru. VX Aql also shows an inconsistency between the present period and one previously reported. Among the few Miras known with evolving periods, BH Cru was unique in showing an increasing period. Its time scale for the evolution is ten times faster than that of the well-studied case of R Hya. With LX Cyg, a second case of rapid period increase is now known.
Period changes in Miras are commonly attributed to thermal pulses. This appears unlikely in BH Cru, because other SC stars show the same type of changes. As an alternative model we suggest the possiblity that a feedback between molecular opacities, pulsation amplitude and periods cause unstable periods among the long-period SC stars.
Acknowledgements
We appreciate the efforts of Ranald McIntosh in maintaining the RASNZ database, and of Brendon Brewer, who worked on some of the visual data as a vacation student. TRB is grateful to the Australian Research Council for financial support, and AAZ, MM and AJM acknowledge a PPARC rolling grant. PPARC also supported this research via a visitor grant.
References
- Abia & Wallerstein (1998) Abia C., Wallerstein G., 1998, MNRAS, 293, 89
- Alksne & Alksnis (1985) Alksne Z., Alksnis A., 1985, ISKZ, 22, 85
- Anders & Grevesse (1989) Anders E., Grevesse N., 1989, Geochimica et Cosmochimica Acta, 53, 197
- Bateson et al. (1988) Bateson F. M., McIntosh R., Venimore C. W., 1988, Royal Astronomical Society of New Zealand Publications of Variable Star Section, 15, 70
- Bedding (2003) Bedding T. R., 2003, Ap&SS, 284, 61
- Bedding et al. (2000) Bedding T. R., Conn B. C., Zijlstra A. A., 2000, in Szabados L., Kurtz D., eds, IAU Colloquium 176: The Impact of Large-Scale Surveys on Pulsating Star Research. Vol. 203, Studies of Mira and semiregular variables using visual databases. ASP Conf. Ser., p. 96
- Bedding & Zijlstra (1998) Bedding T. R., Zijlstra A. A., 1998, ApJ, 506, L47
- Bedding et al. (1998) Bedding T. R., Zijlstra A. A., Jones A., Foster G., 1998, MNRAS, 301, 1073
- Broens et al. (2000) Broens E., Diepvens A., Van Der Looy J., 2000, Variable Stars: Visual Light Curves. Vereniging voor Sterrenkunde
- Cameron (1973) Cameron A. G. W., 1973, Space Science Reviews, 15, 121
- Catchpole & Feast (1971) Catchpole R. M., Feast M. W., 1971, MNRAS, 154, 197
- Chase et al. (1985) Chase Jr. M. W., Davies C. A., Downey Jr. J. R., Frurip D. J., McDonald R. A., Syverud A. N., 1985, J. Phys. Chem. Ref. Data, 14, Suppl. No. 1
- Clegg & Wyckoff (1977) Clegg R., Wyckoff S., 1977, MNRAS, 179, 417
- Ferrarotti et al. (2000) Ferrarotti A., Gail H.-P., Degiorgi L., Ott H. R., 2000, A&A, 357, L13
- Foster (1996) Foster G., 1996, AJ, 112, 1709
- Fox & Wood (1982) Fox M. W., Wood P. R., 1982, ApJ, 259, 198
- Gál & Szatmáry (1995) Gál J., Szatmáry K., 1995, A&A, 297, 461
- Gill & Kapteyn (1900) Gill D., Kapteyn J. C., 1900, Annals of the Cape Observatory, 5
- Greaves & Howarth (2000) Greaves J., Howarth J. J., 2000, Journal of the British Astronomical Association, 110, 131
- Greene & Wing (1975) Greene A. E., Wing F., 1975, ApJ, 200, 688
- Groenewegen & de Jong (1993) Groenewegen M. A. T., de Jong T., 1993, A&A, 267, 410
- Haniff et al. (1995) Haniff C. A., Scholz M., Tuthill P. G., 1995, MNRAS, 276, 640
- Hawkins et al. (2001) Hawkins G., Mattei J. A., Foster G., 2001, PASP, 113, 501
- Hazen & Mattei (2003) Hazen M. L., Mattei J. A., 2003, JAAVSO, 31, 21
- Hony et al. (2002) Hony S., Bouwman J., Keller L. P., Waters L. B. F. M., 2002, A&A, 393, L103
- Jorissen & Knapp (1998) Jorissen A., Knapp G. R., 1998, A&AS, 129, 363
- Keenan (1971) Keenan P. C., 1971, MNRAS, 153, 1P
- Keenan & Boeshaar (1980) Keenan P. C., Boeshaar P. C., 1980, ApJS, 43, 379
- Keller et al. (2002) Keller L. P., Hony S., Bradley J. P., Molster F. J., Waters L. B. F. M., Bouwman J., de Koter A., Brownlee D. E., Flynn G. J., Henning T., Mutschke H., 2002, Nature, 417, 148
- Kiss et al. (1999) Kiss L. L., Szatmáry K., Cadmus R. R., Mattei J. A., 1999, A&A, 346, 542
- Kiss et al. (2000) Kiss L. L., Szatmáry K., Szabó G., Mattei J. A., 2000, A&AS, 145, 283
- Kurochkin (1958) Kurochkin N. E., 1958, Perem. Zvezdy, 12, 277
- Lloyd Evans (1984) Lloyd Evans T., 1984, MNRAS, 208, 447
- Lloyd Evans (1985) Lloyd Evans T., 1985, in ASSL Vol. 114: Cool Stars with Excesses of Heavy Elements. The evolutionary connection between S and C stars: evidence from star clusters and the Magellanic Clouds. Reidel, Dordrecht, p. 163
- Loidl et al. (2001) Loidl R., Lançon A., Jørgensen U. G., 2001, A&A, 371, 1065
- Markwick (2000) Markwick A. J., 2000, PhD Thesis, UMIST
- Mattei & Foster (1995) Mattei J. A., Foster G., 1995, Journal of the American Association of Variable Star Observers, 23, 106
- Mattei & Foster (2000) Mattei J. A., Foster G., 2000, in Ibanoglu C., ed., NATO ASIC Proc. 544: Variable Stars as Essential Astrophysical Tools Trend Analysis of Long Period Variables. Kluwer Academic Publishers, p. 485
- Mowlavi (1999) Mowlavi N., 1999, A&A, 344, 617
- Percy & Au (1999) Percy J. R., Au W. W.-Y., 1999, PASP, 111, 98
- Reyniers et al. (2002) Reyniers M., Van Winckel H., Biémont E., Quinet P., 2002, A&A, 395, L35
- Sanford (1950) Sanford R. F., 1950, ApJ, 111, 270
- Sharp & Huebner (1990) Sharp C. M., Huebner W. F., 1990, ApJS, 72, 417
- Stephenson (1973) Stephenson C. B., 1973, ApJ, 186, 589
- Szatmáry et al. (2003) Szatmáry K., Kiss L. L., Bebesi Z., 2003, A&A, 398, 277
- Tarafdar (1987) Tarafdar S. P., 1987, in IAU Symposium 120: Astrochemistry Condensation and molecular abundances in stellar atmopheres. Reidel, Dordrecht, pp 559–563
- Templeton et al. (2003) Templeton M. R., Mattei J. A., Price A., 2003, IBVS, 5367, 1
- Thome (1932) Thome J. M., 1932, Resultados del Observatorio Nacional Argentino, 21
- Tsuji (1964) Tsuji T., 1964, Annals of the Tokyo Astronomical Observatory, 9
- Tsuji (1973) Tsuji T., 1973, A&A, 23, 411
- van Belle et al. (2002) van Belle G. T., Thompson R. R., Creech-Eakman M. J., 2002, AJ, 124, 1706
- Vassiliadis & Wood (1993) Vassiliadis E., Wood P. R., 1993, ApJ, 413, 641
- Walker (1979) Walker A. R., 1979, South African Astronomical Observatory Circular, 1, 112
- Walker et al. (1995) Walker W. S., Ives F. V., Williams H. O., 1995, Southern Stars, 36, 123
- Walker & Marino (1991) Walker W. S., Marino B. F., 1991, Southern Stars, 34, 314
- Welch (1969) Welch R. G., 1969, RASNZ, Variable Star section, Circular, 152
- White et al. (1958) White W. B., Johnson W. M., Dantzig G. B., 1958, Journal of Chemical Physics, 28, 751
- Whitelock et al. (2000) Whitelock P., Marang F., Feast M., 2000, MNRAS, 319, 728
- Whitelock (1999) Whitelock P. A., 1999, New Astronomy Review, 43, 437
- Wood (1976) Wood P. R., 1976, in ASSL Vol. 60: IAU Colloquium 29: Multiple Periodic Variable Stars. Red Variables. p. 69
- Wood (1990) Wood P. R., 1990, in From Miras to Planetary Nebulae: Which Path for Stellar Evolution? Pulsation and evolution of Mira variables. pp 67–84
- Wood et al. (1999) Wood P. R., Alcock C., Allsman R. A., Alves D., Axelrod T. S., Becker A. C., Bennett D. P., Cook K. H., Drake A. J., et al., 1999, in LeBertre T., Lèbre A., Waelkens C., eds, IAU Symp. 191: Asymptotic Giant Branch Stars. MACHO observations of LMC red giants: Mira and semi-regular pulsators, and contact and semi-detached binaries. ASP, p. 151
- Wood & Zarro (1981) Wood P. R., Zarro D. M., 1981, ApJ, 247, 247
- Wyckoff & Clegg (1978) Wyckoff S., Clegg R. E. S., 1978, MNRAS, 184, 127
- Wyckoff & Wehinger (1976) Wyckoff S., Wehinger P. A., 1976, MNRAS, 175, 587
- Zemansky (1957) Zemansky M. W., 1957, Heat and Thermodynamics. McGraw Hill Book Co., New York
- Zijlstra & Bedding (2003) Zijlstra A. A., Bedding T. R., 2003, Journal of the American Association of Variable Star Observers (JAAVSO), 31, 2
- Zijlstra et al. (2002) Zijlstra A. A., Bedding T. R., Mattei J. A., 2002, MNRAS, 334, 498
- Zijlstra et al. (1992) Zijlstra A. A., Loup C., Waters L. B. F. M., de Jong T., 1992, A&A, 265, L5
Appendix A Periods of the other SC stars
| name | var. | Period | Period | spectral type | |
|---|---|---|---|---|---|
| type | (max) | (GCVS) | (this work) | ||
| [days] | [days] | ||||
| LQ Ara | M: | 10.3 | 193? | SC | |
| AM Cen | LB | 10.4 | 276? | SC | |
| V372 Mon | SR | 12.5 | SC(N) | ||
| V3832 Sgr | LB: | 13.4 | SC | ||
| UX Vola | LB: | 9.2 | 182 | SC | |
| BH Cru | M | 7.2 | 540 | 430–530 | SC4.5/8-SC7/8 |
| UY Cen | SR | 9.22 | 115 | SC | |
| CM Cyg | M | 9.3 | 255 | SC2-S4e | |
| LX Cyg | M | 11.5 | 465 | 470–600 | SC3e-S5,5e: |
| S Lyr | M | 9.8 | 438 | 436 | SCe |
| GP Ori | SRB | 12.2 | 370 | 184, 339 | C8,0J:(SC)ea |
| CY Cyg | LB | 11.0 | irregular | CS(M2p) | |
| R CMi | M | 7.25 | 338 | 337 | C7,1Je(CSep) |
| TT Cen | M | 11.5 | 462 | CSe | |
| FU Mon | SR | 11.6 | 310 | C8,0J(CSe) | |
| RZ Peg | M | 7.6 | 439 | 437 | C9,1e(Ne)/CSe |
| VY Aps | SRA | 9.6 | 152 | ||
| AM Car | SR | 14.3 | 314 | ||
| R Ori | M | 9.05 | 377 | ||
| RR Her | SRB | 8.8 | 240 | ||
| W Cas | M | 7.8 | 406 | ||
| WZ Cas | SRa | 9.4 | 186 | ||
| VX Aql | M: | 604 |
a We note that the GCVS gives the wrong declination for this star. The correct values are (J2000)
The General Catalogue of Variable Stars (GCVS) lists only 11 SC stars (including BH Cru) and 5 CS stars. These are listed in Table 2. Keenan & Boeshaar (1980) and Catchpole & Feast (1971) list a few other SC stars that the GCVS gives as carbon stars, and which perhaps should be classified as CS. In Table 2, these stars are in the third group (in italics).
Of the 16 known SC and CS stars, 6 have no catalogued period. We attempted to determine some of their periods, and to confirm existing periods, using new data (see below) and data from amateur databases. New light curves and/or power spectra were determined for the six stars, as follows.
LQ Ara, AM Cen, UX Vol:
Photometric observations of these three stars were obtained by one of us (VT) using CCD imaging with an unfiltered 100mm telephoto lens. For LQ Ara, the light curve and power spectrum (Fig. 16) indicate a period of 193 days. The amplitude is low, indicating that this star is a semiregular (not a Mira, as suggested in the GCVS). For AM Cen (Fig. 17) we find a possible period of 276 days, but this requires confirmation with more data. The star UX Vol (Fig. 18) appears to be a semiregular with a period of 182 days.


GP Ori:
This star is classified as a semiregular (SRb) with a period of 370 d in the GCVS. We have analysed about 440 visual estimates from the AAVSO and VSOLJ databases, spread rather sparsely over the past 30 years. The power spectrum, shown in Fig. 19, confirms GP Ori as a semiregular with two periods: 184 d (0.00543 d-1) and 339 d (0.00295 d-1). The period ratio of 1.84 is typical of many semiregulars (Kiss et al., 1999). The power spectrum is somewhat complicated by yearly gaps in the data (the peak at 0.081 d-1 is an alias), and this is made worse by the fact that the shorter period is very close to half a year. Nevertheless, both periods seem secure. Bedding & Zijlstra (1998) showed that in double-period semiregulars, the longer period tends to agree with the Mira period–luminosity relation while the shorter period falls on the semi-regular sequence (sequences C and B of Wood et al. 1999). We also note that the power spectrum shows broadened envelopes that have been interpreted by Bedding (2003) as evidence for solar-like oscillations (i.e., stochastic excitation, presumably from convection).

CY Cyg:
We have analyzed 424 AAVSO observations from JD 2438540 to JD 2452653. The star seems completely irregular, and the Lb classification (which is usually based on lack of data) seems warranted.
VX Aql:
This star is of particular interest because of a C/O ratio suggested to be exactly unity (Greene & Wing, 1975). The GCVS lists it as a Mira but does not give a period. A VSOLJ light curve is shown in Fig. 20. The AAVSO light curve can be found on the AAVSO web site. We have analyzed 86 observations from a single AAVSO observer which show the star is a Mira, with a period of 604 days and a very pronounced double maximum. Interestingly, Wyckoff & Wehinger (1976) adopted a period of 470 d which they attributed to Kurochkin (1958). It seems possible that VX Aql is another example of an SC/CS star that has shown a large period increase.

RZ Peg, S Lyr, R CMi:
For each of these stars, visual observations from AAVSO, VSOLJ and AFOEV databases show them to be Miras and confirm the periods listed in the GCVS and in Mattei & Foster (2000). The data go back 80–90 years, over which time the periods are all stable.