eurm10 \checkfontmsam10 \pagerange1–8
The Stellar Populations of Low-redshift Clusters
Abstract
We present some preliminary results from an on-going study of the evolution of stellar populations in rich clusters of galaxies. Our baseline sample contains core line-strength measurements from 183 galaxies with from four clusters with , against which observations of higher-redshift clusters can be compared. Using predictions from stellar population models to compare with our measured line strengths we can derive relative luminosity-weighted mean ages and metallicities for the stellar populations in each of our clusters. It must be stressed that these ages and metallicities are only accurate when used in an relative sense as the stellar population models, due to differing abundance ratios used in the models compared to those observed in elliptical galaxies, provide inaccurate absolute ages and metallicities. We also investigate the Mgb′- and H- scaling relations. We find that Mgb′ is correlated with , the likely explanation being that larger galaxies are better at retaining their heavier elements due to their larger potentials. H, on the other hand, we find to be anti-correlated with . This result implies that the stellar populations in larger galaxies are older than in smaller galaxies.
1 Introduction and Observations
The formation and evolution of clusters of galaxies and of their early-type galaxy population is a topic of active debate. Studying the integrated light from stellar populations can help to discriminate between models of giant elliptical galaxy formation: the monolithic collapse model ([Eggen, Lynden-Bell & Sandage, 1962, Eggen et al., 1962]) in which giant elliptical galaxies form rapidly in a process that can essentially be considered a single collapse and the hierarchical merging model ([Searle & Zinn, 1978]) in which giant elliptical galaxies are built up over a long timescale by distinct merger events. If it was found that early-types were largely coeval in clusters then this would favour the monolithic collapse model, whereas a large spread in ages would favour hierarchical merging.
Increasing a galaxy’s age by a factor of two while decreasing it’s metallicity by a factor of three results in a spectrum almost indistinguishable from the original ([Worthey, 1994]). This age/metallicity degeneracy can be partially broken by comparing age-sensitive spectroscopic indices with metallicity-sensitive spectroscopic indices. By plotting two such indices against each other and comparing the results to stellar population models (e.g. [Worthey, 1994]; [Thomas et al., 2003]) we can determine the mean relative luminosity-weighted age and metallicity of a given stellar population.
Previous work in this area has concentrated on individual clusters such as Coma ([Jørgensen, 1999]; [Moore et al., 2002]) and Fornax ([Kuntschner, 2000]) with sometimes conflicting results coming from the same cluster, e.g. [Gonzalez, Faber & Worthey, 1993, Gonzalez et al. (1993)] and [Moore et al., 2002, Moore et al. (2002)]. Coma and Fornax represent the extremes of the cluster richness scale and this project will study clusters that fill in this range. We will study, in detail, the stellar populations in several low-redshift () clusters from the core out into the surrounding structures. These results will then be used as a comparison for observations of a range of higher-redshift clusters (), allowing us to draw conclusions about the formation and evolution of the stellar populations in rich clusters.
Line-strength measurements, redshifts and velocity dispersions were obtained for 183 galaxies from four clusters over three nights in April 2002 with the 2dF system on the 3.9m AAT. The sample was selected from galaxies with , within a diameter FOV centred on each of the clusters and within a redshift range centred on the cluster redshift. The 300B grating (Å FWHM) was used to obtain a wide spectral range covering as many indices as possible, while the 1200V grating (Å FWHM) was used to obtain higher resolution spectra yielding precise velocity dispersions.
2 Ages and Metallicities
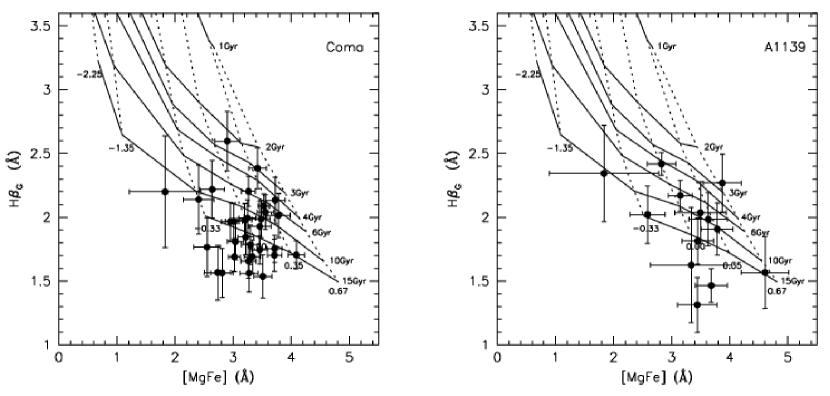
Comparison of the measured equivalent widths of H and [MgFe] for two of our clusters, Coma and A1139, and predictions from the [Thomas et al., 2003, Thomas et al. (2003)] stellar population models is shown in Fig. 1. Using these models we obtain relative ages and metallicities for our stellar populations. We find that Coma cluster galaxies have a mean age of Gyr with a mean metallicity of dex relative to solar. A1139, we find, has a mean age of Gyr with a mean metallicity of dex relative to solar. Refinements still need to be made to the data set and the other clusters need to be analysed before any conclusions can be drawn. The age/metallicity degeneracy is quite evident from these plots. Also, there seems to be some disagreement between our observations and the models. The data points with low H equivalent widths could be star-forming galaxies, which we wish to exclude from this part of the analysis. By examining each galaxy’s spectra for emission lines indicative of a star-forming galaxy and by measuring H equivalent widths we can eliminate these galaxies from our sample.
3 Scaling Relations
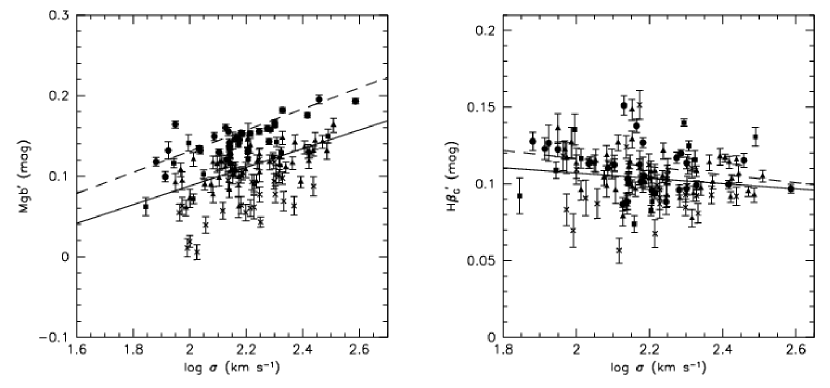
In Fig. 2 we show the Mgb′ (the dash denoting that the index value has been converted from Angstroms to magnitudes) and H versus central velocity dispersion () scaling relations for all four of our clusters. The solid line in both plots are our robust fit to the data from all four clusters while the dotted lines are fits taken from the literature.
We find that H is anti-correlated with and find good agreement between our fit of H and that from [Kuntschner, 2000, Kunstchner (2000)] of H. The likely implication is that more massive galaxies are older relative to less massive galaxies.
Mgb′, however, we find is correlated with . The usual explanation for this correlation is that larger ellipticals have a deeper potential and hence find it easier to hold on to heavier elements produced in supernova explosions than do smaller ellipticals. We obtain a fit of Mgb while the fit found by [Colless et al., 1999, Colless et al. (1999)] is Mgb. The slopes agree quite well but there seems to be an offset between our fit and [Colless et al., 1999, Colless et al. (1999)]. We also note an offset in Mgb between our clusters. Since previous results have found no significant change in the zero-point of this relation (e.g. [Colless et al., 1999, Colless et al., 1999]) we suspect this may be a data reduction issue, but it may possibly indicate cluster to cluster variations, contrary to previous results.
References
- [Colless et al., 1999] Colless, M., Burstein, D., Davies, R. L. et al. 1999 MNRAS 303, 813–825.
- [Eggen, Lynden-Bell & Sandage, 1962] Eggen, O. J., Lynden-Bell, D. & Sandage, A. R. 1962 ApJ 136 748–766.
- [Gonzalez, Faber & Worthey, 1993] Gonzalez, J. J. and Faber, S. M. and Worthey, G. 1993 AAS 25 1355.
- [Jørgensen, 1999] Jørgensen, Inger 1999 MNRAS 306, 607–636.
- [Kuntschner, 2000] Kuntschner, H. 2000 MNRAS 315, 184–208.
- [Moore et al., 2002] Moore, Stephen A. W., Lucey, John R., Kuntschner, Harald et al. 1998 MNRAS 336, 382–408.
- [Searle & Zinn, 1978] Searle, L. & Zinn, R. 1978 ApJ 225, 357-379.
- [Thomas et al., 2003] Thomas, D., Maraston, C. & Bender, R. 2002 MNRAS 339, 897–911.
- [Worthey, 1994] Worthey, Guy 1994 ApJS 95, 107-149.