Search for Calibrators for the Submillimeter Array: I. High-Mass Star Forming Regions
Abstract
We present initial results of an ongoing search for interferometric calibrators at submillimeter (sub-mm) wavelengths with the Submillimeter Array (SMA). Powerful radio galaxies are commonly used as calibrators at centimeter and millimeter wavelengths, but many are not strong enough to serve as calibrators at sub-mm wavelengths because of their rapidly declining flux densities toward shorter wavelengths. The inability to find a calibrator close to the target source may limit or even prevent us from imaging many interesting sources at sub-mm wavelengths. Here, we investigate whether high-mass protostellar objects and ultracompact H II regions can serve as useful calibrators for the SMA. The dust emission associated with these objects makes them among the brightest sub-mm sources in the sky. Our observations at 0.85 mm (345 GHz) with an angular resolution of 3 reveal that although a large fraction of the dust emission originates from an extended “halo” component, a compact unresolved component often remains that when sufficiently strong may serve as a useful calibrator. These observations also provide a first glimpse at the small-scale distribution of dust around ultracompact H II regions and high-mass protostellar objects at sub-mm wavelengths. We discuss the origin of the core-halo structure seen in many sources, and conclude with suggestions for future searches for calibrators with the SMA.
1 Introduction
Calibrators used for determining the amplitude and phase (hereafter referred to as gain) of an interferometer are usually compact (i.e., spatially unresolved) and bright. The difference between the measured and expected gain of the calibrator, introduced by the Earth’s atmosphere and telescope electronics, are used to correct the gain measured towards the target source. Because transmission (affecting the amplitude) and refraction (affecting the phase) through the Earth’s atmosphere can differ significantly along different lines of sight, the calibrator should lie close in the sky to the target source. At centimeter and millimeter wavelengths, powerful radio galaxies are sufficiently compact, bright and numerous to serve as calibrators in virtually any region of the sky. At submillimeter (sub-mm) wavelengths, however, most of these radio galaxies are too weak to serve as calibrators for the Submillimeter Array111The Submillimeter Array is a joint project between the Smithsonian Astrophysical Observatory and the Academia Sinica Institute of Astronomy and Astrophysics, and is funded by the Smithsonian Institution and the Academia Sinica. (SMA). This is because their synchrotron emission usually decreases rapidly in intensity towards shorter wavelengths, and furthermore the instrumental noise is higher because of higher system temperatures at shorter wavelengths. We estimate that only about eighty radio galaxies are bright enough to serve as calibrators for the SMA at 0.85 mm (345 GHz), so that the mean angular separation between calibrators in the sky is 20∘. This may limit our ability to image many interesting sources, especially at high angular resolutions where accurate gain corrections (and hence close proximity of a calibrator) become increasingly important. At 0.45 mm (690 GHz) the situation is drastically worse, with only about a dozen radio galaxies useable as calibrators for the SMA; none are located at R.A. 5h19h and Dec. 5∘. Even with the addition of planets and their moons to the list of available calibrators, we still may not be able to image sources in large swaths of the sky.
By contrast with synchrotron emission, thermal emission from dust has a rapidly increasing intensity towards shorter wavelengths, so that dust sources are good candidates for calibrators at sub-mm wavelengths. A particularly promising class of objects are young high-mass stars, which can often be found embedded in their natal molecular cloud cores even when they have produced sufficient UV photons to excite an ultracompact (UC) H II region. The emission from their dust cocoons makes them among the brightest sources in the Galaxy at sub-mm wavelengths; in single-dish observations, high-mass star-forming regions can exhibit continuum emission of up to a few hundred Jy at 0.35 mm (Sandell, 1994; Hunter et al., 2000). Their dust distribution on the relative small spatial scales that interferometers probe, however, is not known. Recently, high angular resolution (05) mid-IR observations of the UC H II region G29.960.02 showed a good spatial coincidence between warm dust grains and ionized gas imaged at 1.3 cm (De Buizer et al., 2002). If the cooler dust probed at sub-mm wavelengths has a similar distribution, UC H II regions may make suitable calibrators at sub-mm wavelengths. Their location in the Galactic plane makes them an especially important addition to the available calibrators for studies of star-forming regions and other Galactic objects. In this Letter, we present the first results at 0.85 mm to determine whether high-mass star forming regions can serve as calibrators for the SMA. Because of the relative paucity of available calibrators at 0.45 mm, this also is a necessary first step towards determining whether young high-mass stars can potentially serve as calibrators at shorter wavelengths.
2 Observations
2.1 Sample Selection and Observational Strategy
To preferentially select for point-like dust emission, we targeted eight high-mass star forming regions that are either UC H II regions with very small angular sizes (1) as cataloged by Wood & Churchwell (1989) and Kurtz, Churchwell & Woods (1994), or high-mass protostellar objects (HMPOs) with a centrally peaked morphology in mm (dust) continuum as compiled by Sridharan et al. (2002) and Beuther et al. (2002). The five selected UC H II regions are relatively isolated, with no other known compact ionized gas sources within the 35 field of view of the SMA thereby avoiding confusion from nearby young massive stars. The three selected HMPOs are each associated with a centrally peaked 1.2-mm (dust) continuum source imaged with the IRAM 30-m telescope at an angular resolution of 11 (Beuther et al., 2002). Follow-up interferometric observations at higher angular resolutions (2″4″) revealed just a compact source in each case (Beuther et al., 2004a, b; Wyrowski et al., 2004). The properties of the target sources are summarized in Table 1.
2.2 Observational Parameters
Observations in the 0.85 mm band were carried out with the SMA between 2003 May and 2003 September in its compact and extended configurations with 4 antennas in each configuration. The combined arrays provided projected baselines ranging from approximately 10 m to 120 m. To optimize the uv coverage, 23 sources were observed alternatively in a track with an on-source integration time of 1 hour per source. The half-power width of the SMA primary beam at 0.85 mm is 35, and the total available double-sideband bandwidth was 2 GHz at the time of the observations. See Ho, Moran, & Lo (2004) for more complete specifications of the SMA. The absolute flux density scale was determined from observations of either Uranus or Neptune, and is estimated to have an uncertainty of 25%. The nearest available radio galaxy was observed as the gain calibrator for each target source. We calibrated the data using the MIR software package adapted for the SMA from the MMA software package developed originally for the OVRO (Scoville et al., 1993). We made maps using the MIRIAD package. With natural weighting, typical angular resolutions were about 34 and noise levels were 30 mJy beam-1.
3 Results and Discussion
3.1 Structure of the 0.85 mm Continuum Emission
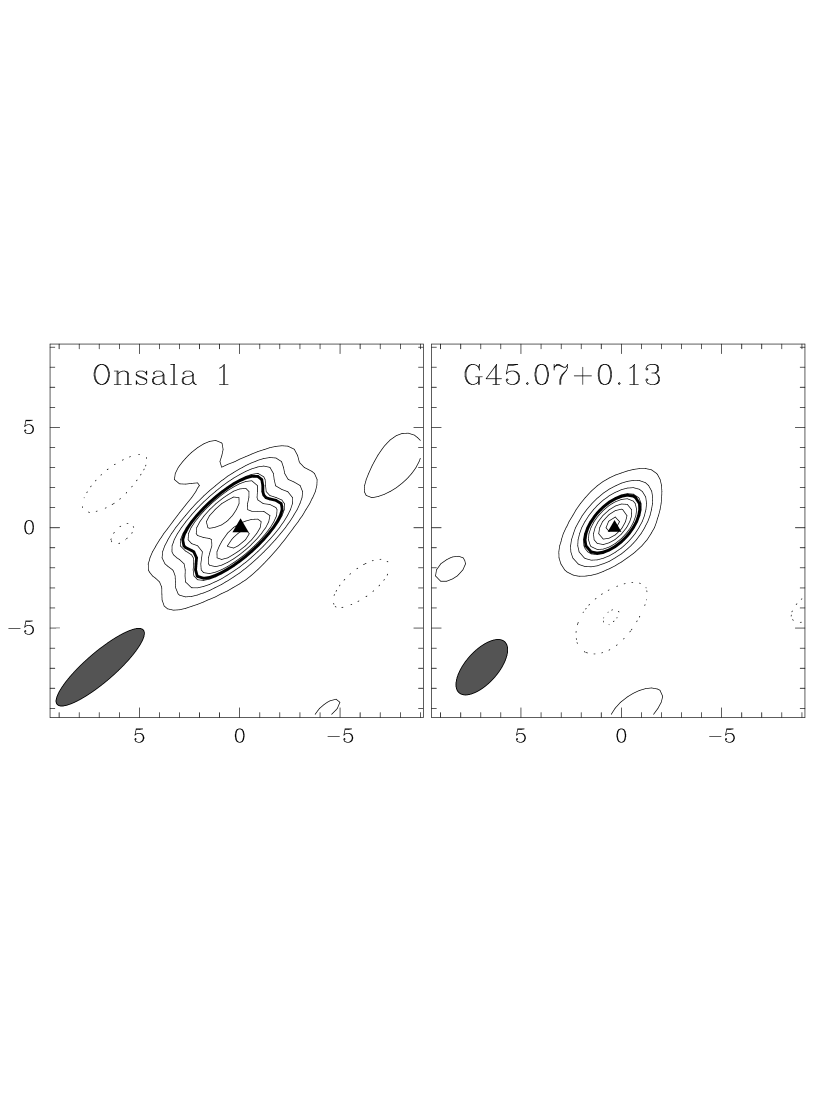
We detected continuum emission towards all target sources. The two sources G10.8412.592 and Onsala 1 show distinct multiple components, as shown in the left panel of Figure 1 for Onsala 1. These sources are for the time being ruled out as suitable calibrators at 0.85 mm. For the remaining six sources, five show what appears to be a single compact component, whereas in the case of G15.040.68 extended emission is also detected. As diffuse/extended structures can be difficult to discern in the image plane, we also examined the amplitude of the measured visibilities as a function of projected baseline length (i.e., uv distance). For an extended source, the visibility amplitude generally decreases with increasing uv distance, whereas a point source shows a constant visibility amplitude over all uv range. As an example, the right panel of Figure 1 shows a map of the 0.85 mm continuum towards G45.07+0.13. This image reveals a compact “core” component that is at best only marginally resolved. The visibility amplitude plot of Figure 2, however, clearly reveals an extended “halo” structure. Indeed, all the five sources that appeared to be compact in our maps were found to exhibit extended emission.
To estimate the flux densities and sizes of the different components in each target source, we first fitted the measured visibilities with a one-dimensional Gaussian source structure (i.e., halo component). When this fit proved unsatisfactory, we added a point source (i.e., core component). As shown in Figure 2, the visibility amplitudes of G45.07+0.13 can be fit with a core-halo structure with flux densities of 0.90 Jy and 2.71 Jy for the two respective components, and a half-power width for the halo of 38. The results of the fits for all six sources are listed in Table 2. Two are satisfactorily fit by a single Gaussian component, whereas the four sources G15.040.68, G45.07+0.13, IRAS 180891732, and IRAS 19217+1651 require a core component with flux density of at least 0.35 Jy in addition to a halo component.
3.2 Suitability as Calibrators
The first two sub-mm bands at which the SMA can operate are 0.85 and 0.45 mm. With a system temperature of 500/2000 K and aperture efficiency of 0.70/0.60 at 0.85/0.45 mm, and a bandwidth of 2 GHz, the rms noise level for a single baseline in a 5-min integration is about 0.07/0.35 Jy. We require the calibrators to be strong enough that the phase variations due to random noise fluctuations in a given calibration scan are smaller than those produced by the atmosphere between scans. For typical weather at Mauna Kea, over a 15 minute interval the atmospheric phase variations are 6 to 30 degrees for 10 m to 100 m baselines at 0.85 mm, and a factor of 2 higher at 0.45 mm (Masson, 1994). Such phase variations are comparable with those seen in our observations of Uranus/Neptune at 0.85 mm. For the SMA, the (antenna-based) rms phase noise is 28/X degrees (Bridle, 1989), where X is the signal-to-noise ratio for a single baseline. To achieve an rms phase precision of 6 degrees over a 5-min calibrator scan, we require X to be 5, corresponding to a flux density of 0.35/1.8 Jy at 0.85/0.45 mm. All four of the above-mentioned sources with point-like components therefore qualify as calibrators at 0.85 mm, provided that short baselines sensitive to the halo component are excluded and enough baselines remain to derive (antenna-based) gain solutions. Observations in superior weather conditions requiring higher phase precision will naturally require stronger calibrators and/or longer integration times.
For the above-mentioned sources to be suitable also as calibrators at 0.45 mm, we require them to have a frequency spectrum Sν >2.5. If the 0.85 mm emission is produced entirely (or predominately) by dust, then we require a dust opacity index 0.5; such a dust opacity index is commonly found in star-forming regions (e.g., Molinari et al., 2000). We therefore anticipate that G15.040.68, IRAS 180891732, and IRAS 19217+1651, whose cm-wave continuum emission is relatively weak (30 mJy) and hence their 0.85 mm emission dominated by dust, are suitable as calibrators also at 0.45 mm. This, however, may not be the case for G45.07+0.13. As shown in Figure 3, the flux densities of G45.07+0.13 at 21.3 cm (1522 GHz) measured with the VLA range from 0.6 to 0.9 Jy, comparable to the measured flux density of the core component at 0.85 mm. In this case, a large fraction of the core emission may be produced by free-free emission.
3.3 Dust Distribution of UC H II Regions and HMPOs
Three of the sources in Table 2 have been observed in the continuum at 0.85 mm with the JCMT (Sandell, 1994; Jenness et al., 1995; Walsh et al., 2003). Although the primary beam of the JCMT is a factor of 2.5 smaller than that of the SMA, nevertheless the single-dish flux density is a factor of 13 larger than that inferred for our core and halo components combined. Because our measurements do not provide stringent constraints on the radial intensity profile of the halo component (modelled here as a symmetric Gaussian), we may have underestimated its total flux density. For example, if the halo component has a power-law radial density and/or temperature profile instead of a Gaussian profile, its visibility amplitude will decrease more rapidly with increasing uv distance and hence its total flux density higher. On the other hand, there may be a distinct, very extended (10) component that our interferometric observations do not detect. The halo components that we observe have sizes ranging from 0.02 to 0.2 pc, which is comparable to or smaller than the molecular envelopes traced in CS (J=54) around young high-mass stars of 0.3 pc (Shirley et al., 2003). Thus, the halo component may trace the inner regions of this dense molecular envelope.
The presence of a core component implies a compact region that is denser and/or warmer than its immediate surroundings. van der Tak et al. (2000) also find compact (2″) dust components in several HMPOs and UC H II regions at 3 mm and 1.3 mm, and suggest that these components may originate from circumstellar disks. Circumstellar disks are commonly seen around low-mass protostars, but have been inferred only around a few massive young stellar objects. Yorke & Welz (1996) postulate that the photoevaporation of such disks is required to inject material to sustain UC H II regions. For a dust temperature of 50 K (and = 1), the inferred masses (for an interstellar gas to dust ratio of 100) of the compact components are 350 M☉. By comparison, Shepherd et al. (2001) reported a (dust) disk around G192.163.82 with a mass of 3 M☉, while Zhang et al. (1998) reported a (NH3) disk around IRAS 20126+4104 with a minimum mass of 5 M☉. Of course, a part or all of the core emission could originate instead from a centrally collapsed region that surrounds the central star. For UC H II regions, the compact component could in addition be produced by warm dust either cospatial with or in a relatively thin layer around the ionized gas, as seen in the mid-IR (Kraemer et al., 2001, 2003).
3.4 Future Directions
In our initial search for calibrators among eight young high-mass stars, we identified four potential candidates. Although promising, we still need to demonstrate that calibration off the point-source component in these sources can be successful (this test was not possible here given the limited number of baselines that sampled the point-source component). If not, we plan to investigate whether detailed maps of these sources can be used as an input for gain calibration (analogous to the case in VLBI experiments). Bright and compact H II regions whose free-free emission is by itself sufficiently strong to serve as calibrators at sub-mm wavelengths (e.g., G45.07+0.13) should also be explored.
In its sparsest configuration, the SMA can attain an angular resolution of 03 at 0.85 mm and 015 at 0.45 mm. Even if sufficiently compact dust sources associated with high-mass star-forming regions can be found, it is unlikely that they will be bright enough to serve as useful calibrators. To illustrate, an opaque dust source with a temperature of 200 K (the highest so far measured in high-mass star-forming regions; Cesaroni et al. (1994)) and a size of 03/015 at 0.85/0.45 mm has a flux density of 1.8 Jy. This is at the lower limit required for calibration at 0.45 mm, and for more reasonable dust temperatures and opacities, may not exceed the required flux density to allow calibration even at 0.85 mm. Thus, for observations at the highest angular resolutions with the SMA where no known calibrators close to the target source exist, we may have to resort to 2-D mapping of relatively compact ( 1) dust sources (if such sources exist). Finally, the SMA was designed to observe in two different wavelength bands simultaneously to allow observations of a calibrator at a longer wavelength to be used to correct the gain of the telescope at a shorter wavelength, but this capability remains to be implemented and tested.
References
- Araya et al. (2002) Araya, E., Hofner, P., Churchwell, E., & Kurtz, S. 2002, ApJS, 138, 63
- Beuther et al. (2002) Beuther, H., Schilke, P., Menten, K. M., Motte, F., Sridharan, T. K., & Wyrowski, F 2002, ApJ, 566, 945
- Beuther et al. (2004a) Beuther, H., Hunter, T., Zhang, Q., Sridharan, T. K., Zhao, J.-H., Sollins, P., Moran, J., Ho, P., Ohashi, N., Liu, S.-Y., Lim, J., & Su, Y.-N. 2004a, ApJ, this volumn
- Beuther et al. (2004b) Beuther, H., Schilke, P., & Wyrwoski, F., 2004b, ApJ, in press
- Bridle (1989) Bridle, A. H. 1989, in ASP Conf. Proc. 6, Synthesis Imaging in Radio Astronomy, ed. R. A. Perley, F. R. Schwab, & A. H. Bridle (San Francisco: ASP), 443
- Cesaroni et al. (1994) Cesaroni, R., Churchwell, E., Hofner, P., Walmsley, C. M., & Kurtz, S. 1994, A&A, 288, 903
- De Buizer et al. (2002) De Buizer, J. M., Watson, A. M., Radomski, J. T., Piña, R. K., & Telesco, C. M. 2002, ApJ, 564, L101
- Garay, et al. (1985) Garay, G., Reid, M. J., & Moran, J. M. 1985, ApJ, 289, 681
- Garay, et al. (1986) Garay, G., Rodríguez, L. F., & van Gorkom, J. H. 1986, ApJ, 309, 553
- Ho, Moran, & Lo (2004) Ho, P. T. P., Moran, J., Lo, K. Y. 2004, ApJ, this volumn
- Hunter et al. (1997) Hunter, T. R., Phillips, T. G., & Menten, K. M. 1997, ApJ, 478, 283
- Hunter et al. (2000) Hunter, T. R., Churchwell, E., Watson, C., Cox, P., Benford, D. J., & Roelfsema, P. R. 2000, AJ, 119, 2711
- Jenness et al. (1995) Jenness, T., Scott, P. F., & Padman, R. 1995, MNRAS, 276, 1024
- Kraemer et al. (2001) Kraemer, K. E., Jackson, J. M., Deutsch, L. K., Hora, J. L., Fazio, G. G., Hoffmann, W. F., & Dayal, A. 2001, ApJ, 561, 282
- Kraemer et al. (2003) Kraemer, K. E., Jackson, J. M., Kassis, M., Deutsch, L. K., Hora, J. L., Simon, R., Hoffmann, W. F., Fazio, G. G.; Dayal, A., Bania, T. M., Clemens, D. P., & Heyer, M. H. 2003, ApJ, 588, 918
- Kurtz, Churchwell & Woods (1994) Kurtz, S., Churchwell, E., & Woods, D. O. S. 1994, ApJS, 91, 659
- Masson (1994) Masson, C. R. 1994, in ASP Conf. Ser. 59, Astronomy with Millimeter and Submillimeter Wave Interferometry, ed. M. Ishiguro & W. J. Welch (San Francisco: ASP), 87
- Molinari et al. (2000) Molinari, S., Brand, J., Cesaroni, R., & Palla, F. 2000, A&A, 355, 617
- Mueller et al. (2002) Mueller, K. E., Shirley, Y. L., Evans, N. J., II, & Jacobson, H. R. 2002, ApJS, 143, 469
- Sandell (1994) Sandell, G. 1994 MNRAS, 271, 75
- Scoville et al. (1993) Scoville, N. Z., Carlstrom, J. E., Chandler, C. J., Phillips, J. A., Scott, S. L., Tilanus, R. P. J., & Wang, Z. 1993, PASP, 105, 1482
- Shepherd et al. (2001) Shepherd, D. S., Claussen, M. J., and Kurtz, S. E. 2001, science, 292, 1513
- Shirley et al. (2003) Shirley, Y. L., Evans, N. J., II, Young, K. E., Knez, C. & Jaffe, D. T. 2003, ApJS, 149, 375
- Sridharan et al. (2002) Sridharan, T. K., Beuther, H., Schilke, P., Menten, K. M., and Wyrowski, F. 2002, ApJ, 566, 931
- van der Tak et al. (2000) van der Tak, F. F. S., van Dishoeck, E. F., Evans, N. J., II, & Blake, G. A. 2000, ApJ, 537, 283
- Walsh et al. (2003) Walsh, A. J., Macdonald, G. H., Alvey, N. D. S., Burton, M. G., & Lee, J.-K. 2003, A&A, 410, 597
- Wink et al. (1982) Wink, J. E., Altenhoff, W. J., & Mezger, P. G. 1982, A&A, 108, 227
- Wood & Churchwell (1989) Wood, D. O. S. & Churchwell, E. 1989, ApJS, 69, 831
- Wood et al. (1988a) Wood, D. O. S., Churchwell, E., & Salter, C. J. 1988a, ApJ, 325, 694
- Wood et al. (1988b) Wood, D. O. S., Handa, T., Fukui, Y., Churchwell, E., Sofue, Y., & Iwata, T. 1988b, ApJ, 326, 884
- Wyrowski et al. (2004) Wyrowski, F. et al. 2004, in preparation
- Yorke & Welz (1996) Yorke, H. W. & Welz, A. 1996, A&A, 315, 555
- Zhang et al. (1998) Zhang, Q., Hunter, T. R., & Sridharan, T. K. 1998, ApJ, 505, L151
| Position(2000) | S2cm | 2cm Size | S1.3mm | S350μm | Gain | |||
|---|---|---|---|---|---|---|---|---|
| Source | (mJy) | Maj Min | (Jy/(11″)2) | (Jy) | Calibrator | Ref. | ||
| UC H II Regions | ||||||||
| G10.8412.592 | 18 19 12.12 | 20 47 31.3 | 8.7 | 0.5 | 320 | NRAO 530 | 1,2 | |
| G15.040.68 | 18 20 24.82 | 16 11 35.0 | 158.7 | 0.4 0.3 | NRAO 530 | 3 | ||
| G45.07+0.13 | 19 13 22.08 | +10 50 53.4 | 594.2 | 0.7 0.5 | 180 | 1925+211 & 2015+371 | 3,4 | |
| Onsala 1 | 20 10 09.08 | +31 31 35.7 | 203.9 | 0.7 0.6 | 110 | 2015+371 | 1,2 | |
| G80.865+0.420 | 20 36 52.19 | +41 36 24.3 | 40.0 | 0.8 0.6 | 2015+371 | 1 | ||
| HMPOs | ||||||||
| IRAS180891732 | 18 11 51.46 | 17 31 28.8 | 0.9a | 2.1 | 220 | NRAO 530 | 4,5,6 | |
| IRAS182641152 | 18 29 14.42 | 11 50 23.5 | 1a | 1.8 | NRAO 530 | 5,6 | ||
| IRAS19217+1651 | 19 23 58.79 | 16 57 41.5 | 32a | 0.6 | 1925+211 & 2015+371 | 5,6 | ||
| range | Halo Component | Point-like Source | ||
|---|---|---|---|---|
| Source | (k) | Size (″) | Ampa (Jy) | Ampa (Jy) |
| G15.040.68 | 13 80 | 9.560.71 | 14.183.14 | 0.530.05 |
| G45.07+0.13 | 20 80 | 3.820.53 | 2.710.45 | 0.900.12 |
| G80.865+0.420 | 18 77 | 2.980.04 | 0.900.01 | —b |
| IRAS180891732 | 13 81 | 2.680.17 | 4.630.25 | 1.720.20 |
| IRAS182641152 | 27 140 | 1.130.09 | 1.310.10 | —b |
| IRAS19217+1651 | 18 80 | 1.990.17 | 0.920.07 | 0.350.04 |