FUSE OBSERVATIONS OF THE SYMBIOTIC STAR AG DRACONIS
Abstract
Spectra of the bright symbiotic star AG Draconis (BD+67∘922) in the wavelength range 905–1187 Å obtained with the Far Ultraviolet Spectroscopic Explorer (FUSE) are presented. The spectra show a number of narrow, nebular emission lines, together with a uniform continuum from the hot component of the system, and numerous interstellar absorption lines. We infer the existence of Ne viii in the AG Dra nebula through the identification of the Ne vii 973.3 Å recombination line. The emission line spectrum is dominated by intense lines of O vi, but also shows weaker lines from highly-ionized ions including Ne v, Ne vi, S iv, S vi. Members of the He ii Balmer series can be identified up to n=20. Lines of Fe ii and Fe iii fluoresced by O vi 1032 are identified at wavelengths 1141.172 Å and 1142.429 Å, respectively. The emission lines are shown to be produced in a plasma with an electron temperature of 20–30,000 K, photoionized by the white dwarf. The Ne vi 997/999 ratio shows that this ion and all others except perhaps Ne vii are formed at least 300 white dwarf radii from the white dwarf. Revised wavelengths for the Ne v – and Ne vi – transitions are published.
1 Introduction
Symbiotic stars are binary stars that are identified spectroscopically as typically having three components: a giant, a hot star (usually a white dwarf), and a circumstellar nebula, ionized by the hot component’s radiation field. Accretion of material from the giant’s wind onto the white dwarf can lead to eruptions that may last several years and raise the system’s brightness by several magnitudes. AG Draconis (BD+67∘922) is one of the brightest symbiotics at UV and X-ray wavelengths and undergoes outbursts in 3–6 year long intervals that repeat every 15 years or so. The observations described here took place during quiescence. The components of AG Dra are a K0–4 giant and a hot star, most likely a white dwarf (Mikołajewska et al., 1995). For convenience we will refer to the hot component as a white dwarf for the remainder of this article. The temperature of the white dwarf is derived through fitting a blackbody curve to the continuum observed at X-ray and UV wavelengths, although contrasting results are found: Greiner et al. (1997) finding a temperature of 170,000 K from ROSAT X-ray spectra, while (Mikołajewska et al., 1995) finding 100,000 K from IUE spectra.
The system is a non-eclipsing binary with an orbital period of 550 days (Meinunger, 1979; Gális et al., 1999; Fekel et al., 2000). The radial velocity was found by De Medeiros & Mayor (1999) to be km s-1 and they give the rotational velocity of the giant as km s-1. The abundances of the giant are well determined (Smith et al., 1996) and demonstrate that it is metal deficient and possibly a barium star. The distance to AG Dra is crucial in fixing many of the properties of the system, yet it is rather uncertain, with the Hipparcos satellite only yielding a lower limit of 1 kpc. Mikołajewska et al. (1995) argue from a classification of the giant for a distance of 2.5 kpc, which is the value we adopt in the present work.
AG Dra is a particularly attractive target in the far ultraviolet on account of the low extinction (EB-V=0.05 Mikołajewska et al., 1995) along its sightline, resulting from the high latitude of the system (). Spectra from the International Ultraviolet Explorer (IUE) showed strong emission lines from highly ionized species including He ii 1640, C iv 1548,1550 and N v 1238,1242 (Viotti et al., 1983). The first reported observations for wavelengths below 1200 Å were made by Schmid et al. (1999) who identified strong emission lines from O vi 1032,1038 and He ii 1085.
We report here observations made with the Far Ultraviolet Spectroscopic Explorer (FUSE) in the wavelength region 905–1187 Å made in 2000 March and 2001 April during a quiescent period of the system. These spectra are at a higher resolution and sensitivity than any previous spectra in this range and reveal a number of new plasma diagnostics available for interpreting the nebular emission from the system.
2 The instrument
FUSE is described in detail in Moos et al. (2000) and Blair & Andersson (2001), and we describe the main features of the spectrograph here. There are four telescope channels labeled LiF1, LiF2, SiC1, and SiC2, each containing a mirror, a focal plane assembly and a grating. The labels refer to the coatings on the mirrors and gratings, either silicon carbide (SiC) or lithium fluoride (LiF). The LiF coatings are highly efficient at wavelengths above Å, but have very little efficiency for smaller wavelengths, hence the SiC channels extend the FUSE wavelength range down to 900 Å.
There are two detectors, with the LiF1 and SiC1 spectra being imaged on detector 1, and LiF2 and SiC2 imaged on detector 2. Each detector consists of two segments, labeled A and B, which are read out independently by the detector electronics. The LiF and SiC spectra on each segment are treated individually by the FUSE calibration pipeline, and so one refers to, e.g., the LiF1A spectrum, the SiC2B spectrum, etc. As there is a physical gap between each detector’s two segments, there is a gap of Å between the A and B spectra for each channel.
There are three apertures on the focal plane assembly that are available for observing, the largest () and smallest () apertures were used for the AG Dra observations.
Guiding is done via a fine error sensor, which is fixed to the LiF1 channel. The target can move in the remaining channel apertures due to thermally-induced mirror motions. The motion of the SiC channels is generally greater than that for LiF2 and occasionally the target can leave the aperture.
3 Data reduction
Version 1.8.7 of the FUSE calibration pipeline was run on the raw data files. In particular, versions 6 and 10 of the flux and calibration files were used, respectively. For the SiC spectra, only that portion of the observation for which the target was in the aperture (see Sect. 4) was run through the pipeline to minimize background counts in the spectra.
4 Observations
The components of AG Dra are not resolved by FUSE and so the spectra presented here show emission from the entire system. Two observations were performed through programs S312 and P248, and details are given in Table 1. The SiC channels were only aligned for small portions of the total exposure time in 2000 March, leading to effective exposure times of 440 s and 300 s for SiC1 and SiC2, respectively. The O vi 1032 flux from the 2000 March observation was erg cm-2 s-1 Å-1 in the center of the line, exceeding the FUSE flux limit of erg cm-2 s-1 Å-1, and so a special observing sequence was employed for the second observation to ensure the safety of the FUSE detectors. AG Dra was first observed through the 1.5′′ 20′′ slit (HIRS) which has a throughput around 50% of that of the standard 30′′ 30′′ slit and so the count rate on the detector at 1032 was reduced. Coupled with the expected fall in the 1032 flux due to observing at a different orbital phase of the system (Sect. 13), the effective 1032 flux then fell below the FUSE flux limit. Alignment of the target in the aperture is much more difficult with the HIRS slit and so observation P2480101 consisted of three individual exposures. The 1032 line was used to check target alignment during the exposures as it is observed in all four of the FUSE telescope channels and has a high count rate. The LiF1 channel was aligned throughout, with only a small loss of flux in the third exposure. LiF2 showed a loss of flux of around 10% compared to LiF1. A significant number of counts were only detected from SiC1 in the third exposure, but there are rapid variations in the count rate during this exposure and so these data are not useful. SiC2 showed a relatively uniform 1032 count rate during exposures 2 and 3, but very few counts in exposure 1.
| Date | PhaseaaUsing ephemeris of Fekel et al. (2000). | Dataset ID | Exposure | Aperture | Time | Exposure time (s) |
|---|---|---|---|---|---|---|
| 2000 March 16 | 0.540 | S31202 | 1 | LWRS | 15:57 | 2388 |
| 2001 April 25 | 0.277 | P24801 | 1 | HIRS | 05:28 | 901 |
| 2 | HIRS | 05:50 | 788 | |||
| 3 | HIRS | 06:09 | 451 | |||
| P24802 | 1 | LWRS | 06:57 | 2060 |
The loss of flux in the SiC channels was anticipated and so a second observation was obtained with AG Dra in the LWRS aperture, but with the LiF focal plane assemblies moved such that the target would not lie in the aperture. The effective areas of the SiC channels are lower than those of the LiFs, while the degree of astigmatism is greater and so the count rate per unit area on the detector is much lower. This results in the count rate in the 1032 line lying at a safe level. No loss of flux is evident during the single SiC-only exposure. A weak signal from the O vi lines was detected in the LiF channels due to scattered light from AG Dra.
5 The Spectrum and Line List
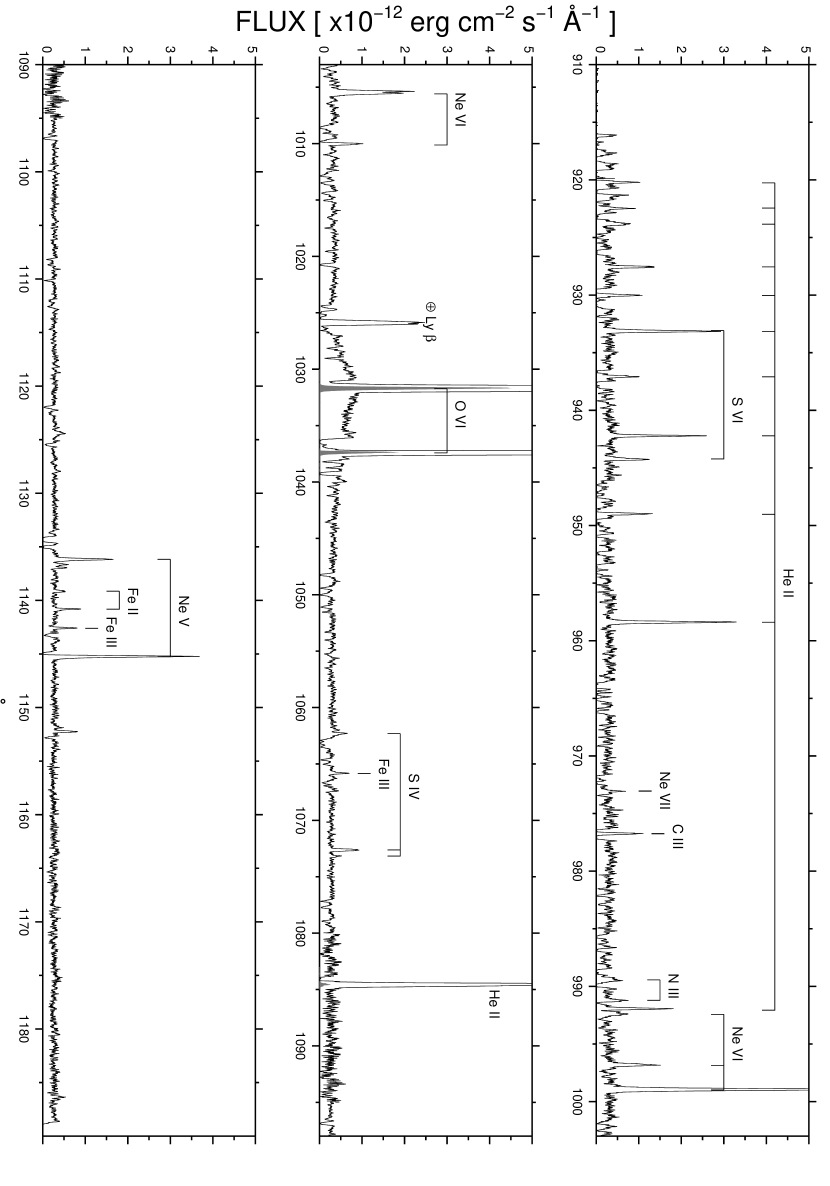
Fig. 1 displays the spectrum of AG Dra over the complete FUSE wavelength range assembled from the LiF spectra of the 2000 March observation and the SiC spectra of the 2001 April observation. The key features are (i) a uniform continuum from the white dwarf; (ii) narrow, nebular emission lines from highly-ionized species; and (iii) interstellar absorption lines.
The present work will largely focus on the emission lines in the spectrum. We briefly discuss some properties of the interstellar lines here. Comparisons of the absorption line wavelengths with those of the emission lines shows that they are redshifted relative to the radial velocity of the system by km s-1 and so are from the interstellar medium. Absorption by the hydrogen Lyman series, O i, N i, N ii, Fe ii, Si ii and Ar i is seen, as well as numerous lines of H2. Only one component to the absorption lines is seen; in particular no H2 absorption is seen at the radial velocity of the star. In the outer layers of the star one may expect the AG Dra nebula to cool sufficiently to form a significant layer of H2. We estimate an upper limit of cm-2 to the H2 column density of this layer from our non-detection.
The interstellar H2 absorption spectrum shows no lines from levels with , indicating relatively low excitation temperatures ( K). The H2 lines serve as useful fiducial marks for fixing the wavelength scale of the FUSE spectra as many of the lines are not saturated (unlike the atomic species). We adopt a velocity of km s-1 for the interstellar lines based on IUE spectra (Viotti et al., 1983).
In the following sections some references are made to the interstellar H2 lines, and we make use of the shorthand notation for referring to the H2 transitions introduced by Barnstedt et al. (2000). Thus, e.g., L13R3 refers to the to , R(3) transition of the H2 Lyman band; while W0R3 refers to the to , R(3) transition of the Werner band.
5.1 Line list
The only AG Dra emission lines previously reported in the FUSE wavelength band have been the O vi 1032, 1038 lines, and He ii 1085 (Schmid et al., 1999). The complete list of lines found in the FUSE spectrum is given in Table 2.
The measured wavelengths given for each line are those measured through Gaussian fits to the spectral lines, corrected to be placed in a reference frame where the interstellar absorption lines have a velocity of km s-1 – see Sect. 12. The spectrum with the largest effective area at the particular wavelength considered was used to derive the wavelengths. The LiF measurements (990–1187 Å) are all from the 2000 March observation, while the SiC measurements (905–1095 Å) are from the 2001 April observation. Two fluxes are given for each line, corresponding to the two measurement dates. The first SiC measurements are more uncertain due to short exposure times.
Line identifications have been based on solar spectra, in particular, the catalogs of Feldman et al. (1997) and Curdt et al. (2001). There are several lines in the AG Dra spectrum for which no obvious candidates from the solar spectra could be found. Some of these lines are identified here and are marked with a () – further details can be found in Sect. 11.
| measa | Fluxb ( erg cm-2 s-1) | rest | Ion | Transition | Wavelength | |
|---|---|---|---|---|---|---|
| (Å) | Mar. 2000 | Apr. 2001 | (Å) | Reference | ||
| 920.082 | – | 7 | 920.561 | He ii | Balmer (n=20) | 1 |
| 922.336 | – | 7 | 922.748 | He ii | Balmer (n=18) | 1 |
| 923.674 | – | 10 | 924.147 | He ii | Balmer (n=17) | 1 |
| 927.411 | 18 | 18 | 927.851 | He ii | Balmer (n=15) | 1 |
| 929.886 | 20 | 930.342 | He ii | Balmer (n=14) | 1 | |
| 932.989 | 64 | 48 | 933.378 | S vi | – | 2 |
| 933.449 | He ii | Balmer (n=13) | 1 | |||
| 936.929 | – | 11 | 937.394 | He ii | Balmer (n=12) | 1 |
| 942.068 | 35 | 33 | 942.513 | He ii | Balmer (n=11) | 1 |
| 944.100 | 19 | 15 | 944.523 | S vi | – | 2 |
| 948.843 | – | 15 | 949.329 | He ii | Balmer (n=10) | 1 |
| 958.241 | 68 | 56 | 958.698 | He ii | Balmer (n=9) | 1 |
| 972.917 | – | 4 | 973.35 | Ne vii | – | 3 |
| 976.603 | 9 | 8 | 977.020 | C iii | – | 4 |
| 989.388 | – | 9 | 989.787 | N iii | – | 2 |
| 991.078 | – | 7 | 991.564 | N iii | – | 2 |
| 991.795 | – | 24 | 992.363 | He ii | Balmer (n=7) | 1 |
| 992.298 | 18 | 14 | 992.731 | Ne vi | – | 5 |
| 996.671 | 29 | 26 | 997.169 | Ne vi | – | 5 |
| 998.812 | 140 | 135 | 999.291 | Ne vi | – | 5 |
| 1005.323c | 60 | 52 | 1005.789 | Ne vi | – | 5 |
| 1009.899 | 12 | 12 | 1010.323 | Ne vi | – | 5 |
| 1031.549 | 5290 | 3930 | 1031.926 | O vi | – | 6 |
| 1037.262 | 1750 | 1340 | 1037.617 | O vi | – | 6 |
| 1062.213 | 4 | – | 1062.664 | S iv | – | 2 |
| 1065.707 | 5 | 6 | 1066.195 | Fe iii | – () | 7 |
| 1072.527 | 13 | 6 | 1072.973 | S iv | – | 2 |
| 1073.068 | 3 | 5 | 1073.518 | S iv | – | 2 |
| 1084.004 | 240 | 229 | 1084.940 | He ii | Balmer (n=5) | 1 |
| 1124.264 | 6 | 8 | ? | |||
| 1136.003 | 27 | 18 | 1136.532 | Ne v | – | 8 |
| 1136.494 | 4 | 3 | ? | |||
| 1136.775 | 4 | 5 | ? | |||
| 1138.971 | 4 | 2 | 1139.494 | Fe ii | b – () | 7 |
| 1140.653 | 8 | 6 | 1141.172 | Fe ii | b – () | 7 |
| 1142.429 | 9 | 7 | 1142.956 | Fe iii | – () | 7 |
| 1145.080 | 62 | 45 | 1145.615 | Ne v | – | 8 |
| 1152.102 | 8 | 7 | ? | |||
6 Detection of Ne VII
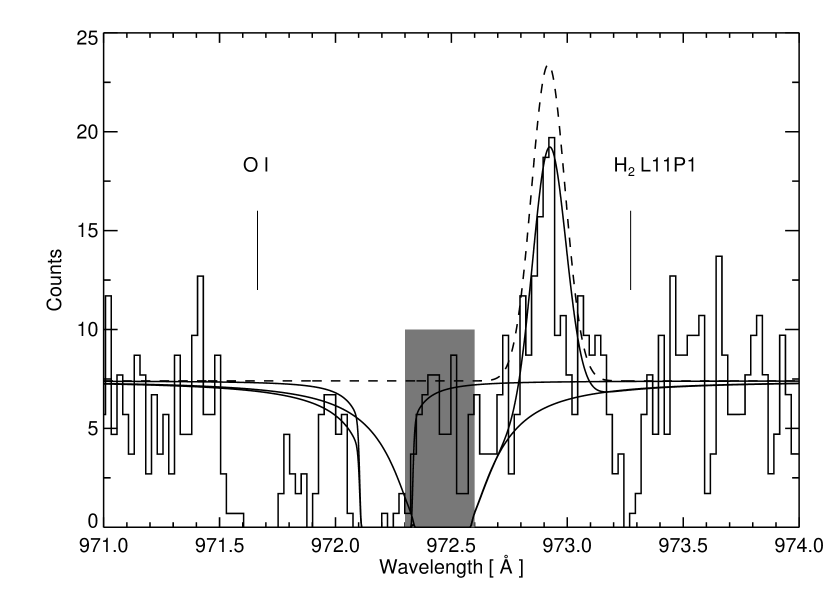
A weak line is detected at 972.917 Å which if corrected for the AG Dra systemic velocity using the measurement for the S vi 944 line (Sect. 12) gives a rest wavelength of 973.353 Å. This matches the 2s 2p – 2p2 transition of Ne vii which has been detected in the laboratory by Edlén (1983) at 973.35 Å and in solar spectra by Feldman et al. (1997). The transition is analogous to the O v 1371 line which is formed, at the low electron temperatures found in the nebula, by recombination from O vi (Sect. 10). The identification of the Ne vii line thus indirectly implies the existence of Ne viii in the AG Dra nebula.
The large radial velocity of AG Dra allows the Ne vii line to escape interstellar absorption by the H2 L11P1 transition at 973.348 Å, yet it pushes the line closer to the interstellar H i Ly absorption. Fig. 2 shows a comparison of the SiC2A spectrum with a model spectrum, demonstrating that the Ne vii line is not significantly absorbed by Ly. The model shows a uniform continuum, and the Ne vii 973.35 line, shifted by km s-1. Two components were required to model the Ly absorption. The first is at a velocity of km s-1 with a column density of cm-2 (a value of 10 km s-1 was chosen). This was estimated by fitting the damping wings of the H i Ly absorption line. The second component is at a velocity of km s-1 and has a column density of cm-2. This is required to fit the absorption between 972.1 and 972.3 Å and give the sharp edge at 972.1 Å.
No atomic data exist in the literature for interpreting the strength of the Ne vii line. We note that the flux is around a factor 10 weaker than the O v 1371 line (Mikołajewska et al., 1995). The solar photospheric O/Ne ratio is 5.6 (Grevesse & Sauval, 1998) and so the Ne vii flux is consistent, within an order of magnitude, if the oxygen nebula conditions and atomic data are extended to neon.
The implied existence of Ne viii in the AG Dra nebula is of great importance as the ionization potential of Ne+6 is 207.3 eV making it the highest ionization species ever found in the spectrum of AG Dra (e.g., the ionization potential of O+5 is only 113.9 eV). It thus probes a much deeper part of the nebula.
7 The O VI lines
The two O vi lines are the strongest lines in the FUSE spectrum and both show two distinctive features: asymmetric profiles and enhanced continuum at the bases of the lines. The 1038 line is affected by C ii 1037.018 and H2 L5R1 1037.146 interstellar absorption on the short wavelength side of the profile, which serves to make the flux ratio larger than the optically thin ratio of 2. The long wavelength side of 1038 is unaffected by the ISM and closely matches the shape and position of the 1032 line in velocity space.
7.1 Line profile
Fig 3(a) shows the 1032 line plotted on a logarithmic flux scale, which reveals a P Cygni-like profile for the line. On this plot we have overplotted a Gaussian profile derived from fitting only the continuum and the red side of the 1032 profile. Also shown is the expected position of the L6P3 H2 absorption line. Clearly there is a possibility that it is the H2 line giving rise to a false P Cygni profile. Fig 3(b) shows the actual spectrum divided by the computed Gaussian spectrum, revealing the absorption to be km s-1 wide. This is much larger than the width of other H2 lines in the spectrum – e.g., the nearby L6R3 1028.986 line has a FWHM of 30 km s-1 – and so we attribute the absorption to the O vi profile. The fact that the blue wing of the 1032 line is being absorbed (in addition to the continuum) shows that the O vi emitting region is an expanding, optically thick medium.
A P Cygni profile in the N v 1238 line seen in spectra from IUE was first reported by Viotti et al. (1983), and discussed later by Viotti et al. (1984), Lutz et al. (1987) and Kafatos et al. (1993). In all these cases the P Cygni profile was only found during the outburst phase of AG Dra. This may simply be due to the low signal-to-noise in the continuum during quiescent periods, however, and Viotti et al. (1984) note that the 1238 line “is always characterized by a sharper blue wing”, an asymmetry consistent with the profile found for O vi 1032 here. The significance of the O 6 profile in relation to the structure of the nebula is discussed in Sect. 14.


7.2 Electron scattering wings of the O VI doublet
The broad wings to the O vi profiles were measured previously by the ORFEUS echelle spectrograph (Schmid et al., 1999). They can be compared to the wings measured for the He ii 1640 line by IUE (Viotti et al., 1983). Possible instrumental causes of the wings (e.g., grating scattering or ‘bleeding’ of the detector electronics) can be ruled out by the presence of sharp interstellar absorption lines in the wings and the fact that the absorption in the C ii interstellar lines goes to zero. Schmid et al. (1999) suggested that the wings are caused by Thomson scattering of O vi photons from nebular electrons, and equated the width of the wings to an electron temperature of 30 000 K. Using the expression of Bernat & Lambert (1978) for electron scattering in a layer outside of the line formation region, together with the Thomson scattering redistribution function of Mihalas (1970) we find an optical depth of 0.04 and an electron temperature of 30 000 K fits the O vi 1032, 1038 line wings reasonably well (Fig. 4). These values of the optical depth and electron temperature can be used to estimate a size and density of the O vi region. Since , where is the optical depth, the Thomson cross-section, the electron density and the radius of the (assumed) spherical O vi emitting region, and the flux in the O vi 1032 line is related to and as (assuming the line is optically thin)

| (1) |
where is the distance to AG Dra, the line flux, the factor 0.83 represents the ratio of protons to electrons in a fully ionized plasma, the Planck constant, the speed of light, the wavelength, the abundance of element X relative to hydrogen, the population of the emitting level of the 1032 transition relative to the ion population, and is the radiative decay rate for the transition. The O/H abundance is obtained from Smith et al. (1996), who measured the photospheric abundance in the giant, while the value of was obtained from the model of O vi in the CHIANTI database (Young et al., 2003; Dere et al., 1997), assuming an electron temperature of 30 000 K, and an electron density of cm-3 (note that is independent of for the 1032 line, and so this choice does not affect the derived result). The value was also obtained from CHIANTI.
The two relations then imply
| (2) | |||||
| (3) |
Thus one has cm () and cm-3. Given the uncertainties in the various parameters, we estimate that these quantities are accurate to no better than a factor of 5. The density is an order of magnitude higher than that derived from the O iv density diagnostic (App. B), which one may expect if the O vi is formed in a deeper layer of the nebula.
This same calculation was performed by Viotti et al. (1983) when interpreting the broad wings of the He ii 1640 line observed by IUE during an active phase of the system. They ruled out the possibility of electron scattering on account of the large electron density ( cm-3) they derived which was inconsistent with the density of cm-3 derived from the IUE O iv density diagnostic (see also Appendix B). We note that using the 2500 pc distance to AG Dra instead of their 700 pc distance increases their He iii region radius to cm and decreases their density to cm-3, in reasonable agreement with the O vi numbers. The optical depth of the electron layer is much greater from the He ii line than from the O vi lines, although one may expect the opposite case as O vi will be formed much deeper inside the nebula. However, Mikołajewska et al. (1995) found the AG Dra nebula to be larger during outburst, when the Viotti et al. (1983) measurement was made, which would thus lead to a larger optical depth.
Another possibility for the broad wings is that they represent the thermal emission of a fast wind with speeds 1000–2000 km s-1. Such a scenario is presented in the AG Peg observation of Nussbaumer et al. (1995), however in this case the broad wings are accompanied by a P Cygni profile in the N v 1238 line that extends out to velocities km s-1. For AG Dra, the P Cygni absorption reaches only km s-1, and so it is unlikely that the broad wings are due to a fast wind. In addition AG Peg has a history of high velocity Wolf-Rayet features (Kenyon et al., 1993) while AG Dra has no such history.
8 Ne VI lines
The five Ne vi – intercombination lines are prominent in the AG Dra spectrum between 992 and 1010 Å. The 992 line is the weakest of the multiplet and found in the wing of He ii 992.363. Due to the large radial velocity of AG Dra the Ne vi 1005.696 line is almost exactly coincident with the L8P2 H2 1005.397 Å interstellar absorption line, leading to a double-peaked profile for the emission line. The Ne vi 1010.247 line is truncated on the short wavelength side of the profile by the H2 W0Q1 1010.132 absorption. The 997 and 999 lines are free from interstellar absorption and blending, and their ratio potentially allows a constraint on the nebular electron density to be made (Espey et al., 1996).
The model we use for the Ne vi ion employs the electron excitation and radiative decay rates from v.4 of the CHIANTI atomic database (Young et al., 2003; Dere et al., 1997). Proton excitation rates are also included, but are negligible for the low temperatures found in nebular conditions. An important process to account for is photon excitation by the white dwarf radiation field. A star of effective temperature 1– K emits predominantly in the extreme ultraviolet, between wavelengths 100–600 Å. The strong – resonance transitions of Ne vi have energies between 400–600 Å and so will be strongly pumped by such a radiation field at distances close to the star.
Photon excitation can be accounted for in v.4 of CHIANTI through specifying a black body radiation field of temperature , and the distance from the star’s centre, , measured in stellar radii units (Young et al., 2003). For the AG Dra model, we consider two temperatures: the value of 100,000 K derived by Mikołajewska et al. (1995) from fits to the UV continuum measured by IUE; and the value of 170,000 K derived by Greiner et al. (1997) from X-ray data from ROSAT. An electron temperature of 25,000 K is assumed. Figs. 5a,b show the effects on the Ne vi 997/999 ratio for each temperature. The four curves in each plot correspond to different values of . The shaded region on each plot denotes the measured ratio, with 1 error bars. It is clear that the observed 997/999 ratio is incompatible with the Ne vi ions being located at 500 white dwarf radii () from the white dwarf, and thus photoexcitation has a weak effect on the level populations. For a white dwarf radius of 0.1 (Mikołajewska et al., 1995), this places the Ne vi ions at least 50 from the white dwarf and a significant way towards the giant at around 300 (Mikołajewska et al., 1995). The ionization potential of Ne+4 is 126.2 eV, which compares with 113.9 eV for O+4, thus implying that the O vi emission is from regions even further from the white dwarf. One can thus rule out the suggestion (e.g. Viotti et al., 1983; Mikołajewska et al., 1995) that He ii and N v emission is from very close to the white dwarf.
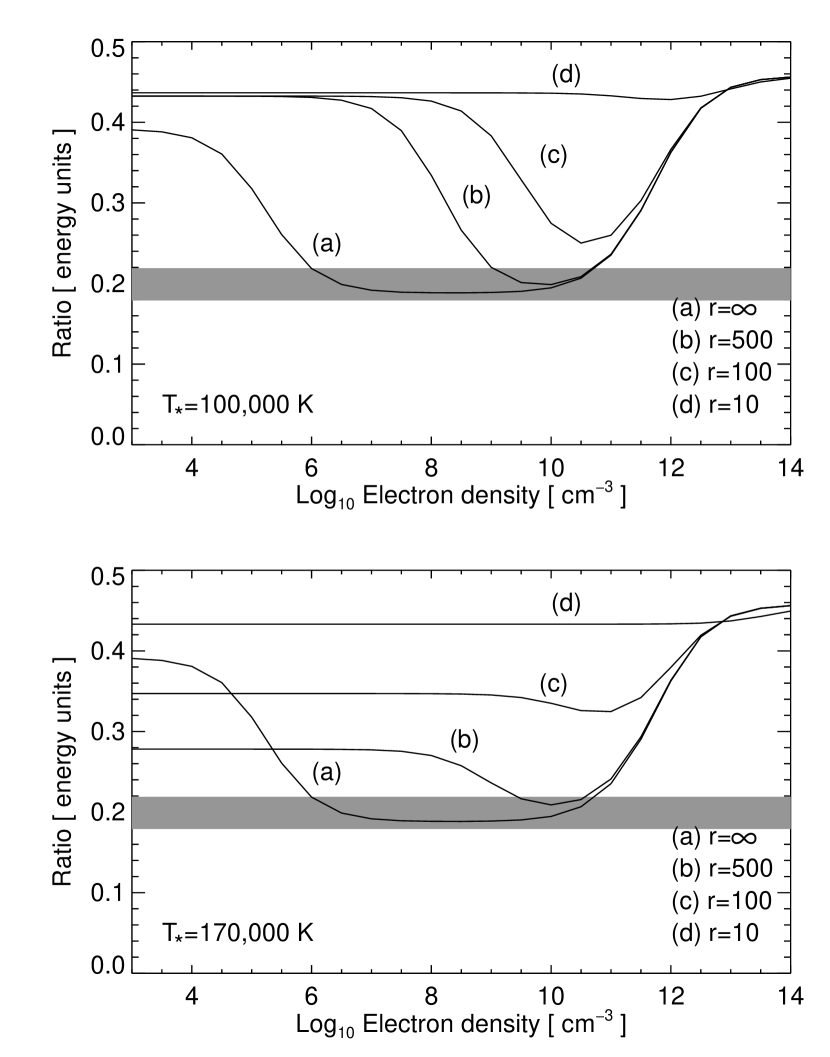
Our Ne vi model can be affected if the actual white dwarf spectrum deviates significantly from a black body. In particular, the very transitions that are pumped in the Ne vi ion are likely to appear as absorption features in a hot white dwarf atmosphere. A Kurucz spectrum calculated for an effective temperature of 100,000 K and , with solar abundances, shows Ne vi absorption lines whose depth at line center is around 30-60% of the continuum level. Thus photoexcitation may be overestimated by a factor of 2–3 in the black body model. We thus suggest that the 997/999 ratio constrains the Ne vi ions to be formed at a distance of at least 300 white dwarf radii.
In the case of a negligible radiation field, the electron density is restricted to the range . Increasing the radiation dilution factor narrows the allowed densities towards the higher end of this range, with the case of implying densities of cm-3. This is consistent with densities derived from the intercombination transitions of O iv, measured with IUE Viotti et al. (1983). Fluxes obtained with IUE are reassessed in Appendix B with the most recent atomic data from CHIANTI. A density of 1010 cm-3 is derived.
9 The He II recombination lines
The Balmer series of He ii (transitions n2, n3) provide many emission lines in the AG Dra spectrum, from the n=5 line at 1085 Å to the n=20 line at 920 Å. The even members of the sequence lie close in wavelength to the H i Lyman series, at around 0.3 Å shortward of the H i lines. This, combined with the km s-1 blueshift of the stellar lines compared to the interstellar absorption, is sufficient to make all lines from n=6 and above observable. Coincident blends with other interstellar absorption species prevent the strongest n=6 and n=8 lines being observed, but the n=10, 12 and 14 lines are all visible. These three lines are factors of 2–3 weaker than expected from the odd members of Balmer sequence and are blueshifted relative to these lines by 5–10 km s-1 (Sect. 12). This behaviour is puzzling. The reduced fluxes are not due to an intrinsic property of the He ii ions as recombination does not favor odd over even members of the sequence. Any absorption (either stellar or interstellar) must occur on the long wavelength sides of the lines to give rise to the observed blueshifts. The natural candidate is absorption through the damping wings of the hydrogen lyman lines. However, both the 937 and 949 lines show continuum on their long wavelength sides which is at the same level as the continuum in the rest of the spectrum, ruling out absorption by the H i lines.

The strongest of the He ii lines at 1085 is affected by interstellar absorption in the N ii 1084.566, 1084.584 lines which result in an asymmetric appearance to the 1085 profile. We estimate that the absorption removes around 30% of the He ii flux.
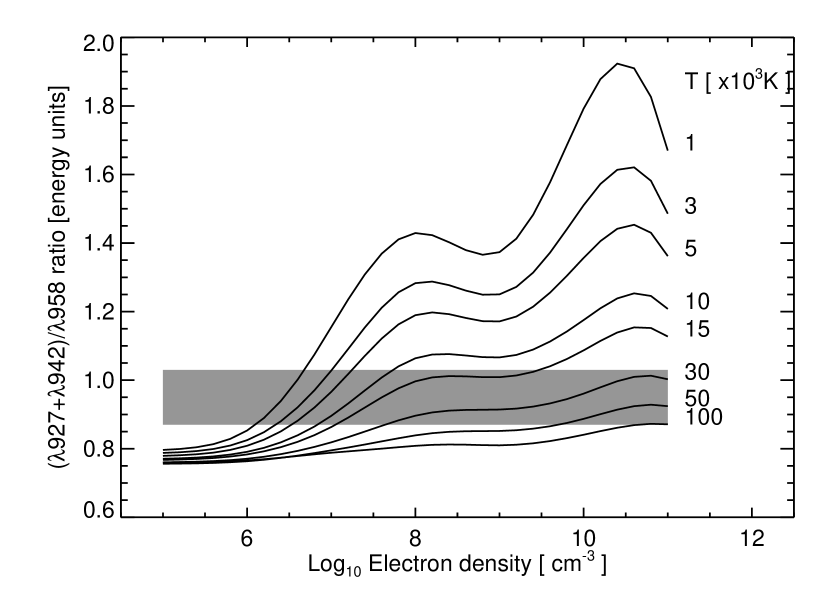
The He ii Balmer lines can be used to place constraints on the density and temperature of the nebula. Storey & Hummer (1995) provide emissivities for all of the lines up to n=50, calculated assuming Cases A and B of Baker & Menzel (1938) over a wide range of temperatures and densities. Case A requires the He ii Ly line to be optically thin, which is not applicable for the AG Dra nebula on account of the high densities. We consider the lines 958, 942 and 927 (n=9, 11, and 15, respectively) which are unblended and not contaminated by interstellar absorption. The closeness of the three lines in wavelength minimizes any distortions in the line ratios due to dust extinction.
Fig. 7 plots the theoretical variation of the (927+942)/958 ratio with density for a wide range of temperatures. Also plotted is the observed ratio derived from combining the SiC1B and SiC2A spectra from the 2001 April observation, and which has a value of . It is clear that low nebula temperatures ( K) are ruled out unless the density is also low ( cm-3), while for hotter nebula temperatures low densities are ruled out. Other plasma diagnostics (Sects. 10 and Appendix B) suggest a density of cm-3 and a temperature of K and these values are in reasonable agreement with the He ii lines.
The He ii lines can also be useful in determining the extinction towards AG Dra. We consider the 958, 1085 and 1640 lines (n=9, n=5 and n=3, respectively), the latter of which was observed many times with IUE and was found to have a flux between and erg cm-2 s-1 during the quiescent phase of AG Dra (González-Riestra et al., 1999). Assuming no extinction and nebula conditions of K and cm-3, Storey & Hummer (1995) predict 1640/958 and 1640/1085 ratios of 24.2 and 5.49, respectively. Including the full range of variability of the 1640 line gives upper and lower limits of 143 and 36 for 1640/958, and 24 and 6.0 for 1640/1085 (adjusting the 1085 flux for interstellar absorption). These values show the observed 958 and 1085 lines are weaker than expected from the 1640 line, consistent with a non-zero . Assuming a more precise 1640 flux of based on the orbital phase of the 2001 April observation, and the extinction curve of Fitzpatrick (1999) allows us to estimate an value of 0.10 for AG Dra. This value is significantly higher than that found by Mikołajewska et al. (1995), but we note that the Fitzpatrick (1999) extinction curve is an extrapolation to FUSE wavelengths based on observations made above 1200 Å and so may be in error.
10 The Nebula Temperature
Methods for determining the electron temperature in the nebulae of symbiotic stars from emission line ratios are discussed in Sect. 3 of Nussbaumer (1987), with reference to IUE spectra. Temperatures for the nebulae were typically found to be 20,000 K, indicating that the radiation field from the hot component of the symbiotic dominates the ionization balance of the plasma, rather than electron collisions. The FUSE wavelength range opens up further diagnostic possibilities, and the use of O vi and C iii lines to constrain the plasma temperature are discussed below.
10.1 O VI, O V temperature diagnostic
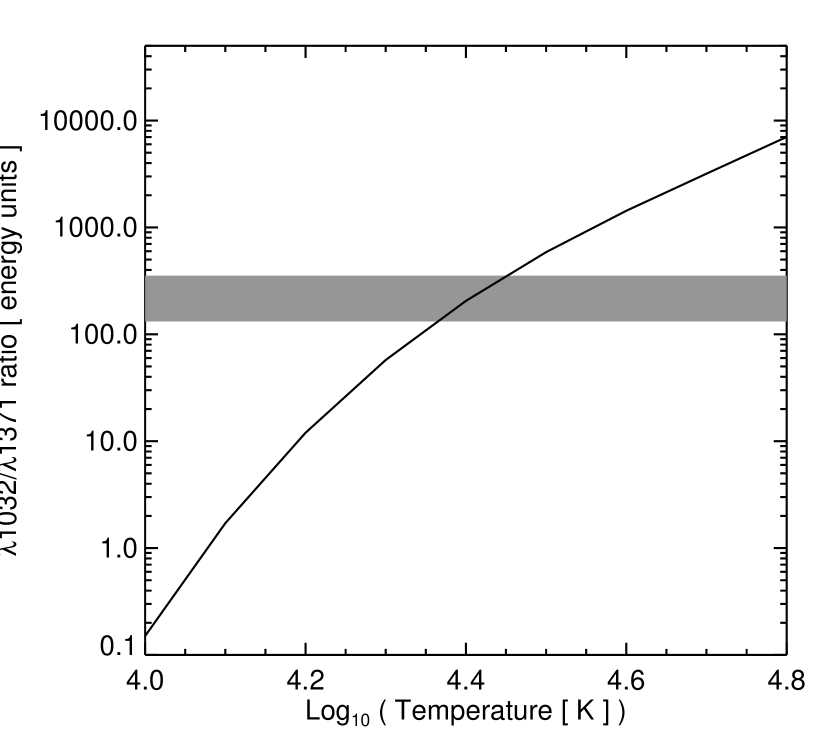
In a highly-ionized photoionized plasma such as the AG Dra nebula, it is possible to use the O vi 1032 and O v 1371 emission lines to determine the nebula temperature. For electron temperatures K the – transition of beryllium-like ions (e.g., O v 1371) is predominantly formed through dielectronic recombination from the lithium-like ion (e.g., O vi) into the level. The emissivities of such recombination lines vary slowly with temperature. In contrast, for emission lines excited directly through electron collisions, the emissivity falls sharply with temperature on account of the Maxwellian term in the expression for the excitation rate coefficient. For temperatures K, the 1032 line is sufficiently strong that it remains electron-excited rather than recombination-excited, and so the O vi 1032/O v 1371 ratio is an excellent temperature diagnostic, independent of the relative concentrations of the two ions.
Recombination data suitable for predicting the strength of the O v 1371 line are from Nussbaumer & Storey (1984), while data for the 1032 line are from v.4 of the CHIANTI database (Young et al., 2003). The 1032/1371 ratio varies by several orders of magnitude over a small temperature range (Fig. 8), providing a tight constraint to the electron temperature. Measurements of the 1371 line at different orbital phases of AG Dra were presented by Mikołajewska et al. (1995). Using these values together with the O vi 1032 flux from FUSE gives the ratio indicated in Fig. 8, yielding a temperature of K, in good agreement with the temperature of 30,000 K derived from the electron scattering wings on O vi line profiles.
10.2 C III
C iii gives rise to two dominant spectral features in the FUSE waveband: the – transition at 977.020 Å and the set of six – transitions between 1174 and 1176 Å. These lines together with the 1909 line observed by IUE potentially allow both the temperature and density of the plasma to be estimated.
The 977 profile from the 2001 April observation is displayed in Fig. 9 and shows the emission line to lie within a deep absorption trough in the white dwarf continuum. The absorption on the long wavelength side of the profile is due to C iii in the interstellar medium – the AG Dra emission line is saved on account of the high radial velocity of the system. To the short wavelength side is the O i 976.448 interstellar absorption line. The centroid of the emission line is redshifted by –15 km s-1 relative to other species indicating that it is partially absorbed by the ISM components.
The 1176 feature is not detected (Fig. 9) and we estimate an upper limit to the flux of erg cm-2 s-1. The 1909 was detected by IUE, and Mikołajewska et al. (1995) give quiescent fluxes of 1–4 erg cm-2 s-1.

Fig. 10 shows the theoretical variation of the 1176/977 and 1176/1909 ratios, derived from the CHIANTI database. In each case the ratios are plotted at two temperatures: 80,000 K and 25,000 K, the former corresponding to the temperature of maximum abundance of C iii assuming an electron-ionized plasma, and the latter the temperature derived in Sect. 10.1 for the O vi region of the AG Dra nebula.
The measured 977 flux is a lower limit as the extent of interstellar absorption is not known. The resulting 1176/977 ratio can thus not discriminate the temperature of the plasma. Using the lowest of the measured 1909 fluxes, the upper limit to the 1176/1909 ratio is overplotted in Fig. 10(b). Clearly the ratio is incompatible with a temperature of 80,000 K. A deeper exposure of the 1176 line together with a simultaneous and more accurate measurement of the 1909 line are required to improve the constraints on nebula temperature.

11 Fluoresced and unidentified lines
There are several emission lines in the AG Dra spectrum for which no obvious identifications could be found based on solar spectra. These lines are listed in Table 3, together with their wavelengths corrected by a velocity shift of km s-1, which is the velocity of the Ne v 1136 line. The corrected wavelengths should be within 10 km s-1 of the laboratory wavelengths of the transitions.
| Measured | Corrected |
|---|---|
| wavelengths | wavelengths |
| (Å) | (Å) |
| 1065.752 | 1066.141 |
| 1136.494 | 1137.010 |
| 1136.775 | 1137.291 |
| 1138.971 | 1139.488 |
| 1140.653 | 1141.171 |
| 1142.429 | 1142.948 |
| 1152.102 | 1152.625 |
As many unidentified emission lines exist in the UV spectrum of the symbiotic nova RR Telescopii that were later identified as Fe ii transitions fluoresced by the strong nebular lines (Johansson, 1988), we searched for Fe ii lines in the FUSE bandpass that could be similarly excited. We initially searched for the lines identified by Harper et al. (2001) who found many Fe ii lines fluoresced by H i Ly in the FUSE spectrum of the hybrid supergiant TrA. None of the unidentified FUSE lines matched the Harper et al. list. In particular, the 1133.70 Å and 1139.02 Å lines, pumped via a line only 0.182 Å from Ly line center, are not present implying either a narrow Ly line of FWHM 0.36 Å, or that the Ly line is formed far from the surface of the giant.
In order to find other fluorescence lines in the FUSE waveband a simple model was developed to predict spectra arising through radiative pumping of Fe ii and Fe iii by a Gaussian shaped emission line at a specific wavelength. The model calculates the quantity
| (4) |
where , and are indices for the Fe ii levels such that the transition is the transition pumped by the emission line and is the subsequent radiative decay; is the intensity of the fluorescing emission line profile at wavelength ; is the population of level relative to the ion population; the radiative decay rate for transition ; and is the statistical weight of level . The model allows the centroid and width of the fluorescing emission line to be varied. The are distributed according to the Boltzmann distribution, and the energy level and radiative data for Fe ii and Fe iii are from the compilations of R.L. Kurucz, available at http://cfaku5.harvard.edu/.
We considered pumping of both Fe ii and Fe iii by the O vi 1032, 1038 doublet, and Table 4 shows the model predictions. A 1038/1032 ratio of 1:2 was assumed, and the full width at half maxima of the O vi lines was taken as 0.30 Å. For both Fe ii and Fe iii there is only one significant transition that is pumped by the O vi lines; the resulting fluoresced lines thus have relative fluxes determined purely by the radiative decay rates for the transitions.
The Fe ii lines fluoresced by 1032 are all pumped through the same Fe ii transition. The 1776, 1881 and 1884 lines have been identified by Johansson (1988) in IUE spectra of RR Tel and have also been measured in IUE spectra of AG Dra by Viotti et al. (1983) although the authors did not identify the transitions. The strongest of the predicted lines below 1200 Å is at 1141.172 Å which provides an excellent match with one of the AG Dra lines (Table 3). Another good wavelength match is found for the 1139.494 transition, however, the predicted 1139/1141 ratio is much lower than the observed ratio. None of the other transitions can be identified in the AG Dra spectrum.
Applying the same model to Fe iii yields two lines whose wavelengths are close to measured lines: 1066.195 and 1142.956. The latter is the strongest of the predicted lines in the FUSE waveband and is in excellent wavelength agreement with the line measured at 1142.429 Å. The predicted 1070.557 line would be expected at a wavelength of 1070.16 Å which is coincident with the H2 L3P3 1070.142 interstellar absorption line and so is not seen. Although the model 1066.195 line is expected to be much weaker than the 1070.557 and 1142.956 lines, there is a weak line found at a corrected wavelength of 1066.166 Å which we identify with this transition.
We conclude that two of the unidentified lines can be identified as Fe ii 1141.172 and Fe iii 1142.429, fluoresced by O vi 1032. Two more lines can be tentatively identified as Fe ii 1139.494 and Fe iii 1066.195 based on wavelength matches, although the theoretically predicted fluxes are weaker than the observed values. As Fe ii and Fe iii are extremely complex ions, there is the possibility that the atomic data used in the theoretical model may cause the discrepancy in the fluxes.
| Pumping line | Pumped transition | Fluoresced transitions | Relative flux |
|---|---|---|---|
| (Å) | (Å) | ||
| Fluoresced Fe ii lines | |||
| O vi 1032 | 1032.041 | 978.697 | 6.8 |
| 981.468 | 5.5 | ||
| 1114.355 | 1.8 | ||
| 1126.677 | 2.8 | ||
| 1139.494 | 1.3 | ||
| 1141.172 | 10.0 () | ||
| 1142.370 | 2.8 | ||
| 1776.421 | 2.5 | ||
| 1776.660 | 14.4 | ||
| 1881.201 | 16.7 | ||
| 1884.116 | 11.3 | ||
| O vi 1037 | 1037.808 | 1448.393 | 1.3 |
| 1663.782 | 0.7 | ||
| Fluoresced Fe iii lines | |||
| O vi 1032 | 1032.119 | 1066.195 | 1.5 |
| 1070.557 | 9.1 | ||
| 1142.956 | 10.0 () | ||
| 2097.696 | 30.4 | ||
| O vi 1037 | 1037.459 | 1035.769 | 1.4 |
| 1071.747 | 0.6 | ||
| 1142.461 | 0.7 | ||
| 2103.809 | 1.9 | ||
12 Emission line widths and shifts
Friedjung et al. (1983) reported systematic redshifts of resonance lines relative to intercombination lines from IUE spectra of seven symbiotic stars (including AG Dra), with magnitudes ranging from 10 to 40 km s-1. The values given for AG Dra were 12 to 15 km s-1. Viotti et al. (1984) gave a redshift of 9 km s-1 from their quiescent IUE spectra, but also noted that the N v 1238, 1242 doublet exhibited a larger redshift of 30 km s-1 relative to the intercombination lines. The first direct measurement of the O vi lines by Schmid et al. (1999) yielded a redshift of 49 km s-1 relative to the system radial velocity for the 1032 line.
The cause of these redshifts has been attributed to the scattering of line photons in an expanding medium (Friedjung et al., 1983), and this also explains the asymmetries noted in IUE spectra of the N v lines (Mikołajewska et al., 1995) and the O vi lines found here.
Before discussing the FUSE results, the accuracy of the FUSE wavelength scale must first be considered. Due to the lack of an on board calibration lamp, the absolute wavelength calibration of FUSE is good to km s-1 for observations with the LWRS aperture due to motions of the target within the aperture, and the thermally-induced grating rotation111The FUSE Wavelength Calibration White Paper, http://fuse.pha.jhu.edu/analysis/calfuse_wp1.html.. The relative wavelength calibration within a single spectrum is accurate to around 5–10 km s-1. In order to determine the absolute wavelength scale of the spectra it is thus necessary to measure features in the spectra for which the wavelengths are known through other methods. Typically one uses interstellar absorption lines for which velocities are known from IUE or HST spectra. For AG Dra we use the interstellar velocity measured by Viotti et al. (1983) of km s-1 from IUE spectra using low ionization species. For each of the FUSE spectra several interstellar absorption lines are selected and their centroids are measured through line fitting. If the average velocity of these lines relative to their rest wavelengths is , then we apply a correction of km s-1 to that spectrum. The lines selected in each spectrum were based on the spectra of Barnstedt et al. (2000).
The velocities of selected emission lines are presented in Table 5. For the asymmetric 1032 line the centroid was estimated through minimizing the quantity
| (5) |
where is the flux in the wavelength bin .
| Ion | Line | Velocity shift | Commenta |
|---|---|---|---|
| (Å) | (km s-1) | ||
| He ii | 920.561 | L18P2 920.242 (r) | |
| 922.748 | |||
| 923.796 | |||
| 927.851 | |||
| 930.342 | |||
| 937.394 | L16P3 936.859 (b) | ||
| 942.513 | |||
| 949.329 | |||
| 958.698 | |||
| S vi | 944.523 | ||
| C iii | 977.020 | O i 976.448 (b), C iii 977.020 (r) | |
| Ne vi | 992.731 | ||
| 997.169 | |||
| 999.291 | |||
| 1005.789 | L8P2 1005.397 | ||
| O vi | 1031.926 | ||
| 1037.617 | C ii 1037.020 (b) | ||
| S iv | 1062.664 | ||
| 1072.973 | |||
| Ne v | 1136.519 | ||
| 1145.607 |
The Ne v and Ne vi lines are intercombination transitions, and are found at velocities of – km s-1. Aside from the O vi lines that are affected by P Cygni profiles, the other resonance lines are from S vi and S iv, which are consistent with the intercombination lines. Thus there is no indication from the FUSE spectra that the resonance lines are redshifted relative to the intercombination lines. The consistency of the S vi velocity shift with the intercombination lines reveals that this high ionization state is not showing a P Cygni absorption, restricting the size of the region participating in the wind.
The He ii Balmer lines are all significantly blueshifted relative to the other emission lines, which may indicate that the model assumed in deriving the rest wavelengths is in error (Appendix A).
The centroid of the O vi 1032 line is redshifted relative to the systemic velocity by 39 km s-1 in reasonable agreement with the value of 49 km s-1 found by Schmid et al. (1999).
Accurate measurements of emission line widths require good signal-to-noise relative to the continuum level, and so we give values only for the strongest lines in the spectrum in Table 6. The O vi width represents that of the observed profile. One can estimate the true width of the line by assuming that it would have a shift comparable to the other emission lines in the spectrum of km s-1, leading to a width of km s-1. One may speculate that the broader width found for Ne vi compared to Ne v may be due to the Ne vi ions participating in the wind seen in the O vi profile.
| Ion | Wavelength (Å) | Width (Å) | Width (km s-1) |
|---|---|---|---|
| He ii | 958 | 0.177 | 55.4 |
| Ne vi | 999 | 0.257 | 77.1 |
| O vi | 1032 | 0.218 | 63.3 |
| Ne v | 1136 | 0.192 | 50.7 |
13 Time variability
Including the present observations, the 900–1200 Å region of the AG Dra spectrum has now been observed four times, and the fluxes of the prominent emission lines are given in Table 7. The ORFEUS-I/BEFS fluxes have been derived from the archived spectra available via the Multimission Archive at STScI (MAST)222http://archive.stsci.edu/mast.html, while the ORFEUS-II/TUES fluxes are taken from Schmid et al. (1999).
Monitoring of AG Dra with IUE showed that the emission lines are modulated by a factor two during the orbit, with the strongest fluxes at phase 0.5 (González-Riestra et al., 1999), when the white dwarf is in front of the giant. Both ORFEUS measurements of the O vi and He ii lines lie above the FUSE values, even though the 2000 March data were obtained close to phase 0.5. This suggests that the two ORFEUS measurements were not taken during periods of quiescence, and this is confirmed by inspection of Fig. 7 of Gális et al. (1999) where the U band flux is enhanced above quiescent levels at Julian dates 2 449 249 and 2 450 409, corresponding to the ORFEUS observations.
Comparing the line fluxes from the two FUSE observations shown in Table 2 shows that the O vi lines show the largest decrease in the 2001 April data-set, being reduced by 25%. This is consistent with the factor of 2 modulation during the entire AG Dra orbit found by González-Riestra et al. (1999). The Ne vi lines which have a comparable excitation potential to the O vi lines show a much smaller decrease in flux of around 10%. This may indicate that the changes in the O vi flux may signal variations of the optical depth with orbital phase.
There was no variability beyond 2 levels observed during 2 ksec of the FUSE observations of the O vi lines, despite there being counts s-1 in the LiF1A channel.
| Flux ( erg cm-2 s-1) | ||||
|---|---|---|---|---|
| ORFEUS-I | ORFEUS-II | FUSE | ||
| Phase: | 0.723 | 0.833 | 0.036 | 0.277 |
| Line | ||||
| O vi 1032 | 8610 | 6210 | 5290 | 3930 |
| He ii 1085 | 536 | 248 | 240 | 229 |
| Ne vi 999 | 448 | – | 140 | 135 |
| Ne v 1136 | 34 | – | 27 | 18 |
14 Discussion
The previous sections have presented FUSE spectra obtained in 2000 March and 2001 April during a quiescent phase of AG Dra’s 15 year outburst cycle. These represent the first high resolution, high sensitivity spectra obtained in the 905–1187 Å spectral region for AG Dra. The high ionization states found in the FUSE bandpass reveal significant new information about the system, unavailable from earlier, longer wavelength IUE spectra. In particular, the presence of the Ne vii 973 recombination line implies the existence of Ne viii in the nebula, the highest ionization species ever recorded for AG Dra. The O vi 1032 line has a P Cygni profile, demonstrating a wind in the high ionization part of the nebula during quiescence. Previously P Cygni profiles had only been seen in IUE spectra obtained during outbursts. The Ne vi intercombination lines are sensitive to the radiation field of the white dwarf and their ratios imply that the Ne vi emitting region (and thus also the O vi emitting region) is at least 300 white dwarf radii (or 0.14 AU for ) from the white dwarf. Evidence for the O vi being formed far from the white dwarf is also found from the Fe ii and Fe iii fluorescence lines: the O vi resonance lines are capable of fluorescing iron lines in the giant’s atmosphere, whereas H i Ly is not, suggesting O vi is formed close to the giant’s surface, while Ly is formed much further out.
The classical view of symbiotic nebulae has material flowing out from the giant and being ionized in the vicinity of the white dwarf. High ionization species (such as He ii and O vi) are found in the region around the white dwarf (e.g. Friedjung et al., 1983), while low ionization species are formed at increasingly further distances. An alternative theory is that the strong nebular lines in high density systems such as AG Dra are formed in the illuminated part of the giant’s atmosphere, helping to explain the orbital modulation of the UV line fluxes found from IUE (e.g., Altamore et al., 1981). Proga et al. (1996, 1998) have created non-LTE photoionization models for the ionization of a giant’s atmosphere in the case where it is illuminated by a hot companion star and have demonstrated that the general features of symbiotic star spectra can be reproduced with high effective temperatures and luminosities of the companion. The large emission line fluxes of highly-ionized species can only be reproduced if the giant has a wind extending to 2–3 giant radii.

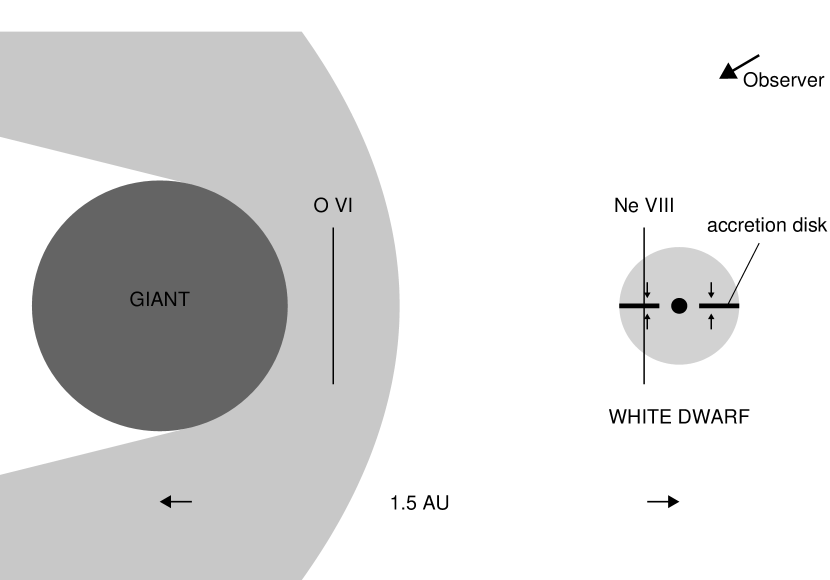
Evidence for the O vi lines being formed in the giant’s atmosphere comes from the aforementioned Ne vi result and Fe fluorescence lines. We can also consider the location of the Ne vi, viii and O vi ions in the system through ionization balance arguments. The high ionization potential of these ions means that they are produced through irradiation from the X-ray section of the white dwarf’s radiation field. Fits to the measured X-ray spectrum (Greiner et al., 1997) are consistent with a blackbody field of temperature 170,000 K. By constructing a simple model of the ionization/recombination processes in the plasma (Appendix C) we can calculate the fractional population of Ne vi and O vi as a function of distance from the white dwarf (Fig. 11). The distance here corresponds to the inner face of a nebular shell, and the model assumes that the radiation field is unattenuated between the white dwarf and inner face. It is clear that such a hot blackbody prevents O vi and Ne vi being formed out to distances of 0.5–1.0 AU. For the model of AG Dra presented in Fig. 9 of Mikołajewska et al. (1995) this places the O vi and Ne vi regions close to the surface of the giant, and well away from the white dwarf. Ne viii, however, must be formed much closer to the white dwarf. A cartoon illustrating the structure of the AG Dra nebula is shown in Fig. 12. A difficulty for this particular model lies in the P Cygni profile of the O vi line, since the continuum in the far ultraviolet is due to the white dwarf and not the giant: for white dwarf continuum photons to be absorbed by O vi at orbital phase 0.5 (white dwarf in front of the giant), the O vi ions are required to lie in front of the white dwarf along the observer’s line of sight. We note however, that the electron scattered wings around the O vi lines significantly enhance the continuum (Fig. 4), and that the P Cygni absorption extends down to around erg cm-2 s-1, the level of the white dwarf continuum, and not to zero flux. We thus suggest that the O vi ions are absorbing the electron-scattered O vi photons and not the stellar continuum. This can be understood if the electron scattering is occurring in the densest part of the O vi region close to the giant, with the absorption of the scattering wings then occuring in the lower density, extended wind. The high density of cm-3 derived from the analysis of the wings in Sect. 7.2 supports this idea.
A full understanding of the structure of the AG Dra nebula can only come through detailed modelling of the ionization and wind structure, constrained by high quality spectral data.
Appendix A Rest wavelengths of FUSE emission lines
A.1 Ne V
The two Ne v lines seen in the FUSE spectrum arise from decays of the 2p 5S level to the ground 2s levels. The separation of the two ground levels is strongly constrained by the measurement of the – transition wavelength from SWS spectra obtained with ISO by Feuchtgruber et al. (1997). They find a wavelength of 14.32170.0002 m.
The UV lines have only previously been measured by space-borne, solar UV spectrometers. Sandlin et al. (1977) give wavelengths of 1136.510.02 Å and 1145.610.02 Å. Edlén (1985) made use of these wavelengths to refine the energy levels of Ne v, leading to revised wavelengths of 1136.51 Å and 1145.59 Å. More recently, the SUMER instrument on board SOHO has measured the lines. Feldman et al. (1997) give wavelengths of 1136.52 Å and 1145.62 Å from off-limb spectra, while Curdt et al. (2001) give wavelengths of 1136.56 Å and 1145.66 Å from disk spectra. The off-limb spectra are hampered by blending with coronal lines, though, while disk spectra of solar transition region lines typically show redshifts of 5–10 km s-1 (e.g., Peter & Judge, 1999). A detailed reassessment of SUMER disk spectra (Curdt 2001, private communication) yields revised wavelengths of 1136.5510.020 Å and 1145.6320.010 Å. We correct these assuming a redshift of 5 km s-1 and use the error estimates from the UV and IR wavelength measurements to minimize the energy level separations of the three levels. These yield new wavelengths for the UV lines of 1136.532 Å and 1145.615 Å which are used in the AG Dra analysis.
A.2 Ne VI
As with the Ne v lines, the Ne vi intercombination lines have only been measured in solar spectra. The most recent determination of the lines’ wavelengths is that of Dwivedi et al. (1999) from off-limb SUMER spectra. However, these wavelengths show a serious discrepancy with the measurement of the Ne vi ground transition wavelength of Feuchtgruber et al. (1997) from the SWS instrument on ISO. In particular the Dwivedi et al. wavelengths for the – transitions imply, when combined with the Feuchtgruber et al. (1997) wavelength, that the – transitions occur at 1005.777 Å and 1010.303 Å. Dwivedi et al. actually measure the latter lines at wavelengths 1005.696 and 1010.247 Å – differences of 0.081 Å and 0.056 Å that are much larger than the 0.015 Å accuracy quoted by Dwivedi et al. (1999).
Analysis of more recent SUMER spectra (W. Curdt, private communication, 2001) with updated calibration files has resulted in revised wavelengths for the Ne vi lines giving values of 992.731, 997.169, 999.291, 1005.789 and 1010.323 Å. These values have been used in the AG Dra analysis.
A.3 He II
Each of the He ii Balmer series lines consists of seven individual transitions that, in terms of wavelength, can be split into two groups. E.g., for the n=5 transitions the groups are at average wavelengths of 1084.912 Å and 1084.977 Å (based on data from the NIST database) – i.e., a velocity separation of 18.0 km s-1. In order to compare the velocity shifts of the He ii lines with those from other ions, it is necessary to model how the individual line components contribute to the total line flux.
Clegg et al. (1999) provides such a model for the He ii 1640 (n=3) and 1215 (n=4) lines, yielding estimates of the line centroids for a range of temperatures and densities, and for Cases A and B of Baker & Menzel (1938). We extend this model for 5 n 20 with the method outlined in Sect. 3 of Clegg et al. (1999), atomic data from Storey & Hummer (1995), and -values calculated with the FORTRAN routine described by Storey & Hummer (1991). Energy level data were obtained from NIST. For n12, energy values were not available for all of the 2P, 2D and 2S levels. However, the wavelength splittings of the individual line components are largely determined by the splitting of the n=2 levels for these high n levels.
To determine the expected wavelengths of the He ii Balmer lines for AG Dra, an electron density of cm-3 and a temperature of K were assumed together with Case B. The emissivities and wavelengths of the seven individual line components were calculated, and a combined synthetic profile was computed by assuming lines broadened by 50 km s-1. The resulting profile was then fit with a Gaussian, the centroid of this fit is the wavelength that is listed in Table 2.
Appendix B Revised O IV density from IUE data
O iv belongs to the same isoelectronic sequence as Ne vi, and the intercombination transitions that occur for Ne vi in the FUSE waveband are found for O iv between 1397 and 1408 Å. These lines form ratios that are sensitive to the electron density between and cm-3, and Fig. 13 shows the ratios, relative to the strongest 1401 line, calculated from the CHIANTI database at an electron temperature of 25 000 K. Measurements of the O iv lines were made by IUE and the high resolution mode of the satellite allowed the individual transitions to be measured. Two data-sets with good measurements of the lines are from 1981 August 3 and 1983 June 7. The former was obtained several months after the system went into a major outburst, while the latter was obtained during a quiescent phase. The line fluxes were very similar in each case, and the line ratios, relative to 1401, are shown in Table 8 and overplotted on Fig. 13. The ratios clearly show that the density lies between and cm-3. The stronger lines have a higher signal-to-noise and so we favor densities closer to cm-3 and this is the value assumed for the density of the nebula in the present paper.
| SWP14641 | SWP20162 | |
|---|---|---|
| Ratio | 1981 August | 1983 June |
| 1399/1401 | 0.19 | 0.25 |
| 1404/1401 | 0.34 | 0.33 |
| 1407/1401 | 0.18 | 0.19 |

Appendix C Ionization model
In Sect. 14 results are presented from a model of the ionization balance of oxygen and neon ions in a photoionized plasma. The details of this model are given here.
The distribution of element ionization states in a plasma photoionized by a distant radiation source are determined by the distance to the source and the local density and electron temperature of the plasma. The number of ions leaving an ionization state through photoionization is given by
| (C1) |
where is the photoionization cross-section, is the specific intensity of the radiation field, and is the dilution factor given by
| (C2) |
and is the ratio of the radiation source’s radius to the distance of the plasma from the source’s center.
The number of ions entering into the state through recombinations from the state is
| (C3) |
The set of linear equations
| (C4) |
are solved to yield ion populations as a function of radius
Photoionization cross-sections for both the oxygen and neon ions are from the analytic fits of Verner & Yakovlev (1995). The combined radiative and dielectronic recombination rates for the oxygen ions are from Nahar (1999), while for the neon ions the radiative recombination rates are from the fits provided by D.A. Verner and available from http://www.pa.uky.edu/verner/fortran.html, while the dielectronic recombination rates are from Mazzotta et al. (1998).
References
- Ake et al. (2000) Ake, T. B., Dupree, A. K., Young, P. R., et al. 2000, ApJ, 538, L87
- Altamore et al. (1981) Altamore, A., Baratta, G. B., Cassatella, A., & Friedjung, M. 1981, ApJ, 245, 630
- Aufdenberg (1993) Aufdenberg, J. P. 1993, ApJ, 87, 337
- Baker & Menzel (1938) Baker, J. G., & Menzel, D. H. 1938, ApJ, 88, 52
- Barnstedt et al. (2000) Barnstedt, J., Gringel, W., Kappelmann, N., & Grewing, M. 2000, A&AS, 143, 193
- Bernat & Lambert (1978) Bernat, A. P., & Lambert, D. L. 1978, PASP, 90, 520
- Blair & Andersson (2001) Blair, W. P. & Andersson, B.-G. 2001, The FUSE Observer’s Guide, ver. 3.0 January 2001. Online. Available http://fuse.pha.jhu.edu/support/guide/guide.html
- Boyce & Rieke (1935) Boyce, J. C., & Rieke, C. A. 1935, Phys. Rev., 47, 653
- Cardelli et al. (1989) Cardelli, J. A., Clayton, G. C., & Mathis, J. S. 1989, ApJ, 345, 245
- Castor et al. (1970) Castor, J. I., Smith, L. F., & van Blerkom, D. 1970, ApJ, 159, 1119
- Clegg et al. (1999) Clegg, R. E. S., Miller, S., Storey, P. J., & Kisielius, R. 1999, A&AS, 135, 359
- Curdt et al. (2001) Curdt, W., Brekke, P., Feldman, U., Wilhelm, K., Dwivedi, B.N., Schühle, U., & Lemaire, P. 2001, A&A, 375, 591
- De Medeiros & Mayor (1999) De Medeiros, J. R., & Mayor, M. 1999, A&AS, 139, 433
- Dere et al. (1997) Dere, K. P., Landi, E., Mason, H. E., Monsignori-Fossi, B. F., & Young, P. R. 1997, A&AS, 125, 149
- Dere et al. (2001) Dere, K. P., Landi, E., Young, P. R., & Del Zanna, G. 2001, ApJS, 134, 331
- Dwivedi et al. (1999) Dwivedi, B. N., Curdt, W., & Wilhelm, K. 1999, ApJ, 517, 516
- Edlén (1983) Edlén, B. 1983, Phys. Scr., 28, 483
- Edlén (1985) Edlén, B. 1985, Phys. Scr., 31, 345
- Ekberg (1993) Ekberg, J. O. 1993, A&AS, 101, 1
- Espey et al. (1996) Espey, B., Keenan, F. P., McKenna, F. C., Feibelmann, W. A., & Aggarwal, K. M. 1996, ApJ, 465, 965
- Fekel et al. (2000) Fekel, F. C., Hinkle, K. H., Joyce, R. R., & Skrutskie, M. F. 2000, AJ, 120, 3255
- Feldman et al. (1997) Feldman, U., Behring, W. E., Curdt, W., Schühle, U., Wilhelm, K., Lemaire, P., & Moran, T. M. 1997, ApJS, 113, 195
- Ferland (2000) Ferland, G. J. 2000, RMxAC, 9, 153
- Feuchtgruber et al. (1997) Feuchtgruber, H., Lutz, D., Beintema, D. A., et al. 1997, ApJ, 487, 962
- Fitzpatrick (1999) Fitzpatrick, E. L. 1999, PASP, 111, 63
- Friedjung et al. (1983) Friedjung, M., Stencel, R.E., & Viotti, R. 1983, A&A, 126, 407
- Gális et al. (1999) Gális, R., Hric, L., Friedjung, M., & Petrík, K. 1999, A&A, 348, 533
- González-Riestra et al. (1999) González-Riestra, R., Viotti, R., Iijima, T., & Greiner, J. 1999, A&A, 347, 478
- Grevesse & Sauval (1998) Grevesse, N., & Sauval, A. J. 1998, Space Science Reviews, 85, 161
- Greiner et al. (1997) Greiner, J., Bickert, K., Luthardt, R., Viotti, R., Altamore, A., González-Riestra, & Stencel, R. E. 1997, A&A, 322, 576
- Harper et al. (2001) Harper, G. M., Wilkinson, R., Brown, A., Jordan, C., & Linsky, J. L. 2001, ApJ, 551, 486
- Hartman & Johansson (2000) Hartman, H., & Johansson, S. 2000, A&A, 359, 627
- Johansson (1988) Johansson, S. 1988, ApJ, 327, L85
- Kafatos et al. (1993) Kafatos, M., Meier, S. R., & Martin, I. 1993, ApJS, 84, 201
- Kaufman & Martin (1989) Kaufman, V., & Edlén, B. 1989, J. Opt. Soc. Am. B6, 1769
- Kenyon et al. (1993) Kenyon, S., Mikołajewska, J., Mikołajewski, M., Polidan, R. S., Slovak, M. H. 1993, AJ, 106, 1573
- Lutz et al. (1987) Lutz, J. H., Lutz, T. E., Dull, J. D., & Kolb, D. D. 1987, AJ, 94, 463
- Mazzotta et al. (1998) Mazzotta, P., Mazzitelli, G., Colafrancesco, S., & Vittorio, N. 1998, A&AS, 133, 403
- Meinunger (1979) Meinunger, L. 1979, IBVS, No. 1611
- Mihalas (1970) Mihalas, D. 1970, Stellar Atmospheres, Freeman, San Francisco
- Mikołajewska et al. (1995) Mikołajewska, J., Kenyon, S., Mikołajewski, M., Garcia, M. R., Polidan, R. S. 1995, AJ, 109, 1289
- Moos et al. (2000) Moos, H. W., Cash, W. C., Cowie, L. L., et al. 2000, ApJ, 538, L1
- Morton (2000) Morton, D. C. 2000, ApJS, in preparation
- Nahar (1999) Nahar, S. 1999, ApJS, 120, 131
- Nussbaumer & Storey (1984) Nussbaumer, H., & Storey, P. J. 1984, A&AS, 56, 293
- Nussbaumer (1987) Nussbaumer, H. & Stencel, R. E. 1987, Exploring the Universe with the IUE Satellite, ed. Y. Kondo, 203
- Nussbaumer et al. (1995) Nussbaumer, H., Schmutz, W., & Vogel, M. 1995, A&A, 293, L13
- Peter & Judge (1999) Peter, H., & Judge, P. G. 1999, ApJ, 522, 1148
- Proga et al. (1996) Proga, D., Kenyon, S. J., Raymond, J. C., & Mikołajewska, J. 1996, ApJ, 471, 930
- Proga et al. (1998) Proga, D., Kenyon, S. J., & Raymond, J. C. 1998, ApJ, 501, 339
- Rauch (1997) Rauch, T. 1997, A&A, 320, 237
- Sandlin et al. (1977) Sandlin, G. D., Brueckner, G. E., & Tousey, R. 1977, ApJ, 214, 898
- Schmid & Nussbaumer (1993) Schmid, H. M. & Nussbaumer, H. 1993, A&A, 268, 159
- Schmid et al. (1999) Schmid, H. M., Krautter, J., Appenzeller, I., et al. 1999, A&A, 348, 950
- Smith et al. (1996) Smith, V. V., Cunha, K., Jorissen, A., & Boffin, H. M. J. 1996, A&A, 315, 179
- Storey & Hummer (1991) Storey, P. J., & Hummer, D. G. 1991, Comp. Phys. Comm. 66, 129
- Storey & Hummer (1995) Storey, P. J., & Hummer, D. G. 1995, MNRAS, 272, 41
- Verner & Yakovlev (1995) Verner, D. A., & Yakovlev, D. G. 1995, A&AS, 109, 125
- Viotti et al. (1983) Viotti, R., Ricciardi, O., Ponz, D., et al. 1983, A&A, 119, 285
- Viotti et al. (1984) Viotti, R., Altamore, A., Baratta, G. B., Cassatella, A., & Friedjung, M. 1984, ApJ, 283, 226
- Warren et al. (1997) Warren, H. P., Mariska, J. T., Wilhelm, K., & Lemaire, P. 1997, ApJ, 484, L91
- Young et al. (2003) Young, P. R., Del Zanna, G., Landi, E., et al. 2003, ApJS, 144, 135