eurm10 \checkfontmsam10 \pagerange1–8
Large– and Small–Scale Feedback in the Starburst Centers of Galaxies
Abstract
The interplay between stellar populations and gas in local starburst galaxies is analyzed using images from the Hubble Space Telescope to map the ages of the young stellar components and to isolate the contribution of shocks on spatial scales ranging from a few tens of pc to 1 kpc. The shocked gas represents a small fraction of the total ionized gas in these objects, yet it can have profound effects on the long–term evolution of the starburst, which may include the triggering of new star formation.
in Galactic Nuclei††editors: Th. Storchi Bergmann, L.C. Ho & H.R. Schmitt, eds.
1 Introduction
The evolution of galaxies and of the intergalactic/intracluster medium (IGM/ICM) are closely connected, via the continuous interchange between the ISM and the IGM/ICM. The heating and metal enrichment of the IGM/ICM, and the enrichment of galaxies’ ISM with pristine gas via infall from the IGM are manifestations of this close connection. Evidence for gas outflows from galaxies has been found at redshift as high as 3 ([Pettini et al. 2000]), and may have contributed to the early pollution of the IGM ([Ellison et al. 2000]).
The driving mechanism for the energy and metal pollution of the IGM/ICM is the feedback from star formation. In the basic scenario, the combined effects of ejecta and energy release from supernovae and massive stars in regions of intense star formation form superbubbles that sweep up the surrounding medium and produce cavities containing hot, shocked gas ([Weaver et al. (1977), Weaver et al. 1977]). If the bubble has enough energy to expand to a size of a few times the scale height of the ambient medium, the swept-up shell may break out and the wind internal to the bubble may expand into the IGM ([Chevalier & Clegg (1985), Chevalier & Clegg 1985]).
Many theoretical and observational studies have investigated the mechanical feedback from star formation and its efficiency in transfering energy and material to regions far removed from the site of star formation ([De Young & Heckman (1994), e.g., De Young & Heckman 1994]; [Suchkov et al. (1994), Suchkov et al. 1994]; [Mac Low & Ferrara (1999), Mac Low & Ferrara 1999]; [Strickland & Stevens (2000), Strickland & Stevens 2000]; [Heckman, Armus & Miley 1990, Heckman, Armus & Miley 1990]; [Dahlem (1997), Dahlem 1997]; [Ferrara & Tolstoy 2000, Ferrara & Tolstoy 2000]; [Cecil, Bland-Hawthorn & Veilleux (2002), Cecil, Bland-Hawthorn & Veilleux 2002]), as well as in triggering renewed star formation ([Wada & Norman (2001), e.g., Wada & Norman 2001]). Yet many questions remain to be fully answered. Among these, progressing from small to large scales: the impact of the spatial distribution, history, and duration of the star–forming event ([clarke02, Clarke & Oey 2002]); the coupling of the feedback from star formation with the surrounding ISM; the dependence of the feedback efficiency on the conditions of the ISM (e.g. porosity; [clarke02, Clarke & Oey 2002]); and the role of the global galaxy parameters (mass, metallicity, environment; [Dahlem (1997), Dahlem 1997]; [Strickland et al. (2004), Strickland et al. 2004]). A review of some of these issues is given by D. Strickland (2004, these proceedings).
One of the complicating factors in tackling the various facets of feedback is the vast range of physical scales that needs to be probed. While the relevant scales for charting star formation are those of the stars and star clusters (a few pc), a study of the structure and conditions of the ISM needs to sample scales of tens to hundreds of pc. Moving on to larger scales, superwinds are best investigated on kpc scales, while probing the influence of global parameters involves scales of tens of kpc (galactic sizes) to Mpc (interactions).
Even for the closest galaxies, the small–to–intermediate scales relevant for the interaction feedback–ISM are accessible only via high angular resolution observations (e.g., with the Hubble Space Telescope), as 10 pc=0.4′′ for a galaxy at 5 Mpc distance. The study reviewed here involves four local starburst galaxies observed with the Wide Field Planetary Camera 2 on the HST. Because of their intense-to-extreme star formation rates, starburst galaxies are the sites where stellar feedback can have its most dramatic influence on the structure and evolution of the ISM (and surrounding IGM; [Heckman, Armus & Miley 1990]), and are, therefore, optimal laboratories to investigate mechanical feedback. The four galaxies in the present study cover a range in luminosity, metallicity, star formation rate, and environment, but they are all closer than 5 Mpc (Table 1). This investigation attempts at addressing the issue of the coupling feedback–ISM, and its relation to the duration of the star forming event. The problem is tackled from two fronts: stellar populations and ISM conditions. The ages of the young (300 Myr) stellar clusters are used to set a minimum value to the duration of the current starburst event, while measurements of the shocked gas provide a constraint on the fraction of starburst mechanical output that is recovered in the ISM within a small distance (1 kpc) of the site of star formation.
| Galaxy | |||||||
|---|---|---|---|---|---|---|---|
| Name | (Mpc) | (kpc) | (M⊙ yr-1) | ||||
| NGC3077 | 3.85 | 1.4 | 8.9 | 0.076 | 0.043 | 0.51–1.40 | |
| NGC4214 | 2.94 | 2.0 | 8.2 | 0.089 | 0.041 | 0.29–1.24 | |
| NGC5236 | 4.5 | 0.75 | 9.2 | 0.308 | 0.030 | 1.27–2.90 | |
| NGC5253 | 4.0 | 1.5 | 8.2 | 0.270 | 0.032 | 0.38–1.19 |
2 Charting the Young Stellar Populations in Starbursts
The star cluster populations and the spatial distributions of their ages within the starburst sites were investigated for three of the galaxies listed in Table 1, NGC3077, NGC5236, and NGC5253 ([Harris et al. 2001], [Harris et al. 2004]). For NGC5253, the diffuse starburst population had previously been age-dated ([Calzetti et al. 1997], [Tremonti et al. 2001]), which, combined with the more recent study of its cluster population, yields a complete picture of the recent star formation history in this galaxy.
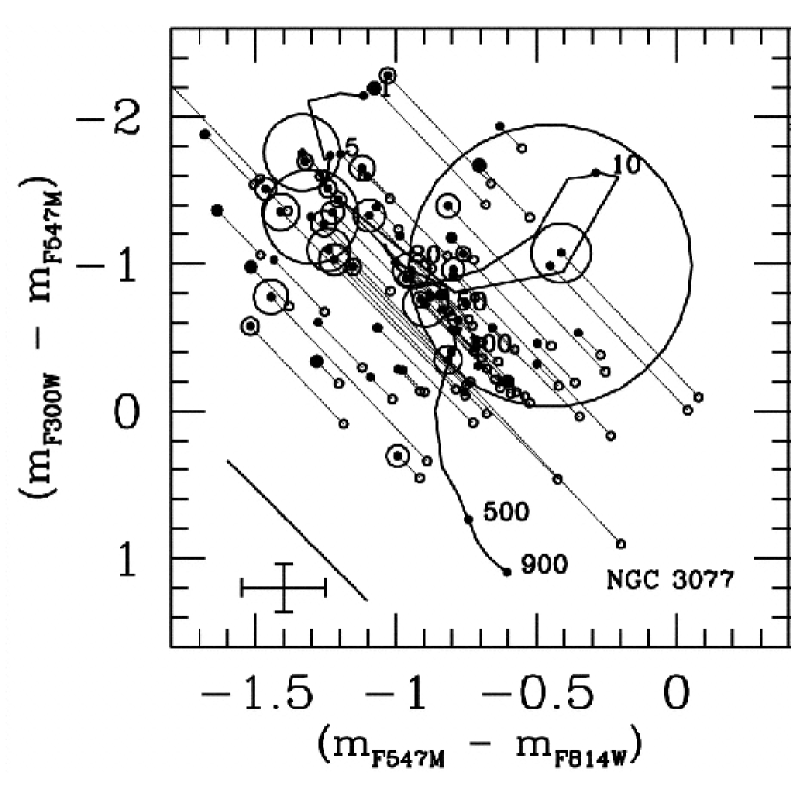
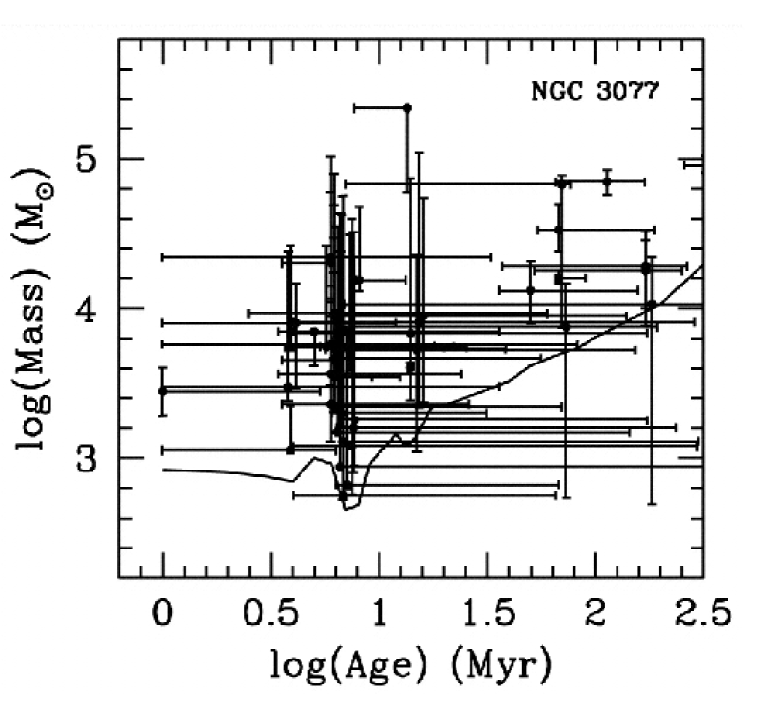
Images of the galaxies in the HST/WFPC2 medium and broad filters UV, V, I, and in the H and H line emission provide enough angular resolution to identify clusters, and enough color information to age-date them. In particular, two age–sensitive diagnostics, the color–color diagram UVV versus VI and the equivalent width of H, were combined to constrain the most likely age for each stellar cluster and, assuming a Salpeter IMF, to assign a mass (Figure 1; [Harris et al. 2001], [Harris et al. 2004]). H/H ratio maps were used to correct photometry and fluxes for the effects of dust reddening ([Calzetti, Kinney & Storchi–Bergmann 1994]). The cluster ages were then re-mapped onto the galaxy images to derive the history of the cluster formation in each starburst.
The two dwarf galaxies, NGC3077 and NGC5253, show time–extended star formation, spanning the last 100–300 Myr, and a very ‘chaotic’ spatial distribution of the cluster ages. This similarity between the two galaxies is counterbalanced by striking differences. In NGC3077, there are star clusters as old as 300 Myr, while in NGC5253 the oldest clusters unambiguously detected in the HST images do not seem to be significantly older than 20 Myr ([Harris et al. 2004]). Indeed, the time–extended star formation history for NGC5253 is inferred not from its clusters, but from its diffuse stellar population, whose colors are consistent with constant star formation over the past 100-200 Myr ([Calzetti et al. 1997]). The dearth of ‘old’ star clusters in NGC5253 could be caused by rapid cluster dissolution timescales in the center of the galaxy; by rescaling the Milky Way model of [Kim, Morris & Lee 1999], [Tremonti et al. 2001] and [Harris et al. 2004] derive dissolution timescales in the range 16–50 Myr for NGC5253. These short timescales are driven by the high central velocity dispersion measured in the galaxy ([Caldwell & Phillips 1989]). A smaller velocity dispersion may be present in NGC3077, as inferred from molecular cloud velocities ([Walter et al. 2002]), implying longer survival times for its clusters.
Contrary to the dwarfs, the distribution of the stellar clusters in the center of the giant spiral NGC5236 shows a high level of organization, possibly a reflection of the different dynamical environment (presence of a bar) in the massive galaxy. The UV–bright clusters are distributed along a half–ringlet surrounding the optically–bright nucleus. The distribution of the ages also shows a high level of correlation in the star formation, which appears propagating in the S–N direction and inside–out in the ringlet ([Harris et al. 2001, Harris et al. 2001], [Puxley, Doyon & Ward 1997]). There is a clear peak in the number of clusters in the narrow age range 5–7 Myr, with a handful of older clusters (up to 50 Myr). Although the diffuse population is generally consistent with constant star formation over the past 1 Gyr, the sharp cut–off of the cluster ages around 7 Myr could still be explained with either a recent starburst or very rapid cluster dissolution timescales ([Harris et al. 2001]).
Independently of whether the current starburst in the grand design spiral is confirmed to be younger than 10 Myr, a clear mechanism for the triggering and feeding of the starburst, i.e. gas infall along the main bar, is present in NGC5236 ([Gallais et al. 1991]). No such obvious mechanism is present in the two dwarf galaxies. Their starbursts may have been triggered by past interactions with their companions (M81 for NGC3077, and NGC5236 for NGC5253), but these interactions occurred a few hundred Myr ago, and are unlikely to be the direct cause of the starbursts observed today.
3 Charting the Shock–Ionized Gas
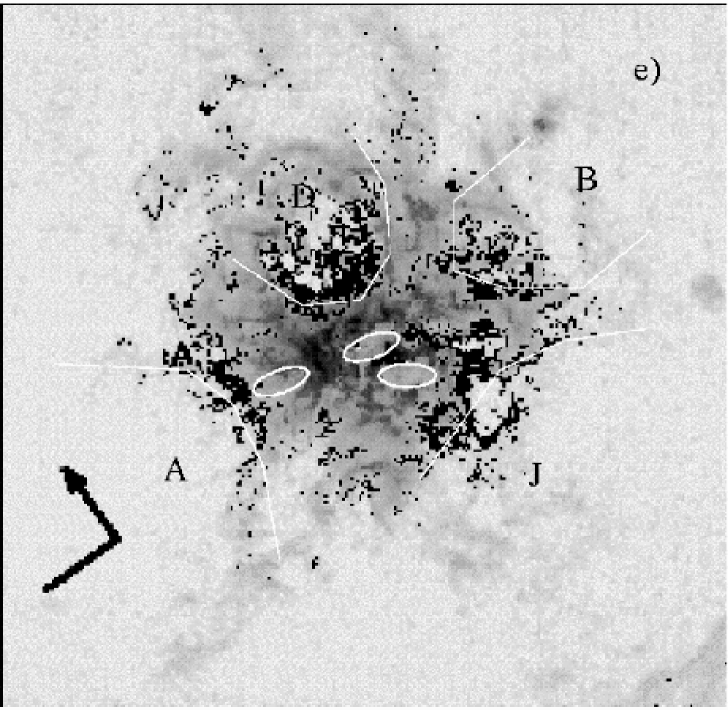
The stellar population study of these galaxies was complemented with the investigation of the conditions of the ISM within and around the four starbursts. The standard emission line diagnostic diagram log([OIII]/H)–log([SII]/H) was used to discriminate photoionized from non–photoionized gas ([Baldwin, Phillips & Terlevich 1981]). HST/WFPC2 images were obtained with narrow–band filters in correspondence of the forbidden lines [OIII](5007 Å) and [SII](6726 Å), and of the hydrogen recombination lines H and H. The diagnostic diagram was constructed by dividing each image in a grid of bins 3–6 pc in size, measuring line fluxes in each bin 5 above the noise level, and deriving line ratios from spatially corresponding bins. Figure 2 (left panel) gives an example of the resulting diagrams ([Calzetti et al. 2004]).
The ‘maximum starburst line’ defined by [Kewley et al. (2001)] was used as the separating line between photoionized gas (to the bottom–left of the line) from non–photoionized gas (to the top–right of the line, Figure 2). This can be considered a conservative definition of non–photoionized gas, yet it yielded clear identifications in all four galaxies. The non–photoionized gas in these galaxies shows two basic morphologies: enclosed bubbles and shells/filaments (Figure 2, right panel), and is likely due to shock ionization ([Martin 1997]). Indeed, the presence of star-formation-induced shocks is supported by observations of diffuse X–ray emission in the centers of all four galaxies. The shock–ionized component is responsible for a small fraction, about 3%–4%, of the total H luminosity (Table 1, column 7), but is spread over a significant fraction of the area covered by the H emission, about 15%–25%.

The availability of multi–color (UV–to–I) and H images allows us to place contraints on the characteristics of the ionizing stellar population, and, once coupled with models, on the expected amount of mechanical energy coming out of the starburst. The H luminosity predicted from the mechanical starburst output can then be compared with the observed H luminosity associated with shocks. The last column of Table 1 shows the predicted-to-observed H luminosities from shocks, with the range marking starbursts of different durations, from 10 Myr (left-hand-side figure) to 100 Myr (right-hand side figure). In this column, a figure smaller then 1 means that the starburst does not produce enough mechanical energy to account for the observed H luminosity of shocks, while a figure larger than 1 means the starburst can support the observed shock luminosity.
For the three dwarfs, between 70% and 100% of the mechanical energy is deposited within the immediate surroundings of the starburst, roughly within the inner 0.2–1 kpc. Furthermore, starbursts with durations shorter than 30 Myr do not produce enough mechanical energy to account for the observed H luminosity of shocks. It is worth reminding that we adopted a conservative criterion for identifying shocked gas in the galaxies, thus the limitation on the minimum duration of the starbursts is quite stringent. In addition, the result is independent of whether the parent galaxy is isolated or in interaction with other galaxies. Since the vast majority of the starburst mechanical output is recovered in the immediate surroundings of the starburst itself, it is not unlikely that the shocks can trigger renewed star formation. This inference could help explain the long star formation timescales required by the high luminosity of the H emission associated with shocks, and the even longer timescales derived from the stellar population studies.
For the giant spiral, only between 35% and 75% of the available mechanical output is recovered in the surrounding ISM, for a variety of starburst conditions. Thus, there are no restrictions on the current starburst coming from the characteristics of the shocked gas. In addition, the non–photoionized gas is located in two main bubbles, and there is a striking absence of extended features (shells or filaments). This suggests a confined starburst.
4 Conclusions
The characteristics of the stellar populations and ISM in the starbursts of four nearby galaxies suggest a strong coupling between the starbursts and the surrounding ISM. This is particularly true for the three dwarf galaxies in the sample. Here the amount of observed H luminosity associated with shocks corresponds to about 70%–100% of the total mechanical output from the starbursts, and places a lower limit of about 30 Myr to the duration of the starbursts (i.e., these cannot be ‘bursts’). Such large fractions of mechanical energy available in the immediate surroundings of starbursts may suggest triggered star formation as a mechanism to explain the long duration timescales inferred from stellar population studies (100–300 Myr), in the absence of direct, recent triggers.
Acknowledgements.
The author would like to thank the Local Organizing Committee, and in particular Thaisa Storchi-Bergmann, for their hospitality. This work was supported by NASA Long–Term Space Astrophysics grant NAG-9173 and by NASA HST grant GO-9144.References
- [Baldwin, Phillips & Terlevich 1981] Baldwin, J., Phillips, M. & Terlevich, R. 1981 PASP 93, 5.
- [Caldwell & Phillips 1989] Caldwell, N. & Phillips, M.M. 1989 ApJ 338, 789.
- [Calzetti et al. 2004] Calzetti, D., Harris, J., Gallagher, J.S., Smith, D.A., Conselice, C.J., Homeier, N. & Kewley, L. 2004 AJ 127, 1405.
- [Calzetti, Kinney & Storchi–Bergmann 1994] Calzetti, D., Kinney, A.L. & Storchi–Bergmann, T. 1994 ApJ 429, 582.
- [Calzetti et al. 1997] Calzetti, D., Meurer, G.R., Bohlin, R.C., Garnett, D.R. Kinney, A.L., Leitherer, C. & Storchi–Bergmann, T. 1997 AJ 114, 1834.
- [Cecil, Bland-Hawthorn & Veilleux (2002)] Cecil, G.,Bland-Hawthorn, J. & Veilleux, S. 2002 ApJ 576, 745.
- [Chevalier & Clegg (1985)] Chevalier, R.A. & Clegg, A.W. 1985 Nature 317, 44.
- [Clarke & Oey (2002)] Clarke, C. & Oey, M.S. 2002 MNRAS 337, 1299.
- [Dahlem (1997)] Dahlem, M. 1997 PASP 109, 1298.
- [De Young & Heckman (1994)] De Young, D.S. & Heckman, T.M. 1994 ApJ 431, 598.
- [Ellison et al. 2000] Ellison, S.L., Songaila, A., Schaye, J. & Pettini, M. 2000 AJ 120, 1175.
- [Ferrara & Tolstoy 2000] Ferrara, A. & Tolstoy, E. 2000 MNRAS 313, 291.
- [Gallais et al. 1991] Gallais, P., Rouan, D., Lacombe, F., Tiphene, D. & Vauglin, I. 1991 A&A 243, 309.
- [Harris et al. 2001] Harris, J., Calzetti, D., Gallagher, J.S., Conselice, C.J. & Smith, D.A. 2001 AJ 122, 3046.
- [Harris et al. 2004] Harris, J., Calzetti, D., Gallagher, J.S., Smith, D.A. & Conselice, C.J. 2001 ApJ 603, 503.
- [Heckman, Armus & Miley 1990] Heckman, T.M., Armus, L. & Miley, G.K. 1990 ApJS 74, 833.
- [Kewley et al. (2001)] Kewley, L.J., Dopita, M.A., Sutherland, R.S., Heisler, C.A. & Trevena, J. 2001 ApJ 556, 121.
- [Kim, Morris & Lee 1999] Kim, S.S., Morris, M. & Lee, H.M. 1999 ApJ 525, 228.
- [Leitherer et al. (1999)] Leitherer, C., Schaerer, D., Goldader, J.D., González Delgado, R.M., Robert, C., Kune, D.F., de Mello, D.F., Devost, D. & Heckman, T.M. 1999 ApJS 123, 3.
- [Mac Low & Ferrara (1999)] Mac Low, M.-M. & Ferrara, A. 1999 ApJ 513, 142.
- [Martin 1997] Martin, C.L. 1997 ApJ 491, 561.
- [Martin 1998] Martin, C.L. 1998 ApJ 506, 222.
- [Pettini et al. 2000] Pettini, M., Steidel, C.C., Adelberger, K.L., Dickinson, M. & Giavalisco, M. 2000 ApJ 528, 96.
- [Puxley, Doyon & Ward 1997] Puxley, P.J., Doyon, R. & Ward, M.J. 1997 ApJ 476, 120.
- [Strickland et al. (2004)] Strickland, D.K., Heckman, T.M., Colbert, E.J.M., Hoopes, C.G. & Weaver, K.A. 2004 ApJS in press, (astroph/0306592).
- [Strickland & Stevens (2000)] Strickland, D.K. & Stevens, I.R. 2000 MNRAS 314, 511.
- [Suchkov et al. (1994)] Suchkov, A.A., Balsara, D.S., Heckman, T.M. & Leitherer, C. 1994 ApJ 430, 511.
- [Tremonti et al. 2001] Tremonti, C.A., Calzetti, D., Leitherer, C. & Heckman, T.M. 2001 ApJ 555, 322.
- [Wada & Norman (2001)] Wada, K. & Norman, C.A. 2001 ApJ 547, 172.
- [Weaver et al. (1977)] Weaver, R., McCray, R., Castor, J., Shapiro, P. & Moore, R. 1977 ApJ 218, 377.
- [Walter et al. 2002] Walter, F., Weiss, A., Martin, C. & Scoville, N. 2002 AJ 123, 225.