XMM-Newton observations of seven soft X-ray excess QSOs
Abstract
XMM-Newton observations of seven QSOs are presented and the EPIC spectra analysed. Five of the AGN show evidence for Fe K emission, with three being slightly better fitted by lines of finite width; at the 99 per cent level they are consistent with being intrinsically narrow, though. The broad-band spectra can be well modelled by a combination of different temperature blackbodies with a power-law, with temperatures between kT 100–300 eV. On the whole, these temperatures are too high to be direct thermal emission from the accretion disc, so a Comptonization model was used as a more physical parametrization. The Comptonizing electron population forms the soft excess emission, with an electron temperature of 120–680 eV. Power-law, thermal plasma and disc blackbody models were also fitted to the soft X-ray excess. Of the sample, four of the AGN are radio-quiet and three radio-loud. The radio-quiet QSOs may have slightly stronger soft excesses, although the electron temperatures cover the same range for both groups.
keywords:
galaxies: active – X-rays: galaxies – quasars: general1 Introduction
At energies below 2 keV, the spectra of most AGN show an upturn, away from the extrapolation of the high energy (2–10 keV) power-law. This so-called ‘soft excess’ emission is thought to be common in both Seyfert galaxies and QSOs (Quasi-Stellar Objects). The first such soft excess was identified in Mrk 841 by Arnaud et al. (1985); Turner & Pounds (1989) then found that 50 per cent of their EXOSAT sample showed steeper spectral slopes at low energies. Likewise, Walter & Fink (1993) and Schartel et al. (1996) found that the ROSAT PSPC spectral index tends to be significantly steeper than that measured above 2.4 keV (typically 1.9; e.g., Nandra & Pounds 1994). More recently, Pounds & Reeves (2002) have discussed the frequent presence of soft excesses in XMM-Newton data.
Many papers have been published about the soft excess, covering both observational results – with ROSAT (e.g., Fiore et al. 1994; Piro, Matt & Ricci 1997), Ginga, EXOSAT (e.g., Saxton et al. 1993) and Einstein (e.g., Masnou et al. 1992; Zhou & Yu 1992) – and theoretical work (e.g., Czerny & Elvis 1987; Czerny & Życki 1994; Xia & Zhang 2001). It is generally thought that the soft excess may be linked to the hot tail-end of the Big Blue Bump (BBB), or is an extension of the UV band. The BBB/UV excess is likely to be due to thermal emission from the accretion disc surrounding the black hole (e.g., Shields 1978; Malkan & Sargent 1982). However, this thermal emission is not hot enough to account for the soft X-ray flux as well; hence, Comptonization is often invoked to explain the resultant emission. In this scenario, the direct thermal emission from the accretion disc is observed as the optical and UV spectrum. Some of the disc photons, however, undergo inverse Compton scattering with a population of hot electrons, thus gaining energy and producing a broader spectrum, which appears similar to a power-law over a limited energy range (assuming unsaturated Comptonization).
All seven objects in this paper, listed in Table 1, have been previously observed by ROSAT (Schartel et al. 1996) and were each noted to have steep photon indices over the 0.1–2.4 keV ROSAT band. The Galactic absorption in the direction of each low-redshift QSO is small and it has been previously found that there is no significant evidence for additional, intrinsic absorption in any of the objects. These QSOs, therefore, represent a useful sample to investigate the soft excess in both radio-quiet and radio-loud AGN.
a Radio fluxes from the NVSS. object RL/RQ 1.4 GHz redshift Gal. abs. Optical and UV magnitudes flux (mJy)a (1020 cm-2) V-band UVW1 UVM2 UVW2 Q0056363 RQ 2.5 0.162 1.93 16.7 — — 13.9 PG 0804+761 RQ 3.3 0.4 0.100 2.98 15.2 — — — Mrk 1383 RQ 2.7 0.5 0.086 2.85 17.5 — 12.4 12.4 Mrk 876 RQ 3.9 0.5 0.129 2.87 15.2 13.7 13.7 13.7 B2 1028+31 RL 230.5 8 0.178 1.96 16.7 — — — B2 1128+31 RL 369.7 13 0.289 2.02 16.6 15.3 14.4 14.3 B2 1721+34 RL 518.3 19.7 0.206 3.11 16.5 — — —
2 XMM-Newton Observations
The QSOs in this paper were observed by XMM-Newton between revolutions 105 and 315 (Table 2). sas (Science Analysis Software) v5.4 was used to produce the event lists for the MOS and PN EPIC (European Photon Imaging Camera) instruments, which were then filtered using xmmselect. For most of the objects, events covering patterns 0–12 (single, double, triple and quadruple events) were selected for the MOS exposures, while 0–4 (singles and doubles) were used for the PN, after ensuring that there were no problems with pile-up in either instrument. PG 0804+761 did appear to show pile-up effects (using the sas task epatplot), though, so pattern zero spectra (i.e., single events only) were used for this object. Spectra were extracted within a circular region of 40 arcsec centred on each object; background spectra were obtained from an adjacent area of ‘blank sky’. Finally, the spectra were binned in such a way that each individual bin contained a sufficient number of counts to apply the statistic (the minimum used was 25) and the energy range of each bin is larger than one third of the FWHM in order to avoid oversampling effects (i.e. to ensure that the bins were uncorrelated). Version 11.1.0 of Xspec was then used to analyse the data.
Table 1 lists whether the QSOs are radio loud or quiet, their redshift and Galactic absorption. The 1.4 GHz radio fluxes were taken from the NRAO VLA Sky Survey (NVSS; Condon et al. 1998) catalogue browser. The completeness limit of the survey is 2.5 mJy so, since no object was catalogued at the coordinates of Q 0056363, 2.5 mJy is taken as the upper limit to the radio flux. Table 2 gives information about the set-up of XMM-Newton for each observation, while Table 3 then gives the Right Ascension and Declination of the objects, together with source count-rates and net counts.
Although the objects will be referred to as QSOs throughout this paper, from their definition in the Véron-Véron catalogue, their magnitudes are on the border between bright Seyfert galaxies and QSOs (MB 23) and they are thus sometimes referred to as Seyfert 1 galaxies in the literature. H0 has been taken as 70 km s-1 Mpc-1, and q0 = 0.5; errors are given at the 1 level (e.g., = 2.3 for two interesting parameters).
a LW – large window; SW – small window; FF – full frame. object observation exposure time (ks) modea filter date (rev.) MOS1 MOS2 PN MOS1 MOS2 PN MOS1 MOS2 PN Q0056363 2000-07-05 (105) 5.3/5.3 5.3/5.3 14.5 LW LW LW thin/thick thin/thick thin PG 0804+761 2000-11-04 (166) 6.7 6.7 0.6 LW LW FF thin thin thin Mrk 1383 2000-07-28 (116) 5.0 4.9 3.5 LW LW LW thin thick thin Mrk 876 2001-04-13 (246) 4.2 4.4 3.5 LW LW FF thin thick thin 2001-08-29 (315) 7.2 7.2 2.6 LW LW FF thin thick thin B2 1028+31 2000-12-06 (182) 26.2 26.2 21.5 LW LW FF thin thick thin B2 1128+31 2000-11-22 (175) 23.3 23.3 18.9 LW LW FF thin thick thin B2 1721+34 2001-02-13 (216) 6.9 6.9 4.1 LW LW FF thin thick thin 2001-02-26 (223) 6.3 6.5 3.2 LW LW FF thin thick thin
a combined counts for the thin filter (MOS1+MOS2) observations; b combined counts for the thick filter (MOS1+MOS2) observations Object RA Dec Extraction region (physical pixels) source count-rates (count s-1) net source counts (103) MOS 1 MOS 2 PN MOS 1 MOS 2 PN MOS 1 MOS 2 PN Q0056363 00:58:37.4 36:06:05.0 (24240.5, 24800.5) (24240.5, 24800.5) (24240.5, 24800.5) 0.660 0.008a 0.570 0.007b 3.178 0.015 7.1 6.1 46.5 PG 0804+761 08:10:58.5 76:02:43.0 (24600.5, 24240.5) (24560.5, 24280.5) (24600.5, 24360.5) 1.877 0.017 1.962 0.017 7.888 0.119 12.8 13.3 14.5 Mrk 1383 14:29:06.6 01:17:06.0 (26520.5, 27840.0) (26520.5, 27840.0) (26520.5, 27840.0) 1.866 0.019 1.633 0.018 8.718 0.063 9.5 8.1 19.7 Mrk 876 16:13:57.2 65:43:09.0 (23880.5, 25680.5) (23920.5, 25720.5) (23960.5, 25720.5) 0.821 0.009 0.706 0.008 3.328 0.026 9.8 8.3 23.2 B2 1028+31 10:30:59.1 31:02:56.0 (25280.5, 23960.5) (25320.5, 24000.5) (25280.5, 23960.5) 0.404 0.004 0.351 0.003 1.708 0.009 10.7 9.3 37.3 B2 1128+31 11:31:09.4 31:14:07.0 (25720.5, 23840.5) (25720.5, 23840.5) (25560.5, 24120.5) 0.410 0.004 0.366 0.004 1.871 0.011 9.7 8.6 37.6 B2 1721+34 17:23:20.8 34:17:59.0 (25680.5, 23880.5) (25680.5, 23840.5) (25761.0, 23921.0) 1.349 0.011 1.195 0.010 5.138 0.028 18.4 16.1 38.5
3 Spectral Analysis
3.1 2–12 keV
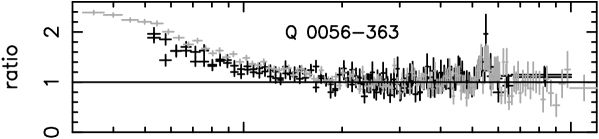
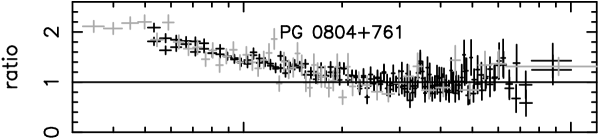
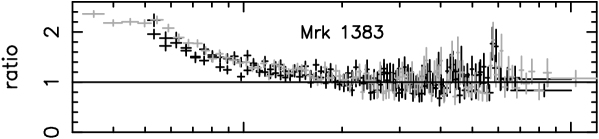
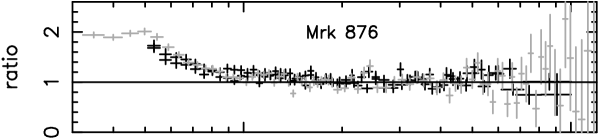
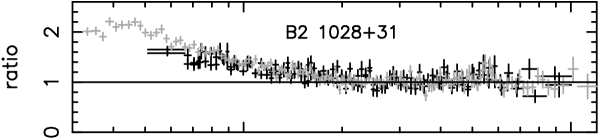
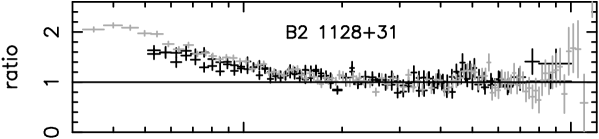
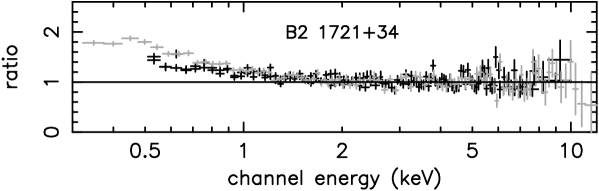
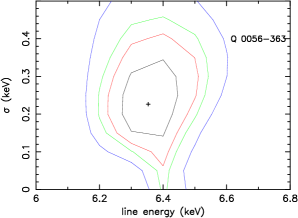
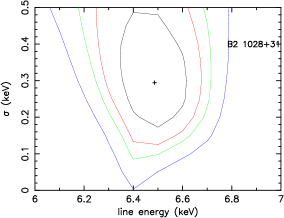
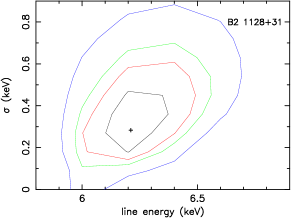
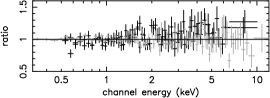
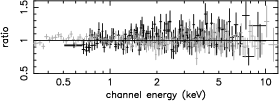
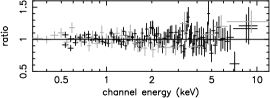
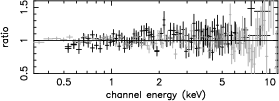
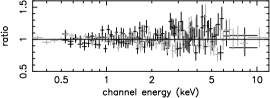
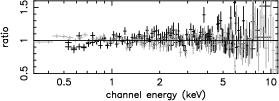
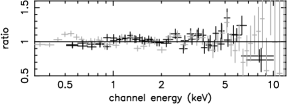
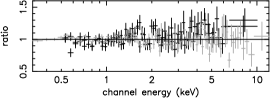
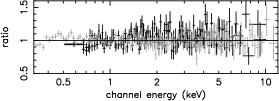
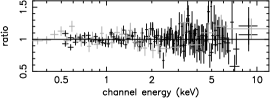
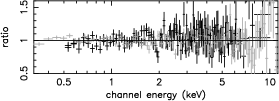
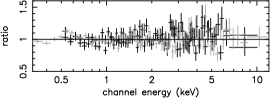
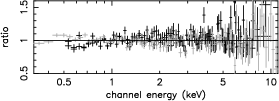
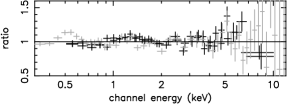
As is conventional, each background-subtracted spectrum was first simply fitted with a single power-law over the entire band pass of XMM-Newton, attenuated by the Galactic absorption column relevant for each object (Table 1). MOS1, MOS2 and PN gave consistent results, so the spectra were fitted simultaneously; the values given in the tables are those for the joint fits. It was found, however, that a power-law over the broad-band produced bad fits for all of the spectra, generally due to upward curvature at energies lower than 1–2 keV. Therefore, the fits were repeated above 2 keV (observer’s frame) for each object, up to 10 keV for the MOS cameras and 12 keV for PN. Many showed positive residuals between 6–7 keV (Figure 1), indicative of iron emission lines, so Gaussian components were added. Initially, the width of the line was constrained to be unresolved by the EPIC instruments (i.e., = 0.01 keV); the width was then allowed to vary for the following fit. Table 4 shows the results to the high energy fits for the QSOs, along with F-test null probabilities for the inclusion of the narrow and broad Gaussian lines. The line widths were found to be unconstrained for Mrk 876 and B2 1721+34, so the 1 upper limit has been given in the table. If the F-test null probability is 1 10-2, then the line is less than 99 per cent significant; in this case, the 1 upper limit on the equivalent width (EW) has been quoted. For those QSOs (Q 0056363, B2 1028+31 and B2 1128+31) which appear to be better fitted by lines of finite width, contour plots showing the relationship between the line energy and width are given in Figure 2; the contours plotted are for 68, 90, 95 and 99 per cent confidence levels. It can be seen that, at the 99 per cent level, the width of the lines is consistent with being intrinsically narrow.
a energy given in the rest frame of the QSO; b intrinsic width of line; f frozen
| object | model | line energya | b | EW | /dof | F-test null | 2-10 keV lum. | |
|---|---|---|---|---|---|---|---|---|
| (keV) | (keV) | (eV) | probability | (1044 erg s-1) | ||||
| Q 0056363 | PL | 1.98 0.03 | 162/171 | |||||
| PL + NGA | 2.00 0.03 | 6.43 0.03 | 0.01f | 156 35 | 143/169 | 2.64 10-5 | ||
| PL + FGA | 2.03 0.04 | 6.35 0.06 | 0.23 0.07 | 276 68 | 137/168 | 7.37 10-3 | 1.79 | |
| PG 0804+761 | PL | 1.93 0.05 | 115/122 | |||||
| PL + NGA | 1.96 0.05 | 6.73 0.04 | 0.01f | 263 | 107/120 | 1.32 10-2 | ||
| PL + FGA | 2.00 0.06 | 6.62 0.14 | 0.33 0.16 | 512 | 106/119 | 0.291 | 2.54 | |
| Mrk 1383 | PL | 1.96 0.04 | 166/160 | |||||
| PL + NGA | 1.98 0.04 | 6.31 0.03 | 0.01f | 140 41 | 153/158 | 1.59 10-3 | ||
| PL + FGA | 1.99 0.04 | 6.39 0.06 | 0.12 0.07 | 179 61 | 153/157 | – | 1.48 | |
| Mrk 876 | PL | 1.83 0.04 | 213/242 | |||||
| PL + NGA | 1.84 0.04 | 6.51 0.13 | 0.01f | 73 | 212/240 | 0.569 | ||
| PL + FGA | 1.84 0.04 | 6.49 0.17 | 0.18 | 85 | 212/239 | – | 1.82 | |
| B2 1028+31 | PL | 1.67 0.03 | 265/280 | |||||
| PL + NGA | 1.68 0.03 | 6.43 0.04 | 0.01f | 77 18 | 254/278 | 2.76 10-3 | ||
| PL + FGA | 1.71 0.03 | 6.49 0.09 | 0.30 0.10 | 200 57 | 245/277 | 1.59 10-3 | 1.90 | |
| B2 1128+31 | PL | 1.70 0.03 | 244/235 | |||||
| PL + NGA | 1.72 0.03 | 6.31 0.05 | 0.01f | 87 | 236/233 | 2.06 10-2 | ||
| PL + FGA | 1.74 0.03 | 6.22 0.10 | 0.28 0.11 | 183 59 | 225/232 | 8.87 10-4 | 5.16 | |
| B2 1721+34 | PL | 1.76 0.02 | 242/263 | |||||
| PL + NGA | 1.78 0.03 | 6.43 0.05 | 0.01f | 54 20 | 233/261 | 7.11 10-3 | ||
| PL + FGA | 1.77 0.03 | 6.45 0.05 | 0.05 | 56 19 | 233/260 | – | 8.83 |
It is well documented (e.g., Wilkes & Elvis 1987; Williams et al. 1992; Lawson et al. 1992; Brinkmann, Yuan & Siebert 1997; Reeves et al. 1997) that Radio-Loud Quasars (RLQs) have flatter spectral indices than their radio-quiet counterparts (RQQs). Although the current sample consists of only four RQQs and three RLQs, the slopes confirm this trend, with the mean values being = 1.97 0.02 and = 1.74 0.02.
3.2 The soft excess
To examine the broad-band continuum of these QSOs, the power-law was extrapolated down to 0.5/0.3 keV for MOS/PN respectively. In each case the data points were found to lie well above the power-law, indicating the existence of soft excesses (see Figure 1). In the following sections, various methods of modelling the soft excess are tested.
3.2.1 Power-law
Table 5 gives the results of fitting a double power-law model to the datasets. Although the simple power-law fit to the data above 2 keV is generally accepted to give a good indication of the underlying power-law over the broader X-ray energies, these double power-law fits do not always agree with those results. In particular, fitting PG 0804+761 with two power-laws gives a very flat (though unconstrained) value for the power-law slope at higher energies ( 0.23). Fixing the slope to a more reasonable value of = 1.9 gives a worse fit, with /dof = 246/218, an increase of 13, for one additional degree of freedom.
| object | /dof | ||
|---|---|---|---|
| Q 0056363 | 2.85 0.07 | 1.60 0.13 | 296/266 |
| PG 0804+761 | 2.41 0.03 | 0.23 0.46 | 231/217 |
| Mrk 1383 | 2.91 0.11 | 1.66 0.13 | 297/256 |
| Mrk 876 | 3.48 0.17 | 1.71 0.05 | 417/341 |
| B2 1028+31 | 2.41 0.08 | 1.29 0.15 | 504/460 |
| B2 1128+31 | 2.42 0.07 | 1.19 0.16 | 364/330 |
| B2 1721+34 | 2.78 0.14 | 1.59 0.08 | 441/360 |
3.2.2 Blackbody components
Next, the soft excess for each object was parametrized with multiple blackbody (BB) components; the resulting fits are listed in Table 6 and the unfolded plots are shown in Figure 3. Column 6 of the table gives the ratio of the combined BB luminosity to that of the power-law, over the 0.5–10 keV bandpass. This can be thought of as the ‘strength’ of the soft excess, with larger values indicating that the soft excess is relatively luminous compared to the power-law component. This will be investigated further in Section 4. Using the F-test, with the exception of PG 0804+761 and B2 1128+31, the blackbody fits are preferred at 99 per cent compared to the power-law parametrization of the soft excess. The two anomalous results are those spectra which are modelled with extremely flat high-energy photon indices; these values for do not agree with the simple power-law fits above 2 keV.
| object | rest frame kT | luminosity of BB | total 0.5–10 keV | BB/ | /dof | |
|---|---|---|---|---|---|---|
| (keV) | (1044 erg s-1) | lum. (1044 erg s-1) | lum. ratio | |||
| Q 0056363 | 2.01 0.04 | 0.105 0.004 | 0.33 0.03 | 3.98 | 0.21 | 272/264 |
| 0.251 0.021 | 0.36 0.06 | |||||
| PG 0804+761 | 1.85 0.08 | 0.106 0.006 | 0.48 0.07 | 5.47 | 0.31 | 229/215 |
| 0.289 0.017 | 0.80 0.17 | |||||
| Mrk 1383 | 1.91 0.06 | 0.107 0.004 | 0.37 0.03 | 3.22 | 0.27 | 269/254 |
| 0.300 0.022 | 0.32 0.10 | |||||
| Mrk 876 | 1.75 0.06 | 0.103 0.004 | 0.28 0.02 | 3.43 | 0.16 | 366/339 |
| 0.319 0.035 | 0.19 0.01 | |||||
| B2 1028+31 | 1.69 0.03 | 0.118 0.006 | 0.18 0.02 | 3.44 | 0.14 | 480/458 |
| 0.296 0.026 | 0.24 0.04 | |||||
| B2 1128+31 | 1.69 0.04 | 0.119 0.006 | 0.47 0.04 | 9.63 | 0.15 | 361/328 |
| 0.304 0.023 | 0.79 0.11 | |||||
| B2 1721+34 | 1.77 0.03 | 0.109 0.007 | 0.64 0.06 | 16.07 | 0.09 | 421/358 |
| 0.283 0.070 | 0.73 0.15 |


3.2.3 Thermal Plasma
An alternative suggestion for the soft excess is an optically thin thermal plasma model. Since the soft excesses of these QSOs appear to be smooth, it might be expected that the model required would be closer to optically thin emission (Bremsstrahlung) from hydrogen only, which produces a featureless continuum. Table 7 gives the results obtained from fitting the spectra with a power-law together with the xspec mekal model (Mewe, Gronenschild & van den Oord 1986; Mewe, Lemen & van den Oord 1986; Liedahl, Osterheld & Goldstein 1995), which produces an emission spectrum from hot, diffuse gas. With the exception of Mrk 876, the spectral fits with the thermal plasma model are worse than those with two blackbody components (F-test probabilities imply that the blackbody fit is better at 99 per cent). Mrk 876, however, is slightly better fitted with the thermal model.
3.2.4 Disc blackbody
Another possibility for the soft emission is a disc blackbody (see, e.g., Mitsuda et al. 1984; Makishima et al. 1986), which models the emission from the accretion disc as a series of blackbodies at different temperatures, emitted from different radii. As Table 7 shows, this model was unable to account for the full breadth of the soft excess, with F-test null probabilities of 5 10-5 indicating that the multiple blackbodies were preferred at 99.99 per cent.
| object | model | kT (keV) | abundance | / | |
|---|---|---|---|---|---|
| Q 0056363 | PL+THERM | 2.08 0.03 | 0.321 0.018 | 0 | 283/265 |
| PL+DISCBB | 2.16 0.02 | 0.140 0.003 | 294/266 | ||
| PG 0804+761 | PL+THERM | 2.08 0.04 | 0.423 0.042 | 0 | 249/216 |
| PL+DISCBB | 2.17 0.03 | 0.168 0.011 | 258/217 | ||
| Mrk 1383 | PL+THERM | 2.12 0.02 | 0.227 0.010 | (9 2) 10-3 | 282/255 |
| PL+DISCBB | 2.11 0.02 | 0.136 0.004 | 292/256 | ||
| Mrk 876 | PL+THERM | 1.89 0.02 | 0.192 0.006 | 0.017 0.004 | 357/340 |
| PL+DISCBB | 1.87 0.02 | 0.117 0.003 | 384/341 | ||
| B2 1028+31 | PL+THERM | 1.72 0.03 | 0.460 0.028 | 0 | 496/459 |
| PL+DISCBB | 1.81 0.02 | 0.167 0.005 | 505/460 | ||
| B2 1128+31 | PL+THERM | 1.80 0.03 | 0.414 0.030 | 0 | 376/329 |
| PL+DISCBB | 1.84 0.02 | 0.157 0.005 | 390/330 | ||
| B2 1721+34 | PL+THERM | 1.81 0.02 | 0.335 0.029 | 0 | 429/358 |
| PL+DISCBB | 1.84 0.01 | 0.143 0.004 | 435/359 |
3.2.5 Comptonization
The multiple-BB model is a rather naïve way to fit the soft excess, since the temperatures required are generally considerably in excess of the hottest thermal emission expected from an accretion disc surrounding a 106–10 black hole ( 60 eV for MBH 10; see Equation 1, later).
A more physical approach, as mentioned in the introduction, involves the Comptonization of disc photons: through this method, the relatively cool photons from the disc can be up-scattered by hot distributions of electrons, to form the broad soft excess which is observed. The external model thCompfe (Zdziarski, Johnson & Magdziarz 1996) was used to fit the QSO soft excesses, again with an underlying power-law for the higher-energy part of the spectra. As mentioned above, the disc temperatures in these objects are likely to be low, generally 60 eV. Subsequently, it will not be easy to fit such a value accurately, because a blackbody at that temperature would be too cool to be visible over the XMM-Newton band. To avoid this problem, the temperature was estimated by assuming that the bolometric luminosity of the object was 10 the 0.5–10 keV value (given in Table 6) and that this is also the Eddington luminosity; this was then used to estimate the mass of the black hole. Accretion was taken to be at the Eddington limit and this, along with the black hole mass, was then substituted into the following equation to obtain an estimate for the temperature of the accretion disc (Peterson 1997):
| (1) |
(where is the mass accretion rate, is the Eddington accretion rate, M8 signifies the mass of the central black hole in units of 108 and Rsch is the Schwarzschild radius, 2GM/c2). The calculated values, rounded to the nearest 5 eV, are listed in the second column of Table 8. It should be noted, though, that the resulting parameters of the Comptonization model do not depend strongly on this input temperature for such low values of kT.
The Compton y-parameter gives an indication of the strength of the interaction between the photons and electrons. It is defined as being the average fractional energy change per scattering multiplied by the mean number of interactions and is given (for non-relativistic, optically thick electrons) by
| (2) |
where is the optical depth ( is for the case where the gas is optically thin, if optically thick), and kT the temperature, of the electron corona; me is the electronic mass (0.511 MeV/c2). The photon index of the spectrum is then given by (Sunyaev & Titarchuk 1980)
| (3) |
If y 1, a modified BB spectrum is observed, with a temperature close to that of the initial input photons. For y 1, Comptonization becomes saturated, forming a Wien spectrum, e-hν/kT, tending towards the temperature of the Comptonizing population of electrons. When y 1, the regime is known as unsaturated Comptonization; this is what is observed here (Table 8). In this case, a power-law spectrum is formed over a limited energy range, with an exponential roll-over at 4kT. [See Rybicki & Lightman (1979) for more details.]


As Table 8 shows, the Comptonization model lead to statistically good fits, though generally not quite as good as the simple BB parametrisation; Figure 4 shows the unfolded fits to the spectra. It is possible that the underlying power-law is also formed through Comptonization, at least in the case of the radio-quiet QSOs. The power-law continua of radio-loud quasars, in particular core-dominated AGN, is related to non-thermal emission from the radio jets, and extends up to several hundred keV, although there may also be a Comptonized component similar to the RQQs. However, to derive any precise constraints on such a Comptonization fit would require a bandpass extending to higher energies than XMM-Newton.
Because of the close coupling between the temperature and optical depth (Equations 2 and 3), it is possible that other combinations of values also lead to adequate fits – for example, a higher electron temperature with a smaller optical depth; such fits have been presented in previous work (e.g., Czerny & Elvis 1987; Fiore et al. 1995).
It was found that four of the spectra (PG 0804+761, Mrk 1383, B2 1128+31 and B2 1721+34) could be modelled just as well statistically with kT 50 keV (with correspondingly lower optical depths) as with the lower-temperature Comptonised component. This is formally the same as fitting with a second power-law, since the EPIC instruments cannot determine the value of the electron temperature if kT 2–3 keV: the exponential roll-over for a Comptonized spectrum occurs at 4 kT, and, below this point, the emission appears as a power-law. Thus, if 4 kT is greater than 10 keV, the temperature cannot be constrained over the XMM-Newton band, and the fit is indistinguishable from a simple power-law over the same energy range. Because of this, the resultant values for the high-temperature Comptonization fits to these four spectra are virtually identical to those for the double power-law fits (Table 5). In Table 8, the 1 lower limits are given for the temperature of these components (and the corresponding upper limit for the optical depth), based on the low-kT fit.
Thus, all that can be said for PG 0804+761, Mrk 1383, B2 1128+31 and B2 1721+34, is that the soft excess can be modelled either as low temperature (few 100 eV) Comptonized emission, or as a power-law (which could be formed through high temperature, few keV, Comptonization). Q 0056363, Mrk 876 and B2 1028+31 are noticeably better fitted with a lower-temperature component, though.
f frozen a y-parameter, as defined by Equation 2. comptonized component object input BB kT optical ya /dof temp.f (eV) (keV) depth Q 0056363 25 0.271 0.044 15 2 0.50 0.04 2.71 0.12 284/265 PG 0804+761 25 0.469 12 0.58 0.03 1.53 0.30 230/216 Mrk 1383 25 0.262 13 0.40 0.03 1.91 0.10 297/255 Mrk 876 25 0.121 0.020 38 15 1.35 0.72 1.87 0.02 388/340 B2 1028+31 25 0.333 0.057 15 2 0.61 0.05 1.71 0.04 497/459 B2 1128+31 20 0.424 13 0.54 0.03 1.62 0.09 366/329 B2 1721+34 20 0.220 18 0.50 0.07 1.79 0.03 430/358
3.2.6 B2 1028+31
The RLQ B2 1028+31 is located in the centre of the weak Abell cluster A1030. Because of this, there is a possibility that the X-ray emission from the AGN could be contaminated by the intra-cluster gas.
The temperature of the extended emission is 0.2 keV (Sarazin et al. 1999), which is close to the hotter of the blackbodies used here to model the AGN soft excess; this is much cooler than expected for the intra-cluster medium (5–10 keV). Sarazin et al. (1999) find that the X-ray emission is dominated by the quasar, with the extended soft emission possibly due to inverse Compton emission from the radio lobes. They state that X-rays from the intra-cluster medium itself make an insignificant contribution to the X-ray luminosity of 8 per cent.
Such extended emission has been frequently detected in other RLQs and radio galaxies (see, for example, Scharf et al. 2003; Fabian, Celotti & Johnstone 2003; Comastri et al. 2003; Siemiginowska et al. 2003; Chartas et al. 2000), so may also be relevant for B2 1128+31 and B2 1721+34 as well. However, it is unlikely that this emission would significantly affect the results presented here, given that the extraction region is only 40 arcsec in radius.
3.3 Ionized disc models
Some of the objects in this sample show iron lines with finite widths; this indicates that the lines may be formed towards the inner accretion disc. In order to investigate this possibility, the observed frame 2–12 keV spectra were fitted with the ionized disc reflection model described by Ballantyne et al. (2001). It was found that all seven spectra, even those which were better fitted by a narrow Gaussian component, could be well described by this reflection model. The results of the fits are given in Table 9. It is not surprising that the ionization parameters found are low, since, when fitting Gaussian lines, the energies were close to 6.4 keV, signifying neutral iron. The line in the spectrum of PG 0804+761, however, was found to be slightly ionized (E 6.7 keV) and is modelled here by the highest ionization parameter.
| object | Rb | /dof | ||
|---|---|---|---|---|
| (erg cm s-1) | ||||
| Q 0056363 | 1.64 0.21 | 2.06 0.05 | 1.10 0.44 | 143/169 |
| PG 0804+761 | 3.06 0.33 | 1.98 0.07 | 0.32 0.27 | 106/120 |
| Mrk 1383 | 1.47 0.35 | 2.01 0.05 | 0.64 0.36 | 157/158 |
| Mrk 876 | 2.25 0.31 | 1.88 0.06 | 0.77 0.30 | 210/240 |
| B2 1028+31 | 1.92 0.13 | 1.72 0.03 | 0.96 0.38 | 248/278 |
| B2 1128+31 | 2.04 0.12 | 1.76 0.04 | 1.14 0.38 | 229/233 |
| B2 1721+34 | 1.71 0.21 | 1.79 0.03 | 0.41 0.25 | 235/261 |
Ionized reflection may also contribute to the soft emission observed in broad-band X-ray spectra. Sometimes the reflection can account for the entire soft excess (e.g., Mrk 205, Reeves et al. 2001), while, in other spectra, the strength of the excess is simply decreased, shown by either the requirement for fewer blackbodies (e.g., Mrk 359, O’Brien et al. 2001), or by a lower normalisation of the components (e.g., Mrk 896, Page et al. 2003). For each of the QSOs in this sample, it is this last case – the decreased normalisation – which is observed.
4 Discussion
4.1 Iron lines
Observations with Ginga found that many AGN spectra showed evidence for an emission line around 6.4 keV, corresponding to the Fe K line (Pounds et al. 1989, 1990; Nandra et al. 1991; Nandra & Pounds 1994). In general, XMM-Newton observations find the lines to be unresolved by the instrument ( 10 eV), with relatively few broad lines. Examples of resolved line widths include MCG 63015 (Fabian et al. 2002), Mrk 205 (Reeves et al. 2001) and Mrk 509 (Pounds et al. 2001).
No iron lines have been reported in any of these objects from previous X-ray observations, although the XMM-Newton spectrum of Q 0056363 has been recently published by Porquet & Reeves (2003). They identified a strong broad Fe K line and the results presented in this paper are in complete agreement with their findings. Lawson & Turner (1997) analysed Ginga spectra of PG 0804+761, Mrk 1383, Mrk 876 and B2 1721+34, but found that iron emission lines were not significant. PG 0804+761 was also observed with ASCA (George et al. 2000) where, again, there was no evidence for an iron line. In the XMM-Newton spectra presented here, statistically significant narrow lines were, however, found in Mrk 1383 and B2 1721+34, as well as resolved lines in Q 0056363, B2 1028+31 and B2 1128+31.
If the emission lines in Q 0056363, B2 1028+31 and B2 1128+31 presented here are believed to be broadened, then the velocity widths are found to be (1–1.5) 104 km s-1. This indicates that the emission originates in the inner accretion disc, close to the black hole, rather than in distant matter, such as the molecular torus. However, it must be noted that the lines are consistent with being intrinsically narrow at the 99 per cent level.
4.2 Soft excess
Each of the seven QSOs in this sample have been found to show soft excess emission, as is commonly the case for AGN.
Although Q 0056363 has only been previously observed with ROSAT, ASCA (George et al. 2000) and EXOSAT (Saxton et al. 1993) observations of PG 0804+761 have also occurred, both of which found excess soft emission.
Likewise, EXOSAT (Comastri et al. 1992) identified a soft excess in Mrk 1383 (which they found to be better modelled as a blackbody, rather than a second power-law, agreeing with the data in this paper), while Wilkes & Elvis (1987) found that their Einstein spectrum required less than Galactic absorption – often an indication of soft excess emission. Einstein spectra of Mrk 876 (Masnou et al. 1992; Wilkes & Elvis 1987) did not reveal a soft excess, though.
B2 1028+31 has been previously found to possess a soft excess by Einstein (Wilkes & Elvis 1987; Masnou et al. 1992), ROSAT and ASCA (Sarazin et al. 1999), with the excess being fitted by either a blackbody, or with a broken power-law (over the whole energy band). Sarazin et al. (1999) found the soft excess to contribute 15 per cent of the total X-ray luminosity of the quasar, in complete agreement with the XMM-Newton data presented here. B2 1128+31 and B2 1721+34 do not appear to have had soft excess reported prior to this paper. B2 1721+34 is, however, the largest radio source associated with a quasar (Barthel et al. 1989) and shows superluminal motion.
Although modelling the soft excess in individual objects provides some useful information, comparing a number of objects may lead to a more detailed understanding of the processes involved. Of the different methods for modelling the soft excess covered in this paper (blackbodies, thermal plasma, disc blackbodies and Comptonization), the multiple blackbody fit is statistically the best for all but Mrk 876 (which is better fitted by the thermal mekal model). The disc blackbody results in the worst values. Although the soft excess has been thoroughly investigated since it was first discovered in 1985, the actual form of the emission is still uncertain. The multiple blackbody model generally gives the best results, but it is difficult to see how such emission could physically come about; Comptonization can easily explain the high temperatures observed, though. However, it is still not possible to state with any certainty what the origin of the soft excess truly is.
In order to try and identify any existing trends, various figures were plotted and are discussed below. The relative strengths of the blackbody components compared to the power-laws were given in Table 6. In Figure 5, this ratio is plotted against the broad-band 0.5–10 keV luminosity for each object. There is no correlation between the values (probability of only 68 per cent for a negative correlation, using Spearman Rank analysis). Figure 6 shows that there may be a weak relationship between the 2–10 keV photon index and the relative strength of the soft excess for these QSOs ( 96 per cent for a positive correlation between the values). It has been previously found that Narrow Line Seyfert 1 galaxies show both steep 2–10 keV power-law slopes (Brandt, Mathur & Elvis 1997) and strong soft excesses (corresponding to steep spectra over the ROSAT band; Boller, Brandt & Fink 1996); this could be due to a Compton cooling effect, whereby the excess soft flux cools the power-law electrons. The slight correlation between slope and soft excess found here could also be related to this effect.


Figure 7 plots the Comptonized temperature of the soft excess against the broad-band object luminosity. There is, again, no trend between the values (probability of only 42 per cent from Spearman Rank).

From the three previous plots it is noticeable that there is little difference in the soft excess properties of the RQQs and RLQs, with the temperatures covering a very similar range. The radio-quiet objects show slightly stronger soft excess luminosity ratios, but the values are not widely spread; there is only a factor of three between the weakest and strongest component. The mean luminosity ratio is 0.24 for the RQQs and 0.13 for the RLQs. Using Student’s T-test, there is a probability of 0.046 that the difference is due to chance and that the two samples come from the same group. In other words, there is a 95 per cent probability that the RQQs and RLQs are separate populations when considering the strength of the soft excess. This indicates that there may be a real difference between the groups, but is, by no means, conclusive. This (possible) difference in populations could explain the weak correlation between the soft excess luminosity ratio and the power-law indices above 2 keV: RLQs have flatter slopes and (possibly) weaker soft excesses, with RQQs showing steeper photon indices and more luminous soft excesses. One reason for RLQs having weaker soft excesses could be the dilution of the luminosity ratio by the non-thermal X-ray emission from the radio-jets.
Although this sample is not large, these results indicate that the soft excesses found in radio-quiet and radio-loud AGN are similar, although radio-loud quasars do possess flatter high-energy photon indices. This flatter slope is likely to be due to emission from the relativistic radio jet, implying that the soft excess and radio emission may be unrelated. Also the properties of the soft excess (i.e., ‘strength’ and temperature) do not appear to be dependent on the X-ray luminosity of the source. This is in agreement with Page et al. (2004), who investigated a sample of high luminosity radio-quiet QSOs, finding that the X-ray continuum shape (including the soft excess) remains essentially constant over a wide range of black hole mass and luminosity. Thus, the implication is that the soft excess may be independent of luminosity, black hole mass and radio-loudness. Clearly these results should be investigated for a much larger group of active galaxies, covering a good range of both RQQs and RLQs.
5 Conclusions
The soft excesses of four radio-quiet and three radio-loud QSOs are analysed. As a simple parametrization, two blackbody components fit the soft excess very well. More physically, Comptonization of the disc photons is invoked to explain the soft X-ray emission; this model also provides good fits. There is little obvious intrinsic difference between the soft excess in the radio-quiet and radio-loud objects, with the electron temperatures covering the same range. Five of the objects also showed evidence for iron emission, with three of them being better fitted with a somewhat broadened emission line. These widths are not very large, however, and are significant only at the 95 per cent level.
6 ACKNOWLEDGMENTS
The work in this paper is based on observations with XMM-Newton, an ESA science mission, with instruments and contributions directly funded by ESA and NASA. The authors would like to thank the EPIC Consortium for all their work during the calibration phase, and the SOC and SSC teams for making the observation and analysis possible; also the anonymous referee, whose careful reading and detailed comments improved the paper. This research has made use of the NASA/IPAC Extragalactic Database (NED), which is operated by the Jet Propulsion Laboratory, California Institute of Technology, under contract with the National Aeronautics and Space Administation.
References
- [Arnaud 1985] Arnaud K.A. et al. , 1985, MNRAS, 217, 105
- [Ballantyne 2001] Ballantyne D., Ross R.R., Fabian A.C., 2001, MNRAS, 327 , 10
- [Barthel 1989] Barthel P.D., Hooimeyer J.R., Schilizzi R.T., Miley G.K., Preuss E., 1989, ApJ, 336, 601
- [Boller 1996] Boller Th., Brandt W.N., Fink H., 1996, A&A, 305, 53
- [Brandt 1997] Brandt W.N., Mathur S., Elvis M., 1997, MNRAS, 285, L25
- [Brinkmann 1997] Brinkmann W., Yuan W., Siebert J., 1997, A&A, 319, 413
- [Chartas 2000] Chartas G. et al. , 2000, ApJ, 542, 655
- [Comastri 2003] Comastri A., Brunetti G., Dallacasa D., Bondi M., Pedani M., Setti G., 2003, MNRAS, 340, L52
- [Comastri 1992] Comastri A., Setti G., Zamorani G., Elvis M., Wilkes B.J., McDowell J.C., Giommi P., 1992, ApJ, 384, 62
- [Condon 1998] Condon J.J., Cotton W.D., Greisen E.W., Yin Q.F., Perley R.A., Taylor G.B., Broderick J.J., 1998, AJ, 115, 1693
- [Czerny 1987] Czerny B., Elvis M., 1987, ApJ, 321, 305
- [Czerny 1994] Czerny B., Życki P.T., 1994, ApJ, 431, L5
- [Fabian 2002] Fabian A.C., Celotti A., Johnstone R.M., 2003, MNRAS, 338, L7
- [Fabian 2002] Fabian A.C. et al. , 2002, MNRAS, 335, L1
- [Fiore 1994] Fiore F., Elvis M., McDowell J.C., Siemiginowska A., Wilkes B.J., 1994, ApJ, 431, 515
- [Fiore 1995] Fiore F., Elvis M., Siemiginowska A., Wilkes B.J., McDowell J.C., Mathur S., 1995, ApJ, 449, 74
- [George 2000] George I.M., Turner T.J., Yaqoob T., Netzer H., Laor A., Mushotzky R.F., Nandra K., Takahashi, T., 2000, ApJ, 531, 52
- [Lawson 1992] Lawson A.J., Turner M.J.L., Williams O.R., Stewart G.C., Saxton R.D., 1992, MNRAS, 259, 743
- [Lawson 1997] Lawson A.J., Turner M.J.L., 1997, MNRAS, 288, 920
- [Liedahl 1995] Liedahl D.A., Osterheld A.L., Goldstein W.H., 1995, ApJL, 438, 115
- [Makishima 1986] Makishima K., Maejima Y., Mitsuda K., Bradt H.V., Remillard R.A., Tuohy I.R., Hoshi R., Nakagawa M., 1986, ApJ, 308, 635
- [Malkan 1982] Malkan M.A., Sargent W.L.W., 1982, ApJ, 254, 22
- [Masnou 1992] Masnou J.L., Wilkes B.J., Elvis M., McDowell J.C., Arnaud K.A., 1992, A&A, 253, 35
- [Mason 2001] Mason K.O. et al. , 2001, A&A, 365, L36
- [Mewe 1985] Mewe R., Gronenschild E.H.B.M., van den Oord G.H.J., 1985, A&AS, 62, 197
- [Mewe 1986] Mewe R., Lemen J.R., van den Oord G.H.J., 1986, A&AS, 65, 511
- [Mitsuda 1984] Mitsuda K. et al. , 1984, PASJ, 36, 741
- [Nandra 1994] Nandra K., Pounds K.A., 1994, MNRAS, 268, 405
- [Nandra 1991] Nandra K., Pounds K.A., Stewart G.C., George I.M., Hayashida K., Makino F., Ohashi T., 1991, MNRAS, 248, 760
- [O’Brien 2001] O’Brien P.T., Page K., Reeves J.N., Pounds K.A., Turner M.J.L., Puchnarewicz E.M., 2001, MNRAS, 327, 37
- [Page 2004] Page K.L., Reeves J.N., O’Brien P.T., Turner M.J.L., Worrall D.M., 2004, MNRAS, submitted
- [Page 2003] Page K.L., O’Brien P.T., Reeves J.N., Breeveld A.A., 2003, MNRAS, 340, 1052
- [Peterson 1997] Peterson B.M., 1997, An Introduction to Active Galactic Nuclei, CUP, Cambridge, UK, ISBN 0521479118
- [Piro 1997] Piro L., Matt G., Ricci R., 1997, A&AS, 126, 525
- [Porquet 2003] Porquet D., Reeves J.N., 2003, A&A, 408, 119
- [Pounds 2002] Pounds K.A., Reeves J.N., 2002, in New Visions of the X-ray Universe in the XMM-Newton and Chandra era (astro-ph/0201436)
- [Pounds 2001] Pounds K., Reeves J., O’Brien P., Page K., Turner M., Nayakshin S., 2001, ApJ, 559, 181
- [Pounds 1990] Pounds K.A., Nandra K., Stewart G.C., George I.M., Fabian A.C., 1990, Nature, 344, 132
- [Pounds 1989] Pounds K.A., Nandra K., Stewart G.C., Leighly K., 1989, MNRAS, 240, 769
- [Reeves 2001] Reeves J.N., Turner M.J.L., Pounds K.A., O’Brien P.T., Boller Th., Ferrando P., Kendziorra E., Vercellone S., 2001, A&A, 365, L134
- [Reeves 1997] Reeves J.N., Turner M.J.L., Ohashi T., Kii T., 1997, MNRAS, 292, 468
- [Rybicki 1979] Rybicki G.P., Lightman A.P., 1979, Radiative Processes in Astrophysics, Wiley New York, ISBN 0471048151
- [Saxton 1993] Saxton R.D., Turner M.J.L., Williams O.R., Stewart G.C., Ohashi T., Kii T., 1993, MNRAS, 262, 63
- [Scharf 2003] Scharf C., Smail I., Ivison R., Bower R., van Breugel W., Reuland M., 2003, ApJ, 596, 105
- [Schartel 1996] Schartel N., Walter R., Fink H.H., Trümper J., 1996, A&A, 307, 33
- [Shields 1978] Shields G.A., 1978, Nature, 272, 706
- [Siemiginowska 2003] Siemiginowska A. et al. , 2003, ApJ, 595, 643
- [Sunyaev 1980] Sunyaev R.A., Titarchuk L.G., 1980, A&A, 86, 121
- [Tuner 1989] Turner T.J., Pounds K.A., 1989, MNRAS, 240, 833
- [Walter 1993] Walter R., Fink H.H., 1993, A&A, 274, 105
- [Wilkes 1987] Wilkes B.J., Elvis M., 1987, ApJ, 323, 243
- [Williams 1992] Williams O.R. et al. , 1992, ApJ, 389, 157
- [Xia 2001] Xia T.-S., Zhang J.-L., 2001, A&A, 371, 93
- [Zdziarski 1996] Zdziarski A.A., Johnson W.N., Magdziarz P., 1996, MNRAS, 283, 193
- [Zhou 1992] Zhou Y.Y., Yu K.N., 1992, ApJ, 400, 430