Ultra-Low Iron Abundances in Distant Hot Gas in Galaxy Groups
Abstract
A new XMM observation of the outer regions of the galaxy group NGC 5044 indicates hot gas iron abundances of only between . While the total baryon mass within the virial radius may be close to the cosmic mean value observed in rich clusters, the ratio of total iron mass to optical light in NGC 5044 is about 3 times lower than that in rich clusters. The remarkably low iron abundance over a large volume of the intergroup gas in the outer regions of NGC 5044 cannot be easily understood in terms of the outflow of enriched gas in a group wind during its early history or by the long term enrichment by the group member galaxies that currently occupy this region. It is possible that the stars in NGC 5044 did not produce iron with the same efficiency as in clusters, or the iron resides in non-luminous clouds or stars, or the entropy of the iron-enriched gas created in early galactic starburst winds was too high to penetrate the group gas of lower entropy.
Subject headings:
X-rays: galaxies: clusters – galaxies: halos – galaxies: formation – cooling flows – galaxies: individual: NGC 50441. Introduction
One of the most troublesome and least-discussed inconsistencies with strict hierarchical cosmological scaling is the systematic difference of metallicity between rich clusters and smaller galaxy groups from which they presumably formed. Most heavier elements are contained in the hot intracluster gas and can be measured via X-ray spectroscopy. Although these abundance differences may require modification of IMF-averaged supernova yields, the sense of the group-cluster discrepancy is that groups contain less metals per than clusters (e.g., Renzini, 1997). Similar conclusions were found from gasdynamical models of groups (e.g., Brighenti & Mathews, 1999).
The ratio of iron mass to optical light in rich clusters of galaxies, which are expected to have retained all the metals produced by stars, is in solar units (e.g., Renzini, 1997; Loewenstein, 2004). Adding the iron locked in stars, this increases to . Here we assume an average stellar mass to light ratio and an average stellar iron abundance ZFe,⊙. This value implies that about 0.0035 M⊙ of iron are produced per M⊙ of stars formed (Kawata & Gibson, 2003). The ratio of iron mass to optical light for groups is typically less than about half that of rich clusters (e.g., Renzini, 1997). Even with the superior capabilities of Chandra and XMM, X-ray observations of bright groups have yet to extend to the virial radius, so uncertain extrapolations are required to estimate their total iron and baryon content.
The strong radial iron abundance gradients observed in the hot gas of many isolated galaxy groups are particularly interesting since they suggest that this gas has been relatively undisturbed and unmixed by merging. Gas in the central parts of groups is enriched primarily by Type Ia supernovae (SNIa) in central E or cD galaxies. However, more distant gas is expected to be enriched by early galactic winds from non-central, low luminosity group member galaxies. This raises the interesting question whether or not the smaller amounts of iron observed in hot gas near the periphery of groups can be understood as enrichment by SNII and SNIa in non-central galaxies.
There is general agreement from both ROSAT and ASCA that outside the cores of groups (e.g., Finoguenov & Ponman, 1999; Buote, 2000a). But because of limitations in sensitivity and spectral or spatial resolution, these results were considered tentative. Typically, ROSAT and ASCA found out to kpc. Recently, Sun et al. (2003) have reported iron abundances out to 200 kpc in the galaxy group NGC 1550. Inspection of their figure 4 reveals (rescaled to the solar abundances of Grevesse & Sauval 1998) that between 100-200 kpc but apparently with errors that allow for values as high as .
Previously we reported abundances within the central region of the X-ray luminous group NGC 5044 (Buote et al., 2003b, a, hereafter Paper 1 and Paper 2 respectively) finding within kpc and near kpc. In this Letter we report accurate iron abundance measurements out to kpc () obtained from a new XMM observation of NGC 5044 offset from the center of the group. We demonstrate that the very sub-solar values of we obtain at large radius are in serious conflict with metal enrichment models for galaxy groups, even in the presence of group winds that eject baryons and heavy elements from the system. Full details of the observations, enrichment models, and derived mass distributions of stars, gas, and dark matter will appear in forthcoming papers (Papers 3 and 4). We assume a distance of 33 Mpc to NGC 5044 for which 1′ = 9.6 kpc.
2. Iron Abundance from XMM
| 2D | 3D | |||||||||
|---|---|---|---|---|---|---|---|---|---|---|
| Bin | (arcmin) | (kpc) | (arcmin) | (kpc) | (keV) | (solar) | /dof) | (keV) | (solar) | /dof) |
| 1 | 10.0 | 94.8 | 13.5 | 128.0 | ||||||
| 2 | 13.5 | 128.0 | 19.0 | 180.1 | ||||||
| 3 | 19.0 | 180.1 | 26.0 | 246.5 | ||||||
| 4 | 26.0 | 246.5 | 34.5 | 327.1 | ||||||
Note. — Results of fitting a single APEC plasma model (with Galactic absorption) to the XMM spectra. Quoted errors are . “2D” indicates no deprojection was performed. Radial bin 4 is not included in the deprojection analysis (see text).
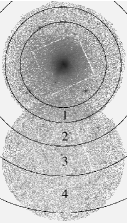
The observation offset due south of NGC 5044 (Figure 1) was performed with the EPIC MOS and PN CCD cameras for a nominal 40 ks exposure during AO-2 as part of the XMM Guest Observer program. The background was very quiescent for the entire observation allowing for cleaned exposures near the nominal value of 40 ks for all CCDs. Although no bright, extended sources appear in the offset field, faint point sources were detected and masked out of the ensuing analysis.
Since background emission is a sizable fraction of the total flux in the offset region, we modeled the background rather than using results from blank fields. We followed previous studies of the X-ray background with XMM (e.g., Lumb et al., 2002) and modeled the instrumental background using out-of field-of-view events for each CCD. The cosmic X-ray background (CXB) was modeled using two thermal plasma components for the hot Galactic halo and a power law for unresolved point sources. Our CXB constraints are quite similar to those reported in previous studies (e.g., Lumb et al., 2002).
We extracted spectra from each XMM detector (MOS1, MOS2, PN) with sections of circular annuli as shown in Figure 1 and listed in Table 1. The center of these annuli coincides with that used Papers 1 and 2. (Note that the portions of the annuli that do not lie on a detector are excluded from the analysis.) Radial bin 1 lies immediately outside the region studied in Papers 1 and 2 but is completely contained within the field of the AO-1 pointing. Consequently, we include the AO-1 data for radial bin 1 in the present analysis and model the background similarly to that described above for the AO-2 observation. Further details of the data reduction and background analysis are discussed in Paper 3.
The source+background models were fitted simultaneously to the spectra of each XMM detector. The source models are APEC thermal plasmas with temperature, iron abundance (), and normalization as free parameters. We use the new standard solar abundances of Grevesse & Sauval (1998). The source parameters and the normalizations of the background components were fitted separately in each radial bin. Results using the best-fitting background model are quoted in this Letter.
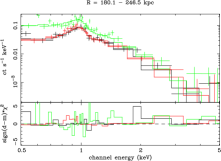
The parameters of the source models obtained from fits to the data without deprojection (i.e., “2D” models) are listed in Table 1. A single temperature component provides a good description of the data. (The fit to the pn is not quite as good as to the MOS due to imperfections in the background model. But excluding key residuals, such as energies between 0.55-0.65 keV and above 3 keV, gives an acceptable fit and provides temperature and consistent with the full-band analysis.) Even at these large radii the Fe L shell lines near 1 keV are clearly visible (Figure 1) and allow for precise constraints on . Over most of the AO-2 field which is much less than the (emission-weighted) average value obtained over 48-96 kpc with the AO-1 data (Paper 2). We note that these low values are robust to errors in the background model; e.g., for radial bin 3, we find that the error on increases from to when accounting for statistical error in the background model parameters. Also, accounting for weak Fe, O, and Ne lines due to solar wind charge exchange emission (Snowden et al., 2004) would reduce slightly our measured values, particularly in bin 4
Since can be underestimated according to the “Fe bias” (e.g., Buote, 2000b), we investigated whether multi-temperature spectral models and spectral deprojection made an important difference in the fitted values. Multi-temperature models (e.g., two-temperature) do not improve the fits significantly and do not yield larger values. Deprojecting the data (i.e., “3D” models – see Paper 1 for details) under the assumption of spherical symmetry also does not significantly improve the fits (see Table 1), though the value of is raised by in radial bin 1. The assumption of spherical symmetry allows us to extrapolate the spectra beyond the areas of the CCDs shown in Figure 1 to the entire azimuthal range. Such extrapolation magnifies azimuthal fluctuations in the source and background intensity within the sections represented by the AO-2 field and becomes increasingly more important in the outer radial bins: the area extrapolation factors are for bins 1-3 and for bin 4. When bin 4 is included in the deprojection, the azimuthally averaged gas density does not decrease monotonically with increasing radius. Consequently, we exclude bin 4 from the deprojection analysis in this Letter.
These measurements currently represent the most accurate constraints on at radii 200-300 kpc from the center of any keV galaxy group and demonstrate at these large radii. Below we use these measurements to constrain the global chemical enrichment of NGC 5044.
3. Inventory of Mass Components
| (kpc) | () | () | () | () |
|---|---|---|---|---|
| 327 | ||||
| 870 | 45.5 | 7.4 | 3.9 | 9.0 |
Note. — Errors are . Quantities listed within kpc are extrapolations using data within kpc.
Estimates of the expected hot gas iron abundance require an inventory of the various mass components: hot gas, stars, dark matter and iron in the hot gas. The integrated masses listed in Table 2 refer to single-phase models of the hot gas except for . Since two-temperature models are superior fits to XMM and Chandra data within kpc and yield larger values, the values of in Table 2 reflect two-temperature models in the core of the group and single-temperature models elsewhere. However, since the gas mass is weighted heavily at large radius, the value of obtained using a single-temperature throughout is quite similar: .
We determined the gravitating mass assuming hydrostatic equilibrium closely following the procedures outlined in Lewis et al. (2003) and Buote & Lewis (2004). The gravitating mass is well described by an NFW (Navarro et al., 1997) model with concentration parameter, , and virial radius, kpc. (Note: here is defined within an overdensity of 103 appropriate for the CDM concordance model.) The value for concentration is within reasonable scatter expected for CDM halos (e.g., Bullock et al., 2001).
To estimate the iron produced by supernovae, we require an estimate of the radial profiles of stellar mass and density in the NGC 5044 group. The central elliptical galaxy can be fit with a de Vaucouleurs profile (Goudfrooij et al., 1994) with effective radius ′′ = 10.05 kpc. With RGC3 magnitudes and extinction (Tonry et al., 2001) we find . This corresponds to a total stellar mass where is appropriate for a galaxy of this (Gerhard et al., 2001) using km sec-1 Mpc-1.
The central E galaxy is surrounded by smaller galaxies () that we shall collectively refer to as “dwarfs”. Only a few dwarf galaxies have known radial velocities. Of the 163 group member galaxies tabulated by Ferguson & Sandage (1990, hereafter FS) we have eliminated three (FS 68, 102 & 137) because their velocities differ by more than km s-1 from NGC 5044. Luminosities have been determined from the magnitudes from FS (with ). According to FS, most dwarf members are early types (dE, dSph, S0, etc.) for which we assume (Karick et al., 2003). Luminosities are converted to mass with , typical for early type dwarfs (Geha et al., 2002) and for late types. The total luminosity and mass of all non-central galaxies are and . The radial mass distribution of the dwarf galaxies is fit with a King profile extending out to kpc with kpc-3 and kpc. Finally, using parameterized fits to the integrated masses within 327 kpc we extrapolated the masses of each component to kpc and list the results in Table 2. For we used a power-law extrapolation based on values in radial bins 1-3.
4. Baryon and Iron Containment
From Table 2 the total baryonic mass within the maximum radius observed, kpc, is . The ratio of baryonic to total mass at is therefore . The baryon fraction extrapolated to the virial radius is less certain but is about 85 percent of the cosmic value . Only about 15 percent of the baryons have been lost from the NGC 5044 group, possibly by group winds at early times if the SNII heating efficiency is sufficiently high.
The total iron mass deficiency of NGC 5044 is much larger. The total amount of stellar iron in the central galaxy is where we assume . The total iron mass in the dwarfs, , is only 1/2 of this, assuming (e.g., Rakos et al., 2001). With these assumptions, the total mass of iron in both stars and gas within and is and .
If iron was initially produced in NGC 5044 with the same efficiency as in rich clusters, we expect that the total mass of iron from all past SNII and SNIa within to be , which exceeds the observed iron mass by at least a factor of . The total iron mass to light ratio, , is about 2 times less than observed in rich clusters. Evidently, about 50 percent of the total iron is unaccounted for in NGC 5044. The amount of missing iron is much greater than the global depletion of baryons, a result that is not very sensitive to our extrapolation to .
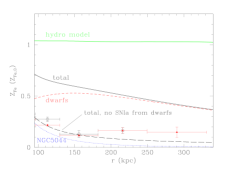
Figure 2 illustrates the hot gas iron abundance measurements for NGC 5044 within the 100 - 300 kpc annulus of the offset region. The iron abundance, , is significantly lower than the typical abundance in rich clusters, . Is the low in this distant gas in NGC 5044 consistent with iron-enriched outflows from the dwarf galaxies in this same region? For an approximate answer to this question we assume that the local gas was enriched by dwarf galaxy winds according to an “on-the-spot” scenario, where the dwarf galaxies (and distant stars of the central E galaxy) are surrounded by the same ambient gas that accompanied them when they first entered the group halo. Orbital models for dwarf member galaxies show that their time-averaged radial positions lie near the virial radius at the time when they first joined the group. In the on-the-spot approximation, the iron abundance in the hot gas is found by subtracting the iron in stars from the total iron produced by all supernovae over time,
where the two terms represent the iron produced by the central E galaxy () and the surrounding cloud of dwarf galaxies (). The stellar iron abundance in the central E galaxy is approximated with (Kobayashi & Arimoto, 1999) although the central galaxy does not appreciably enrich the offset region kpc.
The on-the-spot iron abundance in the offset region plotted in Figure 2 is seen to exceed the observed abundances by factors of 3 - 4. Indeed this discrepancy may be underestimated since on-the-spot enrichment does not include iron expelled from former massive group member galaxies (brighter than the most luminous surviving non-central galaxy, ) that were originally in the offset region but have since merged with the central E galaxy by dynamical friction. The iron abundance observed in kpc is also very much less than that predicted by standard 1D gasdynamical models of early group winds in which metals are uniformly mixed with the ICM (Brighenti & Mathews, 1999). The iron enrichment expected in a typical gasdynamical model using rich cluster SNII rates shown in Figure 2 results in very large beyond 100 kpc. This is due to (1) the outward advection of supernova products from the massive central galaxy and (2) the increased efficiency of increasing by SNIa enrichment when the local gas density is lowered by a global group wind. Finally, accretion of (possibly iron-poor) primordial gas cannot easily account for the low observed . Cosmologically accreted gas, which is included in our dynamical models, flows differentially inward past the dwarf galaxies by less than kpc over years. Shocked gas currently arriving at cannot mix deeper into the group IGM because of its higher entropy.
Both the on-the-spot approximation and the detailed gasdynamical calculations over-predict the iron abundance in the offset region. We offer several possible explanations: (1) the stars in NGC 5044 did not produce iron with the same efficiency as in clusters; in particular, Type Ia supernovae in non-central galaxies do not occur at the expected rate or failed to enrich the local intergalactic gas, (2) iron has been selectively ejected from the group or resides in non-luminous clouds or stars, or, (3) high entropy gas enriched and heated by early SNII and SNIa explosions may not have penetrated deeply inside the NGC 5044 group because of its inherent buoyancy.
References
- Brighenti & Mathews (1999) Brighenti, F. & Mathews, W. G. 1999, ApJ, 515, 542
- Bullock et al. (2001) Bullock, J. S., et al. 2001, MNRAS, 321, 559
- Buote (2000a) Buote, D. A. 2000a, ApJ, 539, 172
- Buote (2000b) —. 2000b, MNRAS, 311, 176
- Buote & Lewis (2004) Buote, D. A. & Lewis, A. D. 2004, ApJ, 604, 116
- Buote et al. (2003a) Buote, D. A., Lewis, A. D., Brighenti, F., & Mathews, W. G. 2003a, ApJ, 594, 741
- Buote et al. (2003b) —. 2003b, ApJ, 595, 151
- Ferguson & Sandage (1990) Ferguson, H. C. & Sandage, A. 1990, AJ, 100, 1
- Finoguenov & Ponman (1999) Finoguenov, A. & Ponman, T. J. 1999, MNRAS, 305, 325
- Geha et al. (2002) Geha, M., Guhathakurta, P., & van der Marel, R. P. 2002, AJ, 124, 3073
- Gerhard et al. (2001) Gerhard, O., Kronawitter, A., Saglia, R. P., & Bender, R. 2001, AJ, 121, 1936
- Goudfrooij et al. (1994) Goudfrooij, P., et al. 1994, A&AS, 105, 341
- Grevesse & Sauval (1998) Grevesse, N. & Sauval, A. J. 1998, Space Science Reviews, 85, 161
- Karick et al. (2003) Karick, A. M., et al. 2003, MNRAS, 344, 188
- Kawata & Gibson (2003) Kawata, D. & Gibson, B. K. 2003, MNRAS, 346, 135
- Kobayashi & Arimoto (1999) Kobayashi, C. & Arimoto, N. 1999, ApJ, 527, 573
- Lewis et al. (2003) Lewis, A. D., Buote, D. A., & Stocke, J. T. 2003, ApJ, 586, 135
- Loewenstein (2004) Loewenstein, M. 2004, (astro-ph/0310557)
- Lumb et al. (2002) Lumb, D. H., Warwick, R. S., Page, M., & De Luca, A. 2002, A&A, 389, 93
- Navarro et al. (1997) Navarro, J. F., Frenk, C. S., & White, S. D. M. 1997, ApJ, 490, 493
- Rakos et al. (2001) Rakos, K., et al. 2001, AJ, 121, 1974
- Renzini (1997) Renzini, A. 1997, ApJ, 488, 35
- Snowden et al. (2004) Snowden, S. L., et al. 2004, (astro-ph/0404354)
- Sun et al. (2003) Sun, M., et al. 2003, ApJ, 598, 250
- Tonry et al. (2001) Tonry, J. L., et al. 2001, ApJ, 546, 681