The INTEGRAL Burst Alert System: Results and Future Perspectives
Abstract
The INTEGRAL Burst Alert System (IBAS) is the software for real time detection of Gamma Ray Bursts (GRBs) and the rapid distribution of their coordinates. IBAS has been running almost continuously at the INTEGRAL Science Data Center since the beginning of the INTEGRAL mission, yielding up to now accurate localizations for 12 GRBs detected in the IBIS field of view. IBAS is able to provide error regions with radii as small as 3 arcminutes (90% c.l.) within a few tens of seconds of the GRB start. We present the current status of IBAS, review the results obtained for the GRBs localized so far, and briefly discuss future prospects for using the IBAS real time information on other classes of variable sources.
keywords:
Gamma-ray Bursts, transients1 Introduction
A new era in the study of Gamma-ray Bursts (GRBs) started with the BeppoSAX observations leading to the discovery of their X–ray, optical and radio afterglows (Costa et al., 1997; van Paradijs et al., 1997; Frail et al., 1997). The great progress which occurred in the last few years in our understanding of GRBs has been possible thanks to extensive multi-wavelength observations of these unpredictable and rapidly fading events. In this respect, a quick derivation and distribution of accurate sky positions for GRBs is crucial. Here we review the contribution in this field obtained during the first 18 months of the INTEGRAL mission. We concentrate on the GRBs observed within the field of view of the IBIS instrument (Ubertini et al., 2003). Bursts observed with the SPI Anticoincidence Shield (ACS) are described elsewhere in these proceedings (Rau et al., 2004).
Thanks to its 72 hours orbit, the INTEGRAL satellite is in continuous contact with the ground stations during the observations. This has allowed us to implement a ground-based software, the INTEGRAL Burst Alert System (IBAS), for the search in near real time of GRBs (Mereghetti et al., 2003a). The IBAS software and its current performances are briefly described in Section 2. In Section 3 we summarize the main results on the twelve GRBs observed to date in the field of view of the INTEGRAL instruments. Finally, in Section 4 we describe the IBAS capability to provide real time information also on other classes of transient sources.
2 IBAS description and performances
A detailed description of IBAS is given in Mereghetti et al. (2003a). Here we briefly remind the most salient features of the system.
As mentioned above, the search for GRBs is done on ground, at the INTEGRAL Science Data Centre (Courvoisier et al., 2003). In fact, no on-board triggering system is present on INTEGRAL and the operating modes of the instruments do not change when a GRB occurs. Since, under nominal conditions, the telemetry data reach the ISDC without important delays, the IBAS programs can run in near real time. Such a ground based system offers some advantages with respect to systems operating on board satellites, e.g. a larger computing power and more flexibility for software and hardware upgrades. In fact, in the course of the first year after the launch of INTEGRAL several changes and additions have been done to the IBAS programs. The current configuration is based on two different methods to look for GRBs in the data from the IBIS lower energy detector ISGRI (Lebrun et al., 2003).
In the first method the overall counting rate is monitored to look for significant excesses with respect to a running average of the background, in a way similar to traditional triggering algorithms used on-board previous satellites. Several different energy ranges and integration times (from 2 ms to 5.12 s) are sampled in parallel. A rapid imaging analysis is performed only when a significant counting rate excess is detected. Imaging allows to eliminate many false triggers caused, e.g. by instrumental effects or background variations that do not produce a point source in the reconstructed sky images. The second method is entirely based on imaging. Images of the sky are continuously produced (integration times of 10, 20, 40 and 100 s) and compared with the previous ones to search for new sources.
The GRB positions derived by IBAS are delivered via Internet to all the interested users. For the GRBs detected with high significance, this is done immediately by the software which sends Alert Packets using the UDP transport protocol. In case of events with lower statistical significance, the alerts are sent only to the members of the IBAS Localization Team, who perform further analysis and, if the GRB is confirmed, can distribute its position with an Off-line Alert Packet.

| GRB | Approximate | Delaya in | External delivery | References |
|---|---|---|---|---|
| duration | position distribution | of IBAS | ||
| [s] | internal/public | Alert Packets | ||
| 021125 | 25 | –b / 0.9 days | OFF | Bazzano & Paizis (2002) |
| 021219 | 6 | 10 s / 5 hr | OFF | Mereghetti et al. (2003b) |
| 030131 | 150 | 21 s / 2 hr | ON | Borkowski et al. (2003) |
| 030227 | 20 | 35 s / 48 min | OFF | Götz et al. (2003b) |
| 030320 | 50 | 12 s / 6 hr | ON | Mereghetti et al. (2003e) |
| 030501 | 40 | 30 s / 30 s | ON | Mereghetti et al. (2003f) |
| 031203 | 30 | 18 s / 18 s | ON | Götz et al. (2003c) |
| 040106 | 60 | 12 s / 12 s | ON | Mereghetti et al. (2004a) |
| 040223 | 250 | 210 s / 210 s | ON | Götz et al. (2004a) |
| 040323 | 20 | 30 s / 30 s | ON | Mereghetti et al. (2004b) |
| 040403 | 35 | 21 s / 21 s | ON | Götz et al. (2004c) |
| 040422 | 8 | 17 s / 17 s | ON | Mereghetti et al. (2004c) |
a Computed from the GRB start time.
b The IBAS Detector Programs were in idle mode owing to the limited telemetry allocation for IBIS/ISGRI during this observation.
The first two months of operations after the INTEGRAL launch were devoted to the optimization of the IBAS parameters. Some changes in the algorithms were also required to adapt them to the in-flight data characteristics. Delivery of the Alert Packets to the external clients started on January 17, 2003. Since then it has always been enabled, except during the first calibration campaign on the Crab Nebula (12-28 February 2003), and a few very short interruption (few hours) due to maintenance reasons.
Up to now (April 2004), twelve GRBs have been discovered in the field of view of IBIS. Figure 1 shows their positions in the fields of view of the INTEGRAL instruments. All of them were at off-axis angles too large to be seen with the OMC and JEM-X instruments.
The time and accuracy performances of the IBAS localizations for these bursts are summarized in Table 1 and illustrated in Figs. 2 and 3. Note that at the beginning of the mission the in-flight instrument misalignment was not calibrated yet. Therefore, error radii as large as 20′ or 30′ were given. The systematic uncertainties could be reduced in the following months, leading to smaller error regions.
The time delay in the distribution of coordinates results from the sum of several factors. First of all there is a delay on board the satellite, which is variable and depends on the instrument. For IBIS/ISGRI data the average delay is about 5 s. Signal propagation to the ground station is negligible (maximum 0.6 s), but some time is required before the data are received at the ISDC. This is on average 3 s when the ESA ground station in Redu (Belgium) is used, or 6 s when the NASA Goldstone ground station is used. The time to detect the GRB depends on the algorithm which triggers. The delay between the trigger time and the GRB onset is of course dependent on the intensity and time profile of the event. The IBAS simultaneous sampling in different timescales should ensure a small delay in most cases, however in practice a minimum of 3 s is required to accumulate an image with enough statistics. Finally, the conversion to sky coordinates, comparison with list of known variable sources, Alert Packet construction and delivery require less than about 2 s. Of course, the above numbers assume nominal condition, i.e. no telemetry gaps, no saturation of the allocated telemetry, no missing auxiliary data files, etc…
As can be seen in Fig. 2 all the burst detected by IBAS after April 2003 had very small error regions distributed within a few tens of seconds, often while the gamma-ray emission was still visible. Such a combination of high speed and small error region was never achieved before. Note that the 210 s delay in the localization of GRB 040223 was due do the particular light curve shape of this burst lasting about 4 minutes and with the brightest peak at the end.


| GRB | Peak Flux | Peak Flux | Fluence | Power law | Ref.b | Afterglow | Ref.b |
|---|---|---|---|---|---|---|---|
| (20-200 keV) | (20-200 keV) | (20-200 keV) | photon indexa | ||||
| [ph cm-2s-1] | [erg cm-2s-1] | [erg cm-2] | |||||
| 021125 | 22 | 2 | 7.4 | 2.2/3.7 | (1) | – | |
| 021219 | 3.7 | 3.5 | 9 | 1.32.5 | (2) | – | |
| 030131 | 1.9 | 1.7 | 7 | (3) | opt. | (3,4) | |
| 030227 | 1.1 | 1.6 | 7.5 | 1.9 | (5) | opt./X | (6,5) |
| 030320 | 5.7 | 5.4 | 1.1 | 1.31.9 | (7) | – | |
| 030501 | 2.7 | 3 | 3 | 1.75 | (8) | – | |
| 031203 | 1.2 | 1.3 | c | c | (9) | radio/opt./X | (10,11,12) |
| 040106 | 0.6 | 6.5 | c | c | (13) | opt.?/X | (14,15) |
| 040223 | 0.4 | 3 | c | c | (16) | X | (17) |
| 040323 | 1.7 | 2.2 | c | c | (18) | opt.? | (19) |
| 040403 | 0.4 | 3 | c | c | (20) | ||
| 040422 | 2.7 | 2.5 | c | c | (21) |
a The two values for GRB 021125 are for the ranges 20-200 keV (ISGRI) and 170-500 keV (PICsIt). The arrow indicates time evolution.
b References: (1) Malaguti et al. (2003); (2) Mereghetti et al. (2003c); (3) Götz et al. (2003a); (4) Fox et al. (2003); (5) Mereghetti et al. (2003d); (6) Castro-Tirado et al. (2003); (7) von Kienlin et al. (2003b); (8) Beckmann et al. (2003); (9) Götz et al. (2003c); (10) Frail et al. (2004); (11) Prochaska et al. (2004); (12) Watson et al. (2004); (13) Mereghetti et al. (2004a); (14) Masetti et al. (2004); (15) Ehle et al. (2004); (16) Götz et al. (2004a); (17) Tiengo et al. (2004); (18) Mereghetti et al. (2004b); (19) Gal-Yam et al. (2004); (20) Götz et al. (2004c); (21) Mereghetti et al. (2004c);
c Results not yet published
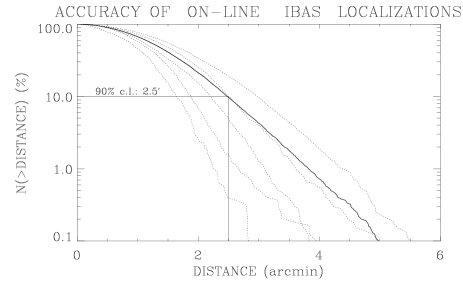
The accuracy of the localizations derived by the IBAS on-line programs (and distributed in the automatic Alert Packets) can be estimated based on the IBAS triggers caused by known sources. Figure 4 shows the distribution of the differences between the true and derived coordinates based on 24,000 triggers from Sco X-1, Cyg X-1, Vela X-1 and other sources with well known positions. From the curves shown in Fig. 4 we can estimate the location accuracy as a function of the source signal to noise ratio (S/N). This is reported in Fig. 5, where it can be seen that the 90% c.l. error radius is smaller than 2.5′ for S/N10 (the current threshold for the automatic delivery of Alert Packets containing the GRB coordinates is S/N=8). Note that the above discussion refers to the on-line imaging analysis which is based on simplified algorithms. In general, the GRB error regions can be further reduced by the more sophisticated interactive analysis performed off-line.


3 Results on Gamma-ray bursts
The main properties of the twelve INTEGRAL GRBs are summarized in Table 2. In Fig. 6 we show the light curves of the first six bursts, as measured with the IBIS/ISGRI instrument. The results for these six bursts, including their spectral analysis, have been published in the references given in Table 2. Most of the spectral information for these bursts is based on IBIS/ISGRI data. Although the nominal range of the instrument is 15 keV - 1 MeV, the coverage above 200-300 keV is actually limited by the small statistics. Thus most of the spectra are well described by a power-law over the 15-200 keV range (see photon index values in Table 2). Only for GRB 030131 a curved spectrum gives a better fit, with parameters of the Band model =1.4, =3 and Eo=70 keV (Götz et al., 2003a). We remark that the spectral response of IBIS in the partially coded field of view is not completely calibrated yet. Therefore, the published GRB spectra should be considered as preliminary. No evidence for spectral lines has been seen so far in the SPI spectra, which are generally in good agreement with the IBIS/ISGRI ones.
Thanks to the good sensitivity of IBIS/ISGRI, it has been possible to study the time evolution of the spectra even for relatively faint bursts. A typical hard to soft variation has been clearly seen in GRB 021219 and GRB 030320 (Mereghetti et al., 2003c; von Kienlin et al., 2003b), and with lower significance in GRB 030227 and GRB 030131 (Mereghetti et al., 2003d; Götz et al., 2003a).
The distribution of peak fluxes for the INTEGRAL bursts is shown in Fig. 8, but of course the small number of events does not allow for the moment a meaningful interpretation of such a LogN-LogP function.
As can be seen in Fig. 9 all the bursts detected so far belong to the long duration class (2 s). The optimization of the IBAS programs and parameters for short bursts required some time, leading, in the first months after the launch, to a bias in favor of long GRBs. However, since the Summer of 2003 IBAS has also a good sensitivity also for short events, as it has been demonstrated by the real time detection of many weak bursts lasting 0.1-0.2 s from SGR 1806-20 (Götz et al., 2004b). Therefore, we expect to obtain a rapid localization also for a short burst in the coming months.
INTEGRAL spends most of the time pointing at Galactic targets. As a consequence the majority of the detected bursts are at low Galactic latitude (see Fig. 7). This is not an ideal situation for what concerns their follow-up observations at other wavelengths. Nevertheless, thanks to the rapid dissemination of their coordinates, X-ray and/or optical/IR afterglows have been reported for six INTEGRAL GRBs.
4 IBAS and other variable sources
The IBAS programs are sensitive to several kinds of variable/transient events, in addition to GRBs. Most of the triggers caused by bright and highly variable sources, like e.g. Sco X-1 or Cyg X-1, represent just a disturbance to the main IBAS task. However, some triggers are due to potentially interesting phenomena. These include type I and type II X-ray bursts from Low Mass X-ray Binaries (see Fig. 10), bursts from Soft Gamma-ray Repeaters, outbursts from known and unknown transients. As for GRBs, the information on the occurrence of these events is derived in real time (i.e. within few tens of seconds). To avoid alerting the community of users mainly interested in GRBs and to comply with the INTEGRAL data rights rules, all the IBAS Alert Packets with derived coordinates consistent with the positions in a list of known sources are not distributed (except for Soft Gamma-ray Repeaters, whose alerts are being distributed since January 2004).

We give here just two examples of interesting cases. One is the new transient hard X-ray source IGR J17544–2619, discovered by INTEGRAL in the Galactic bulge region. The second example is the very high state reached by the high mass X-ray binary pulsar Vela X-1 on November 28, 2003 (Staubert et al., 2004). In both cases the IBAS programs triggered in real time, while the public announcements were given respectively 14 hours and 4 days later (Sunyaev et al., 2003; Krivonos et al., 2003). Rapid follow-up at other wavelengths would have provided very useful information: the first outburst from IGR J17544–2619 (the one during which it was discovered) lasted only two hours, while the 15-40 keV flux of Vela X-1 increased from 0.5 to 7 Crabs during the first 5400 s before decreasing in the following hours.
In general, these “secondary” IBAS results are used to complement the quick-look analysis performed at the ISDC. However, the real time information which is potentially available through IBAS is not fully exploited yet. We plan to implement these capabilities in the future, possibly also including the use of JEM-X data. Robotic optical/IR telescopes operating on ground, as well as satellites with a rapid reaction time, such as Swift (Gehrels, 2001), could benefit from the IBAS alert messages to perform follow-up observations of X-ray transients with an unprecedented rapidity.
Acknowledgments
This work has been partly funded by ASI. JB was supported by grant 2P03C00619p02 from KBN.
References
- Bazzano & Paizis (2002) Bazzano, A. & Paizis A. 2002, GCN Circ. n. 1706
- Beckmann et al. (2003) Beckmann V., Borkowski J., Courvoisier T.J.-L., et al. 2003, A&A 411, L327
- Borkowski et al. (2003) Borkowski J., Götz D. & Mereghetti S. 2003, GCN Circ. n. 1836
- Castro-Tirado et al. (2003) Castro-Tirado A.J., Gorosabel J, Guziy S., et al. 2003, A&A 411, L315
- Costa et al. (1997) Costa E., Frontera F., Heise J., et al. 1997, Nature 387, 783
- Courvoisier et al. (2003) Courvoisier T.J.-L., Walter R., Beckmann V., et al. 2003, A&A 411, L53
- Ehle et al. (2004) Ehle M. et al. 2004, GCN Circ. n. 2508
- Fox et al. (2003) Fox D.W., Price P.A., Heter T., et al. 2003, GCN Circ. n. 1857
- Frail et al. (1997) Frail D.A., Kulkarni S.L., Nicastro S.R., et al. 1997, Nature 389, 261
- Frail et al. (2004) Frail D. et al. 2004, GCN Circ. n. 2473
- Gal-Yam et al. (2004) Gal-Yam A. et al. 2004, GCN Circ. n. 2555
- Gehrels (2001) Gehrels N. 2001, in Gamma-Ray Bursts in the Afterglow Era, eds. E. Costa, F. Frontera & J. Hjorth, Berlin, Heidelberg, Springer, p. 357
- Götz & Mereghetti (2004a) Götz D. & Mereghetti S. 2004a, GCN Circ. n. 2506
- Götz & Mereghetti (2004b) Götz D. & Mereghetti S. 2004b, GCN Circ. n. 2526
- Götz et al. (2003a) Götz D., Mereghetti S., Hurley K., et al. 2003a, A&A 409, 831
- Götz et al. (2003b) Götz D., Borkowski J. & Mereghetti S. 2003b, GCN Circ. n. 1895
- Götz et al. (2003c) Götz D., Mereghetti S., Beck M., et al. 2003c, GCN Circ. n. 2459
- Götz et al. (2004a) Götz D., Mereghetti S., Beck M., et al. 2004a, GCN Circ. n. 2525
- Götz et al. (2004b) Götz D., Mereghetti S., Mirabel F. & Hurley K. 2004b, A&A 417, L45
- Götz et al. (2004c) Götz D., Mereghetti S., Borkowski J., et al. 2004c, GCN Circ. n. 2560
- Krivonos et al. (2003) Krivonos R. et al. 2003, ATEL n. 211
- Lebrun et al. (2003) Lebrun F., Leray J.P., Lavocat P., et al. 2003, A&A 411, L141
- Malaguti et al. (2003) Malaguti G., Bazzano A., Beckmann V., et al. 2003, A&A 411, L307
- Masetti et al. (2004) Masetti N. et al. 2004, GCN Circ. n. 2515
- Mereghetti & Götz (2004) Mereghetti S. & Götz D., GCN Circ. n. 2460
- Mereghetti et al. (2003a) Mereghetti S., Götz D., Borkowski J., et al. 2003a, A&A 411, L291
- Mereghetti et al. (2003b) Mereghetti S., Götz D. & Borkowski J. 2002b, GCN Circ. n. 1731
- Mereghetti et al. (2003c) Mereghetti S., Götz D., Beckmann V., et al. 2003c, A&A 411, L311
- Mereghetti et al. (2003d) Mereghetti S., Götz D., Tiengo A., et al. 2003d, ApJ 590, L73
- Mereghetti et al. (2003e) Mereghetti S., Götz D. & Borkowski J., et al. 2003e, GCN Circ. n. 1941
- Mereghetti et al. (2003f) Mereghetti S., Götz D., Borkowski J., Shaw S. & Courvoisier T. 2003f, GCN Circ. n. 2183
- Mereghetti et al. (2004a) Mereghetti S., Götz D., Beck M. & Borkowski J. 2004a, GCN Circ. n. 2505
- Mereghetti et al. (2004b) Mereghetti S., Götz D., Beck M. et al. 2004b, GCN Circ. n. 2551
- Mereghetti et al. (2004c) Mereghetti S., Götz D., Borkowski J. et al. 2004c, GCN Circ. n. 2572
- Prochaska et al. (2004) Prochaska J.X. et al. 2004, astro-ph/0402085
- Rau et al. (2004) Rau A., et al. 2004, these proceedings
- Staubert et al. (2004) Staubert R. et al. 2004, these proceedings
- Sunyaev et al. (2003) Sunyaev R. et al. 2003, ATEL n.190
- Tiengo et al. (2004) Tiengo A., Mereghetti S. & De Luca A. 2004, GCN Circ. n. 2548
- Ubertini et al. (2003) Ubertini P., Lebrun F., Di Cocco G., et al. 2003, A&A 411, L131
- van Paradijs et al. (1997) van Paradijs J., Groot P.J., Galama T., et al. 1997, Nature 386, 686
- von Kienlin et al. (2003b) von Kienlin A., Beckmann V., Covino S., et al. 2003b, A&A 411, L321
- Watson et al. (2004) Watson D. et al. 2004, ApJ 605, L101