First results on the HMXRB Pulsar SAX J2103.5+4545 with INTEGRAL
Abstract
We report on the preliminary timing and spectral analysis of the High Mass X-ray Binary Pulsar SAXJ2103.5+4545 as observed with INTEGRAL during the Galactic Plan Scan of the Core Program. The source shows a hard spectrum, being detected up to 100 keV. The timing analysis performed on IBIS/ISGRI data shows evidence for a spin-up with respect to previous observations, performed in 1997 with BeppoSAX.
keywords:
X–rays; accreting pulsar; individual: SAX J2103.5+45451 Introduction
SAX J2103.5+4545 is a transient HMXRB pulsar with a 358 s pulse period discovered with the WFC on-board BeppoSAX during an outburst in 1997 (Hulleman et al., 1998). Its orbital period of 12.68 days has been found with the RXTE during the 1999 outburst (Baykal et al., 2000). The likely optical counterpart, a Be star with a magnitude V=14.2, has been recently discovered (Reig & Mavromatakis, 2003; Reig et al. 2004).
During the outburst in 1999, Baykal et al. (2002) observed for the first time, with RXTE, the transition from the spin-up phase to the spin-down regime, while the X–ray flux was declining. Indeed, the source underwent a spin-up phase during the initial part of the outburst (during which the pulse period decreased by 0.9 s in 150 days), then the flux dropped (and the pulse frequency saturated), and, as the flux continued to decline, a weak spin-down phase started. Moreover, a correlation between spin-up rate and X–ray flux was observed (Baykal et al., 2002), suggestive of the formation of an accretion disk during the periastron passage.
A very preliminary spectral analysis of INTEGRAL public observations of the source region, performed in Dec.2002 during the performance verification phase, has been reported by Lutovinov et al. (2003).
Inam et al. (2004) observed a soft spectral component (blackbody with a temperature of 1.9 keV) and a transient 22.7 s QPO during a XMM-Newton observation performed in Jan, 2003.
SAX J2103.5+4545 has been observed several times during the Galactic Plane Scan (GPS) which INTEGRAL performs every 12 days as part of the Core Program. We report here the timing and spectral analysis of these observations.
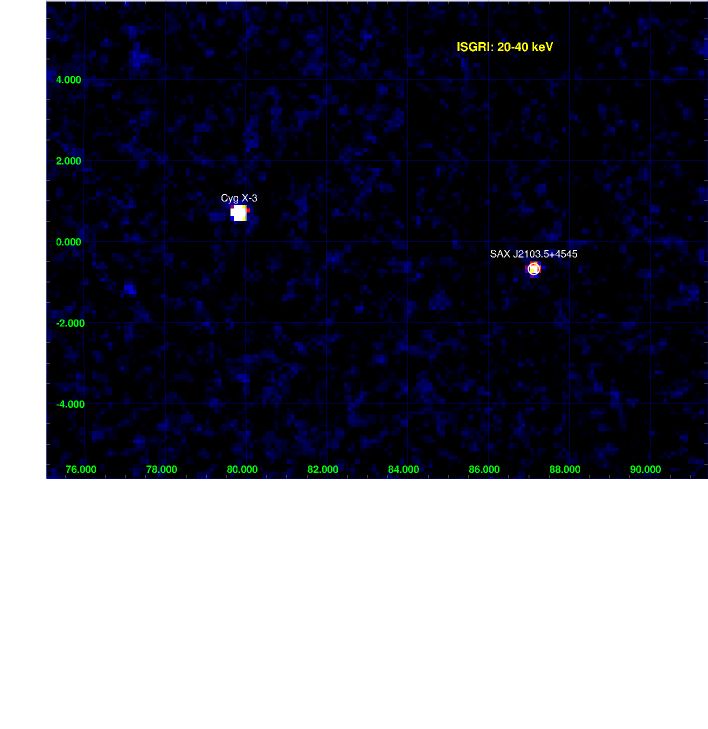
An IBIS/ISGRI mosaic of the region of the sky containing SAX J2103.5+4545 is shown in Fig. 1. The source long-term lightcurve, as measured with RXTE All Sky Monitor (ASM) is shown in Fig. 2. The times of the two previous outbursts observed with BeppoSAX (in 1997) and RXTE (in 1999) are indicated, as well as the epoch of the INTEGRAL observations reported here.

2 Timing Results
We have analysed 20 GPS pointings (duration of about 2000 s each) covering the region of the sky containing the pulsar. This sky region is not covered during the Galactic Center Deep Exposure.
In Fig. 3 we show the IBIS/ISGRI lightcurve of SAX 2103.5+4545, where each point corresponds to the flux from a single pointing.

The data have been reduced using OSA3 release of the analysis software. For each pointing we extracted events with a Pixel Illumination Function (pixel fraction illuminated by the source), PIF, equal to 1. After correcting times to the solar system barycenter, we searched for periodicity around the known pulse period. We have found a clear peak in the distribution in 10 observations with IBIS/ISGRI, and only in 3 with JEM-X. The estimated pulse periods for each pointing are reported in the Table 1, while in Table 2 we report the measurements of the pulse period obtained adding together two consecutive pointings, and doing the same search for periodicities on the new data-set. The uncertainties on the pulse periods have been estimated from the Leahy function (Leahy 1987).
| ID. | ISGRI rate | Start Time | Pulse Period | Pulse Period |
|---|---|---|---|---|
| 20-40 keV (s-1) | (MJD) | with ISGRI (s) | with JEM-X (s) | |
| 1 | 5.06 | 52722.88 | 349 | 334 |
| 2 | 3.58 | 52737.07 | 366 | |
| 3 | 6.02 | 52746.10 | 341 | |
| 4 | 5.41 | 52746.13 | 364 | |
| 5 | 4.81 | 52761.29 | 350 | |
| 6 | 8.80 | 52770.02 | 360 | |
| 7 | 7.85 | 52770.05 | 357 | |
| 8 | 7.92 | 52770.08 | 348 | 368 |
| 9 | 6.61 | 52782.09 | 353 | 351 |
| 10 | 7.10 | 52782.12 | 369 |
| Start Time | Stop Time | Period |
|---|---|---|
| MJD | MJD | s |
| 52746.10 | 52746.15 | 353 |
| 52770.05 | 52770.10 | 350 |
Our best determination of the pulse period, P, is 350 s (ISGRI, 20-40 keV) indicating a clear spin up with respect to RXTE and BeppoSAX estimates (see Figs. 4 and 5 for the distribution and the pulse profile, respectively).


A period derivative of about -410-7 s s-1 can be measured with respect to the latest RXTE measurement (P=354.794; Inam et al. 2004) performed in Jan, 2003 indicating an increasing spin-up rate during the last outburst (see Fig. 6). We caution that the pulse period history is poorly sampled (Fig. 6), making the measurement of the period derivative quite uncertain. Anyway, our estimate is compatible with the extrapolation at higher X–ray fluxes (10-9 erg cm-2 s-1) of the correlation between the period derivative and the X–ray flux, measured by Baykal et al. (2002) during the source outburst in 1999 (see their Fig. 7).

3 Spectral Results
The results on the spectral analysis from the three instruments JEM-X, IBIS/ISGRI and SPI, should be considered very preliminary. Indeed, still large calibration and inter-calibration uncertainties exist.
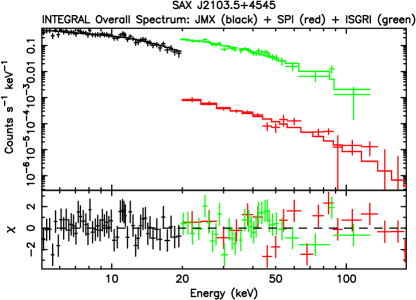
The overall average source spectrum from 5 to 200 keV, obtained combining JEM-X together with IBIS/ISGRI and SPI, is quite hard. We here fitted it with a cut-off powerlaw (including free relative normalizations between the three instruments). The resulting spectral parameters are a photon index of 1.1 and a high energy cutoff of 30 keV (see Fig. 7). The 2–100 keV flux is 1.510-9 erg cm-2 s-1 (based on JEM-X and SPI response matrices).
The derived spectral parameters are consistent with the WFC/BeppoSAX model (Hulleman et al., 1998).
References
- (1) Baykal, A., et al., 2000, ApJ, 544, L129.
- (2) Baykal, A., et al., 2002, ApJ, 569, 903.
- (3) Hulleman, F., in ’t Zand, J.J.M., Heise, J., 1998, A&A, 337, L25
- (4) Inam, S.C., et al., 2004, astro-ph/0402221, submitted to ApJ
- (5) Leahy, D.A., 1987, A&A, 180, 275
- (6) Lutovinov, A., et al., 2003, Astron.Lett., 29, 713
- (7) Reig, P., Mavromatakis, F., 2003, Atel 173
- (8) Reig, P., et al., 2004, A&A in press (astro-ph/0404121)