Ambient interstellar pressure and superbubble evolution
Abstract
High ambient interstellar pressure is suggested as a possible factor to explain the ubiquitous observed growth-rate discrepancy for supernova-driven superbubbles and stellar wind bubbles. Pressures of are plausible for regions with high star formation rates, and these values are intermediate between the estimated Galactic mid-plane pressure and those observed in starburst galaxies. High-pressure components also are commonly seen in Galactic ISM localizations. We demonstrate the sensitivity of shell growth to the ambient pressure, and suggest that superbubbles ultimately might serve as ISM barometers.
Subject headings:
galaxies: ISM — Magellanic Clouds — ISM: bubbles — ISM: general — supernova remnants1. Introduction
Mechanical feedback from supernovae (SNe) and stellar winds is an important driver of galactic evolutionary processes. It affects the phase balance and physical conditions of the interstellar medium (ISM), which in turn determine star-forming conditions, galactic chemical evolution, and properties of the intergalactic medium. The standard paradigm for mechanical feedback is based on the model for adiabatic evolution of the shells and superbubbles (e.g., Pikel’ner 1968; Weaver et al. 1977; Mac Low & McCray 1988) that are the direct consequence of SN and stellar wind action.
While this model for pressure-driven superbubbles is broadly consistent with observations spanning scales from individual stellar wind bubbles to galactic superwinds, nagging problems persist in comparisons with observations (e.g., see Oey 2004 for a review). Specifics regarding the energy budgets, fate of the shock-heated K gas, and later-stage evolution are lacking and have profound consequences for galactic evolution.
One problem that is empirically well-established is the result that most superbubbles apparently grow more slowly than expected. This has been observed in individual stellar wind bubbles such as Wolf-Rayet nebulae (Treffers & Chu 1982; García-Segura & Mac Low 1995; Drissen et al. 1995), as well as in superbubbles powered by OB associations (e.g., Oey 1996; Oey & Smedley 1998; Brown et al. 1995; Saken et al. 1992). This growth-rate discrepancy has been identified in young, nebular shell systems, in which the parent OB association is still present; thus the input mechanical power is well-constrained. The discrepancy is seen both in objects that show no evidence of previous supernova activity, and in ones where one or two supernovae have already exploded (Oey 1996; hereafter O96).
For constant input mechanical power and ambient number density , the evolution of the shell radius is given by (e.g., Castor, McCray, & Weaver 1975),
| (1) |
where is in units of , and is age of the bubble in Myr. The shell expansion velocity is the time derivative of equation 1. One possible solution to the growth-rate discrepancy suggests that the input parameter is systematically overestimated. For eight nebular superbubbles with well-constrained , , , and , Oey and collaborators (O96; Oey & Massey 1995; Oey & Smedley 1998) showed that would need to be reduced by a factor of several, perhaps up to an order of magnitude, to reconcile the observations with prediction. Since stellar wind power is sensitive to the stellar mass, a substantial uncertainty in is not unreasonable. As shown by multi-wavelength observations of three of the superbubbles (Oey et al. 2002), the multi-phase ambient ISM also renders similarly uncertain. However, the implication of a systematic growth-rate discrepancy remains difficult to explain.
Another favorite candidate to solve the problem is cooling of the hot interior whose pressure drives the shell growth. If this scenario is correct, it implies a departure from the adiabatic evolution. The mass within the hot bubble interior is dominated by material evaporated from the cool shell walls, and could be supplemented by additional material evaporated and ablated from small clouds that are overrun by the expanding shocks (Cowie & McKee 1977; McKee et al. 1984; Arthur & Henney 1996). This enhanced interior density would facilitate radiative cooling. Silich et al. (2001) and Silich & Oey (2002) also show that the enhanced metallicity caused by SN explosions and stellar products can further facilitate the cooling, especially for low-metallicity objects. However, increased X-ray luminosities that are expected from enhanced cooling thus far have not been observed (Chu et al. 2003; Chu et al. 1995).
The superbubbles studied by Oey and collaborators are all located in the Large Magellanic Cloud (LMC). For these objects, Silich & Franco (1999) suggested that the ambient environment and viewing geometry conspire to yield misleading observed shell dynamics. They suggest that the superbubbles are more extended perpendicular to the galaxy’s plane, as would be expected in the plane-stratified density distribution of disk galaxies (but see also Maciejewski & Cox 1999). The elongation of the shells would not be apparent because of the LMC’s almost face-on orientation. While this is an attractive suggestion for the LMC objects, it does not explain the growth-rate discrepancy seen in Galactic (e.g., Brown et al. 1995; Saken et al. 1992) and M33 (Hunter et al. 1995) objects.
Nevertheless, it is apparent that the ambient environment plays a crucial role in the superbubble growth and evolution. In addition to the work of Silich & Franco (1999), other studies have shown that the shell dynamics are sensitive to the ambient density structure (e.g., Oey & Smedley 1998; Mac Low et al. 1998). Multi-wavelength observations also show that the ambient multiphase gas distribution is difficult to constrain without direct such observations (Oey et al. 2002).
2. The interstellar pressure
| DEM | |||||||||
|---|---|---|---|---|---|---|---|---|---|
| (pc) bbUncertainty %. | () ccObjects with “:” uncertain to 50%, but see text; others %. See O96 for source references for . | (log s-1) ddUncertainty of order a factor of 2. | 3.48 | 4.12 | 5.26 | 7.84 | |||
| Pre-SN superbubbles | |||||||||
| L31 | 50 | 30: | 50.161 | 1 | 0 | 0 | 1 | 4 | 2 |
| L106 | 30 | 49.745 | 0 | 1 | 0 | 2 | 0 | 4 | |
| L226 | 28 | 49.403 | 0 | 0 | 1 | 1 | 0 | 1 | |
| Post-SN superbubbleseeValues in parentheses show original number of stars implied by the IMF, from O96. | |||||||||
| L25 | 43 | 60: | 48.459 | 0 | 0 | 0 (1) | 0 (1) | 2 | 2 |
| L50 | 50 | 25 | 49.342 | 0 | 0 (1) | 0 (1) | 3 | 1 | 7 |
| L301 | 53 | 40: | 50.310 | 0 | 0 | 0 (1) | 3 | 3 | 1 |
Continuing to focus on the ambient environment, this present work now investigates the effect of the ambient pressure. Since most superbubble growth is eventually expected to become confined by the ambient interstellar pressure (Oey & Clarke 1997), this parameter is also worth examining more closely. We note that Dopita et al. (1981) suggested an active pressure mechanism to confine the shell of one LMC object by invoking exterior ram pressure caused by contraction of a surrounding interstellar cloud. Here, we suggest that the typical interstellar pressures in some systems may be higher than assumed.
In our earlier work, we used a simple, semi-analytic, 1-D model that integrates the shell’s equations of motion (O96; Oey & Massey 1995). For our sample of eight young, nebular superbubbles, we tailored the model input parameters () according to the individual, empirically-derived values. As mentioned above, these highly constrained models confirm the ubiquitous growth-rate discrepancy between the observed and predicted shell radius and expansion velocity (e.g., O96). The model predicts that the interior pressure evolves as (e.g., Weaver et al. 1977),
| (2) |
In our above studies, the ambient interstellar pressure was estimated as The soundspeed was usually estimated as for ionized nebular gas, provided that remains smaller than the Strömgren radius; is the mass density; and is the equation of state index, which was taken to be 5/3 for the adiabatic condition. For ranging between 1 and 10 , as estimated for our objects, this yields to .
For the Milky Way, the total mid-plane ISM pressure is generally estimated to be around . This includes roughly equal empirical contributions from the diffuse thermal pressure, magnetic field pressure, non-thermal velocity field or turbulent pressure, and cosmic ray pressure; a good discussion is presented by Slavin & Cox (1993). This value is consistent with the constraint derived by Boulares & Cox (1990) that the pressure required to support the weight of the Galactic ISM is .
In recent years, turbulent velocity structure is becoming more quantified as one of the major, and perhaps dominant, kinematic properties of the ISM in star-forming galaxies. This is linked to a new paradigm shift for the ISM to less distinct thermal phases, in which cool clouds are transient, unconfined features, rather than distinct and well-defined entities (Vázquez-Semadeni 2002; Kritsuk & Norman 2002). This turbulence-dominated view of the ISM implies a strong presence of components and localizations that are not in pressure equilibrium (Mac Low et al. 2001; Kim et al. 2001). Such components are now being ubiquitously identified in thermal pressure distributions determined for lines of sight to Galactic stars (Jenkins & Tripp 2001; Wallerstein et al. 1995), where these are found to have thermal . Also note that the turbulent pressure for the hot, ionized medium (HIM) if we consider values of and turbulent velocity dispersion . The magnetic field pressure also shows occasional hints for high-value components (e.g., Edgar & Cox 1993). On the other hand, the cosmic ray pressure contribution may be less relevant to confining superbubble growth since the shells may be transparent to cosmic rays (Slavin & Cox 1993).
The above factors apply to the Milky Way, which is a giant disk galaxy whose midplane ISM pressure should be substantially higher than in a Magellanic irregular galaxy like the LMC, where all of our sample objects are located. Thus, one could argue that estimated by our earlier models are already on the high side of what might be expected. On the other hand, several of the pressure terms, namely, the thermal, turbulent, and cosmic ray pressures, should scale with star formation rate (SFR) per unit volume. Thermal pressures within star forming regions themselves are of order (e.g., Malhotra et al. 2001), and superbubbles generally originate within such regions, although presumably they outgrow and outlive them. For a high filling factor or interstellar porosity generated by the superbubble activity, it is also quite likely that the magnetic pressure is also determined by the SFR. The magnetic field strength is correlated with gas density, yielding localized values of order a few hundred G in Galactic molecular clouds and star-forming regions (Crutcher 1999). The expansion of superbubbles themselves also compresses the magnetic field, causing a self-induced impedance (Slavin & Cox 1992). On large scales, radio synchrotron measurements for other galaxies are showing magnetic field strengths of G in actively star-forming galaxies, and up to G in spiral arms (Beck 2004). Such values imply magnetic pressures alone of order .
The LMC has one of the highest SFR per unit volume in the Local Group. Its interstellar porosity is exceeded only by that of IC 10 (Oey et al. 2001), although for the Milky Way is difficult to determine. Taking the SFR consistently estimated from the H II region luminosity function for both the Galaxy (Oey & Clarke 1997) and the LMC (Oey et al. 2001), we obtain porosities of and 1, respectively. The formal for IC 10 is an order of magnitude higher yet. Thus it is not unreasonable that the LMC may have total interstellar pressures that are similar to, or in excess of, those of the Milky Way. We can also compare with the central few kpc of nuclear starburst galaxies like M82, which have empirically determined (e.g., Lord et al. 1996). If the Milky Way ISM, with , is typical for ordinary star-forming galaxies, then galaxies with SFR intermediate between “ordinary” and starburst, like the LMC, should be expected to likewise have interstellar pressures that are intermediate, namely, of order . Equation 2 shows that such values would be significant in counteracting the pressure-driven shell growth.
3. Models of LMC superbubble evolution
In light of the above, it is worth further exploring the effects of the ambient pressure parameter on the superbubble evolution. We return to the same LMC objects studied by O96, now modeling these with 1-D hydrodynamical computations using the magneto-hydrodynamic fluid solver ZEUS-3D (version 3.4). This code is the updated, 3-D version of the two-dimensional code ZEUS-2D (Stone & Norman 1992), an Eulerian explicit code which integrates the equations of hydrodynamics for a magnetized ideal gas. The code also works efficiently in one dimension, and we perform the simulations in spherical coordinates, with 1000 zones in the radial direction . Taking the time-dependent stellar wind mechanical luminosity for each object from O96, we assume a constant terminal velocity , yielding a wind density , where is the wind mass-loss rate. O96 estimated from the observed and inferred stellar population (Table 1, below) based on empirical relations between wind properties and spectral type, and evolutionary models. The time-dependent wind conditions are set within the first few radial computational zones, centered at the origin.
ZEUS-3D does not include radiation transfer, but we have implemented a simple approximation to derive the location of the ionization front for arbitrary density distributions (see Bodenheimer et al. 1979). This is done by assuming that ionization equilibrium holds at all times, and that the gas is fully ionized inside the HII region. The position of the ionization front is given by , where is the stellar H-ionizing emission rate and is the Case B recombination coefficient.
The models include the Raymond & Smith (1977) cooling curve above K. For temperatures below K, the shocked gas region is allowed to cool down with the radiative cooling curves given by Dalgarno & McCray (1972) and MacDonald & Bailey (1981). Finally, the photoionized gas is always kept at K , so no cooling curve is applied to the HII regions (unless there is a shock inside the photoionized region).
We assume an initially homogeneous ISM, which supplies the external pressure. Given the existence of large non-thermal “turbulent” velocities, of several km s-1, cosmic rays and magnetic fields, the pressure should be obviously a combination of all of them, as discussed above. However, to simplify computation, we model the total ambient pressure as originating entirely from thermal pressure. Thus, in order to have thermal pressures of K, we adopt for the ISM density and 6000 K for the temperature. This gives us a sound speed of . For a second set of models with K, we use an ISM density of and 6000 K for the temperature.


Table 1 gives the observed nebular radius , nebular expansion velocity , and in columns 2 – 4, respectively, for the sample objects. Columns 5 – 10 give the observed and pre-SN inferred massive star population down to . O96 describes how the input mechanical power due to stellar winds and SNe is estimated from the individual massive star populations as a function of time. Figures 1 and 2 of O96 show that for these objects typically have early values of . All parameters are listed in Table 1 as measured and compiled from the literature by O96, except for , which is estimated by Oey & Kennicutt (1997). The objects are divide into “Pre-SN” and “Post-SN” categories: the Pre-SN objects show no enhanced X-ray emission or enhanced [S II]/H ratios, thus are presumed to have no prior SN activity. Objects listed as Post-SN show both enhanced X-ray emission (Chu & Mac Low 1990; Wang & Helfand 1991) and [S II]/H, indicating recent SN impacts on the shell walls; the masses of the SN progenitors are estimated from the stellar initial mass functions (IMF) and included in for the models, as done by O96.
Figure 1 shows our new models for the gas mass density as a function of radius, using the input determined by O96 from the observed stellar population (Table 1) of the individual LMC objects. These models adopt a high ambient pressure . As discussed earlier, contributions from turbulent, magnetic, and multi-phase thermal pressure terms would presumably contribute to such high ambient values. The models are those corresponding to the observed radii in Table 1, with Pre-SN objects shown in the left column, and Post-SN objects shown on the right. Figure 2 shows the gas velocity as a function of radius for the same models. The location of the observable ionized nebula is shown between the vertical dashed and dotted line in both Figures.
Comparison with Table 1 shows that the high-pressure models are in good agreement with the observed parameters in all cases: the predicted ionized radius, expansion velocity, and age are all reasonably consistent with the observed values. In Figure 4 we reproduce H images of the superbubbles from Figure 1 of Oey (1996). Figure 4 also shows that the putative Pre-SN objects DEM L106 and L226 show thicker nebular shells, of order 10% of , whereas the post-SN objects show compressed, filamentary morphology. DEM L31, presumed to be Pre-SN, is also quite filamentary, and the model also reproduces this structure, owing primarily to its high input power (Table 1). This is fully consistent with the predicted morphology of the ionized regions in the models.

The velocity profiles shown in Figure 2 also imply observed velocities that are reasonably consistent with the data (Table 1). The latter are especially complex for the most filamentary objects, showing velocity components that vary by factors of 2–3. This is consistent with the extreme gradients in both density and velocity seen in the models. Figure 3 shows the resulting predicted, positive velocity profiles with respect to the systemic velocities, integrated through the centers of the superbubbles. DEM L31 and DEM L301 show a significant range in velocity, and maximum values consistent with those observed. Predicted velocities for the remaining objects are also consistent with the observed upper limits. We note that both observations and models are likely to be sensitive to details of geometry and ionization in the post-SN objects, since complex shock structures are generated on short timescales. Thus it is unsurprising that the model velocity profiles tend to be more simplistic than the observations. We also see that the models for DEM L25 and DEM L50 imply that the ionization front does not penetrate the high-density shell (Figure 1); however, observations of these objects do show high-density, filamentary structure that is fully ionized for DEM L25, and mostly ionized for DEM L50 (Oey et al. 2002). Oey & Kennicutt (1997) find excess in the nebular emission, by factor of a few, beyond what can be attributed to stellar photoionization. Thus, shock excitation is likely to enhance the ionized mass and radius of these objects. Nevertheless, the broad agreement in the dominant shell parameters across the sample demonstrates that a high ambient pressure alone can solve the growth-rate discrepancy that is widely observed in such objects.
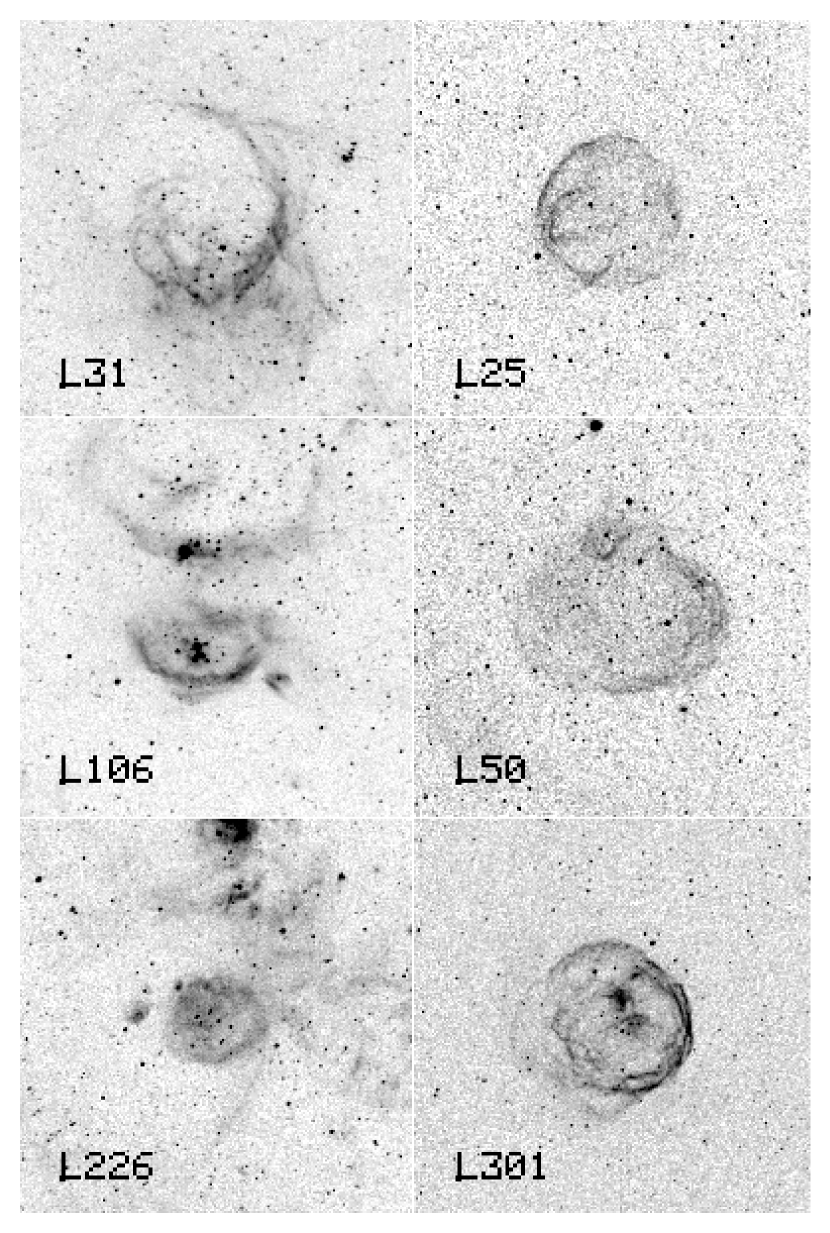


Figure 5 shows the density profile evolution modeled for the parameters of DEM L226 and DEM L25. The former is representative of Pre-SN, low- objects; and the latter is representative of Post-SN, higher- objects. The curves show a sequence of density profiles over 10 Myr at yr intervals, from top to bottom. We see that the evolution of both objects is similar, but that the model for DEM L226 does not generate enough internal pressure to maintain shell growth within the modeled time frame: the central cavity is seen to become pressure-confined, and to start collapsing. On the other hand, the predicted evolution for DEM L25 does maintain shell growth within the modeled time frame. In both models, the shell thickens and diffuses as the expansion falls below the soundspeed, thereby allowing the shock front and shell to dissipate. This is consistent with behavior found by Slavin & Cox (1992) and García-Segura & Franco (1996) for similar pressure-confined models. At similar, late, subsonic/pressure-confined stages, the structure is vulnerable to disruption by ambient turbulence, especially if the latter is an important contributor to a high-pressure situation. In the meantime, both models in Figure 5 also clearly show compression in the shell caused by supersonic SN impacts around 4.1 Myr. Additional, subsequent SN impacts also can be seen in the models. We do note that DEM L25 is the only object whose age in Figure 1 is somewhat inconsistent with the predicted stellar population. For a standard IMF, one 40 star is expected to have existed, which presumably has since exploded, implying an age of 5.3 – 7.8 Myr. The evolutionary sequence in Figure 5 shows pc, vs the observed 43 pc, at that stage. This is not a large discrepancy, and the existence of the putative SN progenitor is also extremely uncertain in view of the stochastic effects in the IMF.


We also compare with similar models assuming a lower ambient pressure of , implemented as described above. Figures 6 and 7 show the models corresponding to the observed radii for the same six objects. While this ambient value is more consistent with standard expectations, it is apparent that the models are in poor agreement with the data. The collective ages are systematically too young, thus demonstrating the ubiquitous growth-rate discrepancy, and the predicted shell parameters are more difficult to reconcile with the observations. Since none of the objects have reached the SN stage, the Post-SN objects retain thick, extended shells. Indeed, all but one of the objects are predicted to have a surrounding ionized halo that is at most a factor of 3 lower in density than the inner shell; these halos are not observed. Another especially interesting feature in these models is the appearance of a double shell structure: a second, neutral shell is seen at roughly 2 – 3 times the radius of the ionized inner shell. This outer shell results from the expansion of the photoionized H II region in a D-type ionization front. Oey et al. (2002) presented H I observations of the three post-SN objects (DEM L25, DEM L50, and DEM L301), at a spatial resolution of (12.5 pc); they found no apparent evidence of such secondary shells. The existence of neutral secondary shells could potentially offer a diagnostic of lower ambient pressures. Figures 7 and 8 also show the predicted velocity structure and H line profiles for these young objects, which, as expected, are less consistent with the observations in Table 1, than are Figures 2 and 3.
4. Conclusion
Our models clearly show that increasing the ambient interstellar pressure by an order of magnitude, from to , can impede the shell growth to a degree that could fully account for the observed growth-rate discrepancy. In §2, we presented arguments that such high interstellar pressures could exist, especially based on the dependence of on star-formation rate. While other factors mentioned in §1, namely, overestimated , elevated radiative cooling, and viewing geometry, could all be additional factors that contribute to the growth-rate discrepancy, we note that the multi-phase gas morphology is more consistent with high interstellar pressure dominating this effect.
Finally, as noted by Oey & Clarke (1997), the assumed global value of plays a critical role in determining the characteristic final sizes of old, SN-dominated superbubbles, and hence, the superbubble size distribution, which is dominated by pressure-confined shells. This, in turn, determines the interstellar porosity and filling factor of the hot, ionized medium in star-forming galaxies. With adequate clarification in the superbubble evolution process and input parameters, the superbubble sizes, kinematics, and morphologies could potentially provide barometers for the interstellar pressure. These diagnostics could be especially useful in other galaxies, which have fewer available empirical pressure indicators than the Milky Way.
References
- (1) Arthur, S. J. & Henney, W. J. 1996, ApJ, 457, 752
- (2) Beck, R. 2004, in From Observations to Self-Consistent Modelling of the ISM in Galaxies, eds. M. A. de Avillez & D. Breitschwerdt, Ap&SS, 289, 293
- (3) Bodenheimer, P., Tenorio-Tagle, G., & Yorke, H. W. 1979, ApJ, 233, 85
- (4) Boulares, A., & Cox, D. P. 1990, ApJ, 365, 544
- (5) Brown, A. G. A., Hartmann, D., & Burton, W. B. 1995, A&A, 300, 903
- (6) Castor, J. I., McCray, R., & Weaver, R., 1975, ApJ, 200, L107
- (7) Chu, Y.-H., Chang, H.-W., Su, Y.-L., & Mac Low, M.-M., 1995, ApJ, 450, 157
- (8) Chu, Y.-H., Gruendl, R. A., & Guerrero, M. A. 2003, RevMexAA, 15, 62
- (9) Chu, Y.-H. & Mac Low, M-M., 1990, ApJ, 365, 510
- (10) Cowie, L. L. & McKee, C. F. 1977, ApJ, 211, 135
- (11) Crutcher, R. M., 1999, ApJ, 520, 706
- (12) Dalgarno, A. & McCray, R. A. 1972, ARAA, 10, 375
- (13) Dopita, M. A., Ford, V. L., McGregor, P. J., Mathewson, D. S., & Wilson, I. R., 1981, ApJ, 250, 103
- (14) Drissen, L., Moffat, A. F. J., Walborn, N. R., & Shara, M. R. 1995, AJ, 110, 2235
- (15) Edgar, R. J. & Cox, D. P. 1993, ApJ, 413, 190
- (16) García-Segura, G. & Franco, J. 1996, ApJ, 469, 171
- (17) García-Segura, G. & Mac Low, M.-M. 1995, ApJ, 455, 145
- (18) Hunter, D. A., Boyd, D. M., & Hawley, W. N. 1995, ApJS, 99, 551
- (19) Jenkins, E. B. & Tripp, T. M. 2001, ApJS, 137, 297
- (20) Kim, J., Mac Low, M.-M., & Balsara, D. S. 2001, JKAS, 34, 333
- (21) Kritsuk, A. G. & Norman, M. L. 2002, ApJ, 569, L127
- (22) Lord, S. D., Hollenbach, D. J., Haas, M. R., Rubin, R. H., Colgan, S. W. J., & Erickson, E. F. 1996, ApJ, 465, 703
- (23) Maciejewski, W. & Cox, D. P. 1999, ApJ, 511, 792
- (24) MacDonald, J., & Bailey, M. E. 1981, MNRAS, 197, 995
- (25) Mac Low, M.-M., Balsara, D. S., de Avillez, M. A., & Kim, J. 2001, BAAS, 198, #65.10
- (26) Mac Low, M.-M., Chang, T. H., Chu, Y.-H., Points, S. D., Smith, R. C., & Wakker, B. P. 1998, ApJ, 493, 260
- (27) Mac Low M.-M. & McCray R. 1988, ApJ, 324, 776
- (28) Malhotra, S., et al. 2001, ApJ, 561, 766
- (29) McKee, C. F., Van Buren, D., & Lazareff, B. 1984, ApJ, 278, L115
- (30) Oey, M. S. 2004, in From Observations to Self-Consistent Modelling of the ISM in Galaxies, eds. M. A. de Avillez & D. Breitschwerdt, Ap&SS, 289, 269
- (31) Oey, M. S. 1996, ApJ, 467, 666 (O96)
- (32) Oey, M. S. 1996, ApJ, 465, 231
- (33) Oey, M. S. & Clarke, C. J. 1997, MNRAS, 289, 570
- (34) Oey, M. S., Groves, B., Staveley-Smith, L., & Smith, R. C. 2002, AJ, 123, 255
- (35) Oey, M. S., Clarke, C. J., & Massey, P. 2001, in Dwarf Galaxies and Their Environment, eds. K. S. de Boer, R.-J. Dettmar, & U. Klein, Shaker Verlag, 181.
- (36) Oey, M. S. & Kennicutt, R. C. 1997, MNRAS, 291, 827
- (37) Oey, M. S. & Massey, P., 1995, ApJ, 452, 210
- (38) Oey, M. S. & Smedley, S. A. 1998, AJ, 116, 1263
- (39) Pikel’ner S. B. 1968, Astrophys. Lett. 2, 97
- (40) Raymond, J. C., & Smith, B. W. 1977, ApJS, 35, 419
- (41) Saken, J. M., Shull, J. M., Garmany, C. D., Nichols-Bohlin, J., & Fesen, R. A. 1992, ApJ, 397, 537
- (42) Silich, S. A. & Franco, J. 1999, ApJ, 522, 863
- (43) Silich, S. A. & Oey, M.S. 2002, in Extragalactic Star Clusters, eds. E. K. Grebel, D. Geisler, & D. Minniti, San Francisco: ASP, 459
- (44) Silich, S. A., Tenorio-Tagle, G., Terlevich, R., Terlevich, E., & Netzer, H. 2001, MNRAS, 324, 191
- (45) Slavin, J. D. & Cox, D. P. 1992, ApJ, 392, 131
- (46) Slavin, J. D. & Cox, D. P. 1993, ApJ, 417, 187
- (47) Stone, J. M. & Norman, M. L. 1992, ApJS, 80, 753
- (48) Treffers, R. R. & Chu, Y.-H. 1982, ApJ, 254, 569
- (49) Vázquez-Semadeni, E. 2002, in Seeing Through the Dust: The Detection of H i and the Exploration of the ISM in Galaxies, eds. R. Taylor, T. Landecker, & A. Willis, (San Francisco: ASP), 155
- (50) Wallerstein, G., Vanture, A., & Jenkins, E. B. 1995, ApJ, 455, 590
- (51) Wang, Q. & Helfand, D. J. 1991, ApJ, 373, 497
- (52) Weaver R., McCray R., Castor J., Shapiro P., Moore R. 1977, ApJ, 218, 377